Unit 1 Content
•Introduction to transducers
• Selection of transducers
• Mechanical devices as primary detectors
• Basic requirements of an electrical transducers
• Mathematical model of transducer,
• Zero, I and II order transducers
• Response to
• impulse, step, ramp and sinusoidal inputs
2.
Introduction to transducers
Ameasuring device which measures and converts nonelectrical variable into
electrical variable is known as transducer. Transducers are classified into
several types. However, these can be categorized into five types. They are,
1. Classification on the basis of transduction principle used.
2. Active and passive transducers
3. Analog and digital transducers
4. Primary and secondary transducers
5. Transducers and inverse transducers
3.
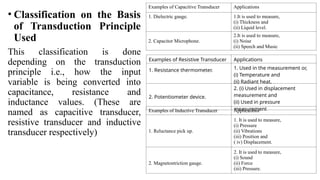
• Classification onthe Basis
of Transduction Principle
Used
This classification is done
depending on the transduction
principle i.e., how the input
variable is being converted into
capacitance, resistance and
inductance values. (These are
named as capacitive transducer,
resistive transducer and inductive
transducer respectively)
Examples of Capacitive Transducer Applications
1. Dielectric gauge. 1.It is used to measure,
(i) Thickness and
(ii) Liquid level.
2. Capacitor Microphone.
2.It is used to measure,
(i) Noise
(ii) Speech and Music
Examples of Resistive Transducer Applications
1. Resistance thermometer. 1. Used in the measurement or,
(i) Temperature and
(ii) Radiant heat.
2. Potentiometer device.
2. (i) Used in displacement
measurement and
(ii) Used in pressure
measurement
Examples of Inductive Transducer Applications
1. Reluctance pick up.
1. It is used to measure,
(i) Pressure
(ii) Vibrations
(iii) Position and
( iv) Displacement.
2. Magnetostriction gauge.
2. It is used to measure,
(i) Sound
(ii) Force
(iii) Pressure.
4.
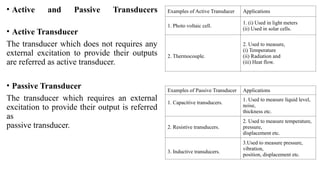
• Active andPassive Transducers
• Active Transducer
The transducer which does not requires any
external excitation to provide their outputs
are referred as active transducer.
• Passive Transducer
The transducer which requires an external
excitation to provide their output is referred
as
passive transducer.
Examples of Active Transducer Applications
1. Photo voltaic cell.
1. (i) Used in light meters
(ii) Used in solar cells.
2. Thermocouple.
2. Used to measure,
(i) Temperature
(ii) Radiation and
(iii) Heat flow.
Examples of Passive Transducer Applications
1. Capacitive transducers.
1. Used to measure liquid level,
noise,
thickness etc.
2. Resistive transducers.
2. Used to measure temperature,
pressure,
displacement etc.
3. Inductive transducers.
3.Used to measure pressure,
vibration,
position, displacement etc.
5.
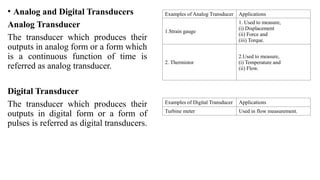
• Analog andDigital Transducers
Analog Transducer
The transducer which produces their
outputs in analog form or a form which
is a continuous function of time is
referred as analog transducer.
Digital Transducer
The transducer which produces their
outputs in digital form or a form of
pulses is referred as digital transducers.
Examples of Analog Transducer Applications
1.Strain gauge
1. Used to measure,
(i) Displacement
(ii) Force and
(iii) Torque.
2. Thermistor
2.Used to measure,
(i) Temperature and
(ii) Flow.
Examples of Digital Transducer Applications
Turbine meter Used in flow measurement.
6.
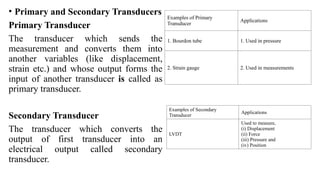
• Primary andSecondary Transducers
Primary Transducer
The transducer which sends the
measurement and converts them into
another variables (like displacement,
strain etc.) and whose output forms the
input of another transducer is called as
primary transducer.
Secondary Transducer
The transducer which converts the
output of first transducer into an
electrical output called secondary
transducer.
Examples of Primary
Transducer
Applications
1. Bourdon tube 1. Used in pressure
2. Strain gauge 2. Used in measurements
Examples of Secondary
Transducer
Applications
LVDT
Used to measure,
(i) Displacement
(ii) Force
(iii) Pressure and
(iv) Position
7.
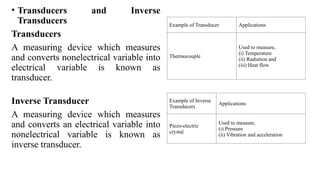
• Transducers andInverse
Transducers
Transducers
A measuring device which measures
and converts nonelectrical variable into
electrical variable is known as
transducer.
Inverse Transducer
A measuring device which measures
and converts an electrical variable into
nonelectrical variable is known as
inverse transducer.
Example of Transducer Applications
Thermocouple
Used to measure,
(i) Temperature
(ii) Radiation and
(iii) Heat flow
Example of Inverse
Transducers
Applications
Piezo-electric
crystal
Used to measure,
(i) Pressure
(ii) Vibration and acceleration
8.
Selection of transducers
Characteristicsof transducers
• The selection of most suitable transducer from commercially available instruments is very
important in designing an Instrumentation system.
• For the proper selection of transducer, knowledge of the performance
characteristics of them are essential.
• The performance characteristics can be classified into two namely
(i) Static characteristics
Static characteristics are a set of performance criteria that give a meaningful description of
the quality of measurement without becoming concerned with dynamic descriptions
involving differential equations.
(ii) Dynamic characteristics
Dynamic characteristics describe the quality of measurement when the measured quantities
vary rapidly with time. Here the dynamic relations between the instrument input and output
must be examined, generally by the use of differential equations.
9.
STATIC CHARACTERISTICS ANDSTATIC
CALIBRATION
• The most important static characteristics of a transducer are
1. Static sensitivity
2. Linearity
3. Accuracy
4. Precision
5. Resolution
6. Hysteresis
7. Range and span
8. Input impedance and loading effect.
10.
Static calibration
• Allthese static characteristics are obtained by one form or another of the
process of static calibration.
• In general, static calibration refers to a situation in which all inputs except the
desired one are kept at some constant values.
• The desired input is varied over some range in steps and the output values are
noted.
• The input - output relationship thus developed is called the static calibration
valid under the stated constant conditions of all the other inputs.
11.
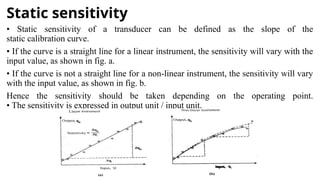
Static sensitivity
• Staticsensitivity of a transducer can be defined as the slope of the
static calibration curve.
• If the curve is a straight line for a linear instrument, the sensitivity will vary with the
input value, as shown in fig. a.
• If the curve is not a straight line for a non-linear instrument, the sensitivity will vary
with the input value, as shown in fig. b.
Hence the sensitivity should be taken depending on the operating point.
• The sensitivity is expressed in output unit / input unit.
12.
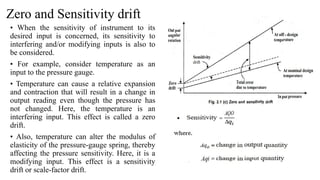
Zero and Sensitivitydrift
• When the sensitivity of instrument to its
desired input is concerned, its sensitivity to
interfering and/or modifying inputs is also to
be considered.
• For example, consider temperature as an
input to the pressure gauge.
• Temperature can cause a relative expansion
and contraction that will result in a change in
output reading even though the pressure has
not changed. Here, the temperature is an
interfering input. This effect is called a zero
drift.
• Also, temperature can alter the modulus of
elasticity of the pressure-gauge spring, thereby
affecting the pressure sensitivity. Here, it is a
modifying input. This effect is a sensitivity
drift or scale-factor drift.
13.
Linearity
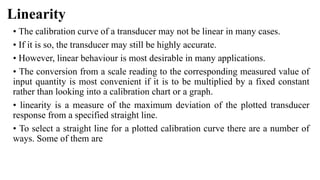
• The calibrationcurve of a transducer may not be linear in many cases.
• If it is so, the transducer may still be highly accurate.
• However, linear behaviour is most desirable in many applications.
• The conversion from a scale reading to the corresponding measured value of
input quantity is most convenient if it is to be multiplied by a fixed constant
rather than looking into a calibration chart or a graph.
• linearity is a measure of the maximum deviation of the plotted transducer
response from a specified straight line.
• To select a straight line for a plotted calibration curve there are a number of
ways. Some of them are
14.
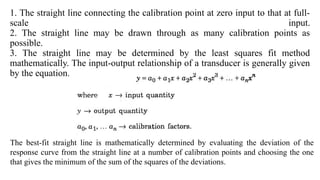
1. The straightline connecting the calibration point at zero input to that at full-
scale input.
2. The straight line may be drawn through as many calibration points as
possible.
3. The straight line may be determined by the least squares fit method
mathematically. The input-output relationship of a transducer is generally given
by the equation.
The best-fit straight line is mathematically determined by evaluating the deviation of the
response curve from the straight line at a number of calibration points and choosing the one
that gives the minimum of the sum of the squares of the deviations.
15.
Precision
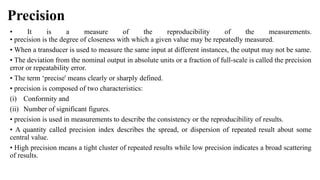
• It isa measure of the reproducibility of the measurements.
• precision is the degree of closeness with which a given value may be repeatedly measured.
• When a transducer is used to measure the same input at different instances, the output may not be same.
• The deviation from the nominal output in absolute units or a fraction of full-scale is called the precision
error or repeatability error.
• The term ‘precise' means clearly or sharply defined.
• precision is composed of two characteristics:
(i) Conformity and
(ii) Number of significant figures.
• precision is used in measurements to describe the consistency or the reproducibility of results.
• A quantity called precision index describes the spread, or dispersion of repeated result about some
central value.
• High precision means a tight cluster of repeated results while low precision indicates a broad scattering
of results.
16.
Hysteresis
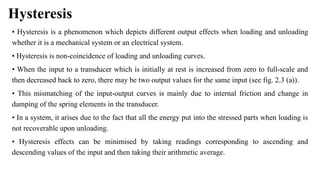
• Hysteresis isa phenomenon which depicts different output effects when loading and unloading
whether it is a mechanical system or an electrical system.
• Hysteresis is non-coincidence of loading and unloading curves.
• When the input to a transducer which is initially at rest is increased from zero to full-scale and
then decreased back to zero, there may be two output values for the same input (see fig. 2.3 (a)).
• This mismatching of the input-output curves is mainly due to internal friction and change in
damping of the spring elements in the transducer.
• In a system, it arises due to the fact that all the energy put into the stressed parts when loading is
not recoverable upon unloading.
• Hysteresis effects can be minimised by taking readings corresponding to ascending and
descending values of the input and then taking their arithmetic average.
17.
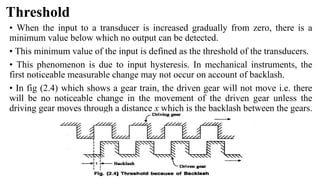
Threshold
• When theinput to a transducer is increased gradually from zero, there is a
minimum value below which no output can be detected.
• This minimum value of the input is defined as the threshold of the transducers.
• This phenomenon is due to input hysteresis. In mechanical instruments, the
first noticeable measurable change may not occur on account of backlash.
• In fig (2.4) which shows a gear train, the driven gear will not move i.e. there
will be no noticeable change in the movement of the driven gear unless the
driving gear moves through a distance x which is the backlash between the gears.
18.
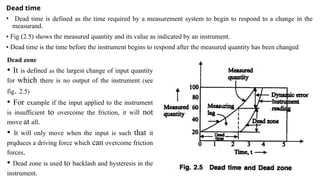
Dead time
• Deadtime is defined as the time required by a measurement system to begin to respond to a change in the
measurand.
• Fig (2.5) shows the measured quantity and its value as indicated by an instrument.
• Dead time is the time before the instrument begins to respond after the measured quantity has been changed
Dead zone
• It is defined as the largest change of input quantity
for which there is no output of the instrument, (see
fig. 2.5)
• For example if the input applied to the instrument
is insufficient to overcome the friction, it will not
move at all.
• It will only move when the input is such that it
prqduces a driving force which can overcome friction
forces.
• Dead zone is used to backlash and hysteresis in the
instrument.
19.
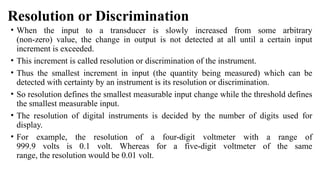
Resolution or Discrimination
•When the input to a transducer is slowly increased from some arbitrary
(non-zero) value, the change in output is not detected at all until a certain input
increment is exceeded.
• This increment is called resolution or discrimination of the instrument.
• Thus the smallest increment in input (the quantity being measured) which can be
detected with certainty by an instrument is its resolution or discrimination.
• So resolution defines the smallest measurable input change while the threshold defines
the smallest measurable input.
• The resolution of digital instruments is decided by the number of digits used for
display.
• For example, the resolution of a four-digit voltmeter with a range of
999.9 volts is 0.1 volt. Whereas for a five-digit voltmeter of the same
range, the resolution would be 0.01 volt.
20.
Range and span
•Generally a transducer is recommended to be used between a high and a low
values of input.
• The range of the transducer is specified as from the low value of input to the
high value of input.
• The span of the transducer is specified as the difference between the high and
the low limits of recommended input values.
• For example, if a temperature transducer is recommended to be used between
100°C and 500°C, its range is specified as 100°C to 500°C,
whereas its span is 400°C (i.e. 500°C - 100°C = 400°C).
• When an ammeter is specified to be used between 0 and 100 mA, its range is 0
to 100 mA and its span is 100 mA (i.e. 100 mA - 0 mA =
100 mA).
21.
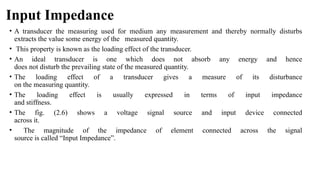
Input Impedance
• Atransducer the measuring used for medium any measurement and thereby normally disturbs
extracts the value some energy of the measured quantity.
• This property is known as the loading effect of the transducer.
• An ideal transducer is one which does not absorb any energy and hence
does not disturb the prevailing state of the measured quantity.
• The loading effect of a transducer gives a measure of its disturbance
on the measuring quantity.
• The loading effect is usually expressed in terms of input impedance
and stiffness.
• The fig. (2.6) shows a voltage signal source and input device connected
across it.
• The magnitude of the impedance of element connected across the signal
source is called “Input Impedance”.
22.
DYNAMIC CHARACTERISTICS OF
TRANSDUCERS
•The dynamic characteristics of a transducer refers to the performance of the
transducer when it is subjected to time-varying input.
• The number of parameters required to define the dynamic behaviour
of a transducer is decided by the group to which the transducer belongs.
• The transducers can be categorized into
1. Zero-order transducers
2. first-order transducers
3. Second-order transducers
4. Higher-order transducers
24.
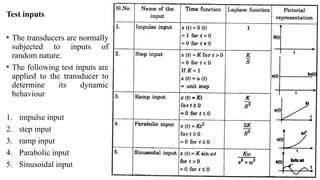
Test inputs
• Thetransducers are normally
subjected to inputs of
random nature.
• The following test inputs are
applied to the transducer to
determine its dynamic
behaviour
1. impulse input
2. step input
3. ramp input
4. Parabolic input
5. Sinusoidal input
25.
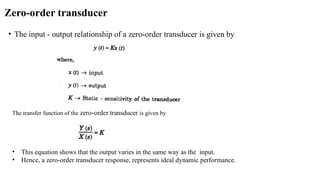
Zero-order transducer
• Theinput - output relationship of a zero-order transducer is given by
The transfer function of the zero-order transducer is given by
• This equation shows that the output varies in the same way as the input.
• Hence, a zero-order transducer response, represents ideal dynamic performance.
26.
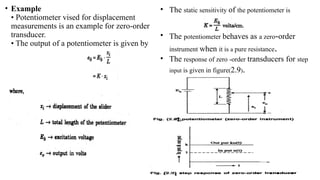
• Example
• Potentiometervised for displacement
measurements is an example for zero-order
transducer.
• The output of a potentiometer is given by
• The static sensitivity of the potentiometer is
• The potentiometer behaves as a zero-order
instrument when it is a pure resistance.
• The response of zero -order transducers for step
input is given in figure(2.9).
27.
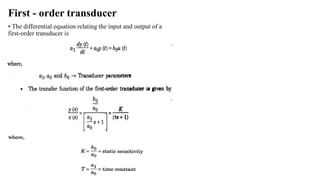
First - ordertransducer
• The differential equation relating the input and output of a
first-order transducer is