Download as PDF, PPTX


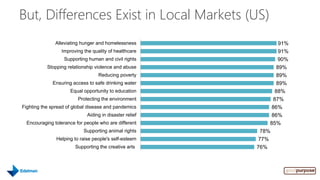


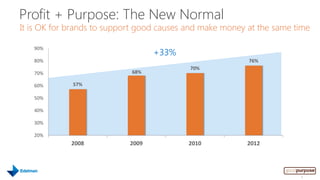

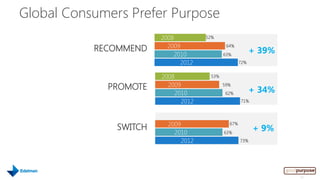


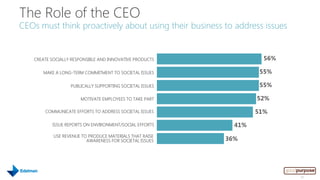
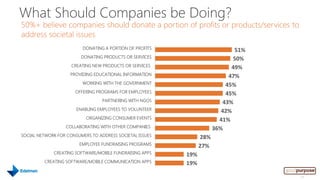


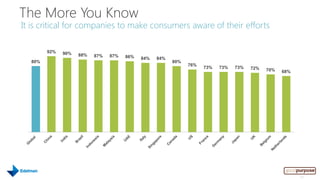
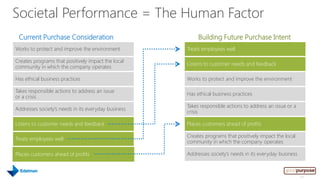


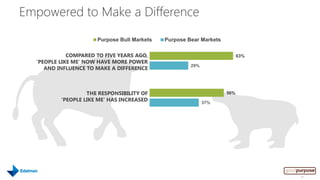


The 2012 Goodpurpose Edelman Global Consumer Survey analyzed consumer attitudes towards brands and societal issues across 16 countries, highlighting that consumers prioritize social purpose alongside quality and price in their purchasing decisions. The survey revealed a strong global demand for brands to engage in societal causes, with 89% of respondents believing that businesses should balance profit with societal contributions. Additionally, empowered consumers in 'purpose bull markets' show higher trust in and willingness to support brands that are ethically responsible.


