Download as PDF, PPTX

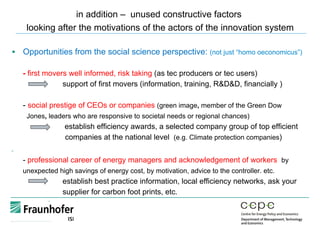
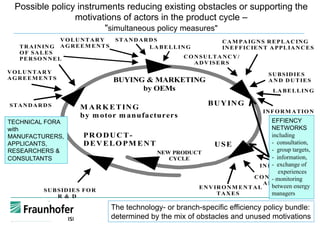
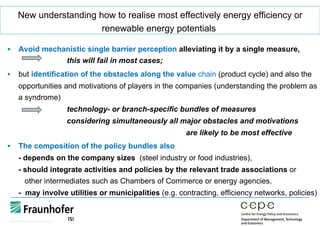
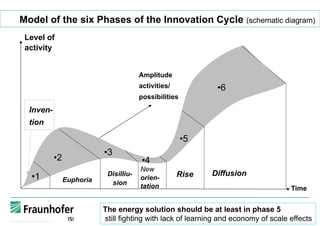
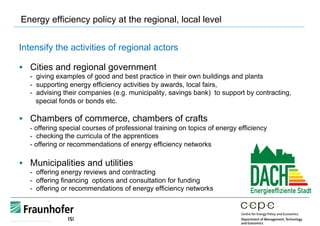
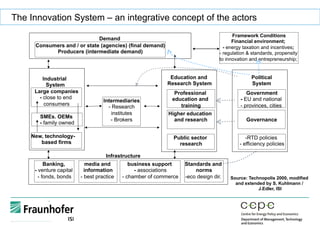
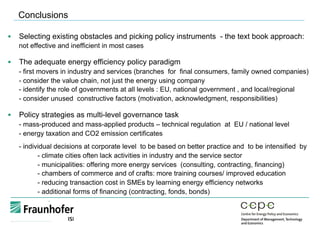

This document discusses energy efficiency policy as a multi-level governance task. It argues that traditional textbook approaches focusing on single barriers and measures are ineffective. Instead, an adequate policy considers obstacles along the entire value chain, identifies roles for different levels of government, and leverages unused motivations. Effective strategies include technical regulations for mass-produced products, carbon pricing, improved practices through networks, and local governments providing energy services to reduce transaction costs for businesses. Overall, the document advocates an integrated policy approach that addresses multiple actors and barriers across different governance levels.


