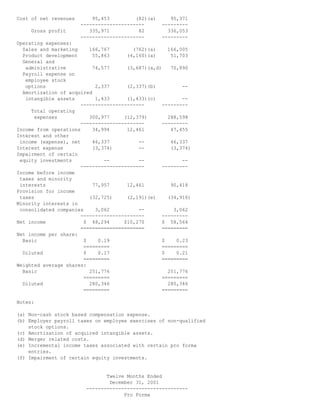
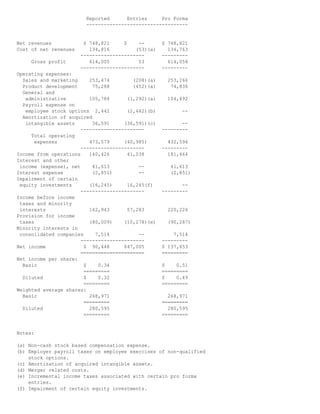
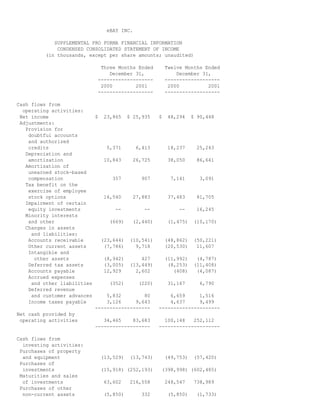
eBay Announces Fourth Quarter and Year End 2001 Financial Results
Record Quarterly Net Revenues of $219.4 Million
Record Pro Forma EPS of $0.14
SAN JOSE, Calif. Jan. 15, 2002 - eBay Inc. (Nasdaq:EBAY)(www.ebay.com), the world's online marketplace, reported financial
results for its fourth quarter and fiscal year ended December 31, 2001.
Consolidated net revenues for the quarter ended December 31, 2001, totaled a record $219.4 million, representing a 64%
increase over the $134.0 million generated in the same period last year. Consolidated net income for the quarter was $25.9
million, or $0.09 per diluted share. eBay's pro forma consolidated net income, excluding certain charges, was a record $38.5
million, or $0.14 per diluted share.
For the full year, eBay generated consolidated net revenues of $748.8 million, representing 74% annual growth. Consolidated
net income for the year was $90.4 million, or $0.32 per diluted share. On a pro forma basis, excluding certain charges, eBay
reported consolidated net income of $137.5 million, or $0.49 per diluted share. This represents 135% year-over-year growth in
pro forma net income as compared to the $58.6 million reported in 2000, and 133% growth in pro forma earnings per share as
compared to $0.21 in 2000.
"Our fourth quarter results capped off an outstanding year," said Meg Whitman, President and CEO of eBay. "We have
excellent momentum going into 2002 and feel confident with our long-term strategy, ongoing execution and the inherent
strength of our business model."
Based on the momentum in the business, eBay now believes that revenues for the first half of 2002 could be approximately
$490 to $510 million. The company also continues to believe that pro forma earnings per share over the same period could
range between $0.32 to $0.33 per diluted share.
Key Financial and Operating Metrics
Online Net Revenues -- eBay reported record online net revenues of $211.6 million, representing 72% year-over-year growth
from the $123.1 million reported in Q4-00.
Gross Profit -- eBay reported record gross profit totaling $179.4 million or 82% of net revenues during the quarter, which is
consistent with the 82% gross profit reported in Q4-00.
Pro Forma Operating Income -- eBay reported record pro forma operating income, which excludes certain charges, totaling
$55.4 million, or 25% of net revenues. This represents a 95% increase over Q4-00 pro forma operating income of $28.4
million, or 21% of Q4-00 net revenues.
Pro Forma Net Income -- eBay reported record pro forma net income, which excludes certain charges, totaling $38.5 million, or
$0.14 per diluted share. This earnings level represents a 54% increase over Q4-00 pro forma net income of $25.0 million.
Operating and Free Cash Flows -- For the quarter, eBay reported $83.7 million in operating cash flows, 143% higher than the
$34.5 million reported in Q4-00. Free cash flows for Q4-01 were $69.9 million, 234% higher than the $20.9 million reported in
Q4-00. For the full year 2001, eBay generated a record $252.1 million in operating cash flows, representing 152% growth
versus operating cash flows of $100.1 million in 2000. For the full year 2001, free cash flows grew to $194.7 million, 286%
higher than the $50.4 million reported in 2000.
Gross Merchandise Sales -- eBay users transacted a record $2.735 billion in gross merchandise sales during the fourth
quarter, representing a 69% year-over-year increase from the $1.616 billion reported in Q4-00.
Listings -- eBay hosted a record 126.5 million listings during the quarter, representing 59% year-over-year growth.
Registered Users -- eBay added a record 4.8 million users, to end Q4-01 with 42.4 million confirmed registered users. This
level represents an 88% increase over the 22.5 million users reported at the end of Q4-00.
Key Execution Highlights
Holiday Highlights
According to Jupiter Media Metrix, eBay was the No. 1 online holiday shopping destination, with nearly 5 million unique daily
visitors during the peak December shopping season.
Average auction duration on eBay.com decreased almost 10% versus December 2000, as a result of increased adoption of
eBay's Buy It Now feature, which was offered as an option on 45% of eBay.com listings during the month of December.
Geographic Expansion
On a fully allocated basis, eBay's international business achieved operating profitability for the first time in Q4-01, ahead of
expectations.
Net revenues from international operations contributed 18% of Q4-01 consolidated net revenues, up from 16% in Q3-01,
highlighted by 51% sequential net revenue growth in Germany, 26% sequential net revenue growth in Canada, and 25%
sequential net revenue growth in the U.K.
In the U.S. business, online revenues excluding advertising grew 10% sequentially, representing an acceleration from the
quarter-over-quarter growth rate in Q3-01. Including advertising, online revenues in the U.S. were up 11% sequentially, which
also represents an acceleration versus the quarter-over-quarter growth rate in Q3-01.
The company successfully integrated the former iBazar Spain site into eBay's global technology platform on January 8, 2002,
following the integrations of the French, Italian and Dutch sites. With the changeover of the Belgian site, eBay expects to
complete the iBazar integration process by the end of Q1-02.
Category and Pricing Format Development
The company achieved strong quarter-over-quarter growth in gross merchandise sales across virtually all meta-level
categories. The largest categories in Q4-01 were eBay Motors, computers, consumer electronics, collectibles,
books/movies/music, sports and toys.
eBay's fixed price initiatives, Buy It Now, Half.com and eBay Stores, contributed more than 19% of total gross merchandise
sales in Q4-01, up sequentially from 16% in Q3-01.
Gross merchandise sales processed using eBay Payments by Billpoint increased 14% sequentially and 263% year-over-year.
Revenues from third party advertisers represented approximately 13% of net revenues, roughly the same percentage as in Q3-
01.
Technology Infrastructure
eBay achieved 99.9% site availability for the second consecutive quarter. At the same time, eBay supported 300 million page
views per day, 20% more than in Q3, and sent out more than 1.5 giga-bits of data per second, a 25% sequential increase.
The company successfully implemented the first components of V3, eBay's next generation technology platform.
Community Development
eBay's "Auction for America" successfully raised $10 million to help the victims, their families and the communities affected by
the terrorist attacks of September 11. The fundraising tool created for "Auction for America" will become a permanent feature
for charities using eBay.
Financial and Operating Summary
For the fourth quarter, the company reported net revenues of $219.4 million, representing a 64% year-over-year increase. The
sequential increase was driven largely by better-than-expected holiday sales in the U.S. online business, strong international
growth, solid contributions from eBay Motors and eBay Payments by Billpoint, and continued success in the development of
third party advertising revenues. Net revenues from eBay's offline segment contributed $7.8 million in Q4-01 net revenues, as
compared to the $10.9 million reported in Q4-00.
Gross profit as a percentage of net revenues held steady with the prior quarter at 82%.
Sales and marketing expenses totaled $71.6 million, or 33% of net revenues, which compares favorably to the 34% of net
revenues reported in Q3-01 and the 37% reported in Q4-00. The sequential dollar increase of approximately $5.3 million
resulted primarily from increases in online and offline marketing campaigns, iBazar integration and staff additions to our
category and business development teams.
Product development costs totaled $21.7 million, or approximately 10% of net revenues in Q4-01, consistent with Q3-01, and
down from 11% of net revenues in Q4-00. The sequential dollar increase of approximately $1.5 million resulted primarily from
site feature and functionality improvements, iBazar integration and V3 architecture development.
General and administrative costs totaled $31.2 million, or about 14% of net revenues, compared with 14% in Q3-01 and 14% in
Q4-00. The sequential dollar increase of approximately $3.6 million resulted principally from costs associated with international
expansion, legal expenses and general infrastructure growth.
Net interest and other income totaled $6.5 million in Q4-01, down from the $11.6 million reported in Q4-00, reflecting the lower
interest rate environment.
eBay recorded a consolidated tax provision of $24.0 million, representing a 48% effective tax rate on Q4-01 consolidated pre-
tax income. The effective rate includes the impact of non-deductible goodwill amortization and losses in certain international
jurisdictions. On a pro forma basis, excluding certain charges, the consolidated effective tax rate remained consistent with the
prior quarter at 40%.
eBay's balance sheet remains very strong as the company ended the quarter with consolidated assets approaching $1.7
billion, including $1.1 billion in aggregate cash and investments.
For the quarter, eBay reported $83.7 million in operating cash flows, 143% higher than the $34.5 million reported in Q4-00.
$27.9 million of this amount is attributable to tax benefits on certain stock option exercises. Free cash flows for Q4-01 were
$69.9 million, 234% higher than the $20.9 million reported in Q4-00. For the full year 2001, eBay generated a record $252.1
million in operating cash flows, representing 152% growth versus operating cash flows of $100.1 million in 2000. Of the $252.1
million in operating cash flows, $81.7 million is attributable to tax benefits on certain stock option exercises. For the full year
2001, free cash flows grew to $194.7 million, 286% higher than the $50.4 million reported in 2000.
Business Outlook
Based on the momentum in the business, eBay now believes that revenues for the first half of 2002 could be approximately
$490 to $510 million. Further, eBay expects that Q1-02 net revenue growth will be driven primarily by transactions, both in the
U.S. and in international markets. Given the difficult environment for online advertising, the company believes that advertising
revenues as a percentage of net revenues will be down in Q1-02.
eBay continues to execute on a strategy that balances increasing bottom-line returns with investments in future growth. Near-
term investments include international development and selective expansion, broadening and deepening category offerings,
development of fixed price formats and other merchandising options, improving the user experience, ongoing development of
eBay's next generation architecture, and attracting new buyers and sellers to the eBay platform while building loyalty with
eBay's existing community of users.
As a result of its higher net revenue outlook, eBay believes that these incremental investments can be made while delivering
improved sequential bottom line profitability. Accordingly, eBay continues to believe pro forma earnings per share for the first
half of 2002 could range between $0.32 and $0.33 per diluted share.
About eBay
eBay is The World's Online Marketplace(TM). Founded in 1995, eBay created a powerful platform for the sale of goods and
services by a passionate community of individuals and businesses. On any given day, there are millions of items across
thousands of categories for sale on eBay, as well as on Half.com, eBay's site dedicated to fixed price trading. eBay enables
trade on a local, national and international basis with customized sites in markets around the world.
Forward Looking Statements
This announcement contains forward-looking statements that involve risks and uncertainties, including those relating to the
company's ability to grow its business and user base. Actual results could differ materially from those discussed. Factors that
could cause or contribute to such differences include, but are not limited to, the company's need to manage both an
increasingly broad range of businesses and significant growth, to deal with the increasingly competitive environment for online
trading, to manage regulatory and litigation risks, to maintain site stability and continue to expand its model to new types of
merchandise and sellers and to continue to expand outside of the U.S., as well as the timing and commercial success of new
features and functions added to the company's sites, the price and demand for advertising offered by the company, the
success of the company's commercial partners, and the costs of announced and prospective joint ventures, acquisitions and
other commercial transactions. More information about potential factors which could affect the company's business and
financial results is included in the company's Annual Report on Form 10-K for the year ended December 31, 2000, and the
company's Quarterly Reports on Form 10-Q for the periods ended March 31, 2001, June 30, 2001 and September 30, 2001.
All forward-looking statements are based on information available to the company on the date hereof, and the company
assumes no obligation to update such statements.
eBAY INC.
CONDENSED CONSOLIDATED BALANCE SHEET
(in thousands; unaudited)
December 31, December 31,
2000 2001
------------ ------------
ASSETS
Current assets:
Cash and cash
equivalents $ 201,873 $ 523,969
Short-term investments 354,166 199,450
Accounts receivable, net 67,163 101,703
Other current assets 52,262 58,683
------------ ------------
Total current assets 675,464 883,805
Long-term investments 218,197 286,998
Restricted cash and
investments 126,390 129,614
Property and equipment, net 125,161 142,349
Intangible assets, net 13,063 198,639
Deferred tax asset 13,892 21,540
Other assets 10,236 15,584
------------ ------------
$ 1,182,403 $ 1,678,529
============ ============
LIABILITIES AND STOCKHOLDERS' EQUITY
Current liabilities:
Accounts payable $ 31,725 $ 33,235
Accrued expenses
and other current liabilities 66,697 94,593
Deferred revenue and
customer advances 12,656 15,583
Short-term debt 15,272 16,111
Income taxes payable 11,092 20,617
----------- ------------
Total current liabilities 137,442 180,139
Long term debt 11,404 12,008
Other liabilities 6,549 19,493
Minority interests 13,248 37,751
----------- ------------
Total liabilities 168,643 249,391
----------- ------------
Total stockholders' equity 1,013,760 1,429,138
----------- ------------
$ 1,182,403 $ 1,678,529
=========== ===========
eBAY INC.
CONDENSED CONSOLIDATED STATEMENT OF INCOME
(in thousands, except per share amounts; unaudited)
Three Months Ended Twelve Months Ended
December 31, December 31,
----------------------- ---------------------
2000 2001 2000 2001
----------------------- ---------------------
Net revenues $ 134,008 $ 219,401 $ 431,424 $ 748,821
Cost of net revenues 23,954 39,989 95,453 134,816
----------------------- ---------------------
Gross profit 110,054 179,412 335,971 614,005
----------------------- ---------------------
Operating expenses:
Sales and marketing 49,039 71,554 166,767 253,474
Product development 14,142 21,723 55,863 75,288
General and
administrative 19,003 31,246 74,577 105,784
Payroll expense on
employee stock options 585 881 2,337 2,442
Amortization of acquired
intangible assets 554 12,390 1,433 36,591
----------------------- ---------------------
Total operating
expenses 83,323 137,794 300,977 473,579
----------------------- ---------------------
Income from operations 26,731 41,618 34,994 140,426
Interest and other
income (expense), net 12,114 7,186 46,337 41,613
Interest expense (538) (722) (3,374) (2,851)
Impairment of certain
equity investments -- -- -- (16,245)
----------------------- ---------------------
Income before income
taxes and minority
interests 38,307 48,082 77,957 162,943
Provision for income
taxes (15,910) (24,038) (32,725) (80,009)
Minority interests in
consolidated companies 1,468 1,891 3,062 7,514
----------------------- ---------------------
Net income $ 23,865 $ 25,935 $ 48,294 $ 90,448
======================= ====================
Net income per share:
Basic $ 0.09 $ 0.09 $ 0.19 $ 0.34
======================= ===================
Diluted $ 0.09 $ 0.09 $ 0.17 $ 0.32
======================= ====================
Weighted average shares:
Basic 259,789 274,599 251,776 268,971
======================= ====================
Diluted 279,822 283,564 280,346 280,595
======================= ====================
eBAY INC.
SUPPLEMENTAL PRO FORMA FINANCIAL INFORMATION
CONDENSED CONSOLIDATED STATEMENT OF INCOME
(in thousands, except per share amounts; unaudited)
The accompanying supplemental pro forma financial information is
presented for informational purposes only and should not be considered
as a substitute for the historical financial information presented in
accordance with generally accepted accounting principles.
Three Months Ended
December 31, 2001
------------------
Pro Forma
Reported Entries Pro Forma
-----------------------------------
Net Revenues $ 134,008 $ -- $ 134,008
Cost of net
revenues 23,954 (10)(a) 23,944
---------------------- ---------
Gross profit 110,054 10 110,064
---------------------- ---------
Operating expenses:
Sales and
marketing 49,039 (63)(a) 48,976
Product
development 14,142 (170)(a) 13,972
General and
administrative 19,003 (297)(a,d) 18,706
Payroll expense
on employee
stock options 585 (585)(b) --
Amortization of
acquired
intangible
assets 554 (554)(c) --
---------------------- ---------
Total operating
expenses 83,323 (1,669) 81,654
---------------------- ---------
Income from
operations 26,731 1,679 28,410
Interest and
other income
(expense), net 12,114 -- 12,114
Interest
expense (538) -- (538)
Impairment of
certain
equity
investments -- -- --
---------------------- ---------
Income before
income taxes
and minority
interests 38,307 1,679 39,986
Provision for
income taxes (15,910) (503)(e) (16,413)
Minority interests
in consolidated
companies 1,468 -- 1,468
---------------------- ---------
Net income $ 23,865 $ 1,176 $ 25,041
====================== =========
Net income per share:
Basic $ 0.09 $ 0.10
========= =========
Diluted $ 0.09 $ 0.09
========= =========
Weighted average shares:
Basic 259,789 259,789
========= =========
Diluted 279,822 279,822
========= =========
Three Months Ended
December 31, 2001
------------------
Pro Forma
Reported Entries Pro Forma
-----------------------------------
Net Revenues $ 219,401 $ 219,401
Cost of net
revenues 39,989 (19)(a) 39,970
---------------------- ---------
Gross profit 179,412 19 179,431
---------------------- ---------
Operating
expenses:
Sales and
marketing 71,554 (47)(a) 71,507
Product
development 21,723 (96)(a) 21,627
General and
administrative 31,246 (364)(a) 30,882
Payroll expense
on employee
stock options 881 (881)(b) --
Amortization of
acquired
intangible
assets 12,390 (12,390)(c) --
---------------------- ---------
Total operating
expenses 137,794 (13,778) 124,016
---------------------- ---------
Income from
operations 41,618 13,797 55,415
Interest and
other income
(expense), net 7,186 -- 7,186
Interest
expense (722) -- (722)
Impairment of
certain equity
investments -- -- --
---------------------- ---------
Income before
income taxes
and minority
interests 48,082 13,797 61,879
Provision for
income taxes (24,038) (1,259)(e) (25,297)
Minority interests
in consolidated
companies 1,891 -- 1,891
---------------------- ---------
Net income $ 25,935 $ 12,538 $ 38,473
====================== =========
Net income per share:
Basic $ 0.09 $ 0.14
========= =========
Diluted $ 0.09 $ 0.14
========= =========
Weighted average shares:
Basic 274,599 274,599
========= =========
Diluted 283,564 283,564
========= =========
Notes:
(a) Non-cash stock based compensation expense.
(b) Employer payroll taxes on employee exercises of non-qualified
stock options.
(c) Amortization of acquired intangible assets.
(d) Merger related costs.
(e) Incremental income taxes associated with certain pro forma
entries.
eBAY INC.
SUPPLEMENTAL PRO FORMA FINANCIAL INFORMATION
CONDENSED CONSOLIDATED STATEMENT OF INCOME
(in thousands, except per share amounts; unaudited)
The accompanying supplemental pro forma financial information is
presented for informational purposes only and should not be considered
as a substitute for the historical financial information presented in
accordance with generally accepted accounting principles.
Twelve Months Ended
December 31, 2000
-----------------------------------
Pro Forma
Reported Entries Pro Forma
-----------------------------------
Net revenues $ 431,424 $ -- $ 431,424
Cost of net revenues 95,453 (82)(a) 95,371
---------------------- ---------
Gross profit 335,971 82 336,053
---------------------- ---------
Operating expenses:
Sales and marketing 166,767 (762)(a) 166,005
Product development 55,863 (4,160)(a) 51,703
General and
administrative 74,577 (3,687)(a,d) 70,890
Payroll expense on
employee stock
options 2,337 (2,337)(b) --
Amortization of acquired
intangible assets 1,433 (1,433)(c) --
---------------------- ---------
Total operating
expenses 300,977 (12,379) 288,598
---------------------- ---------
Income from operations 34,994 12,461 47,455
Interest and other
income (expense), net 46,337 -- 46,337
Interest expense (3,374) -- (3,374)
Impairment of certain
equity investments -- -- --
---------------------- ---------
Income before income
taxes and minority
interests 77,957 12,461 90,418
Provision for income
taxes (32,725) (2,191)(e) (34,916)
Minority interests in
consolidated companies 3,062 -- 3,062
---------------------- ---------
Net income $ 48,294 $10,270 $ 58,564
====================== =========
Net income per share:
Basic $ 0.19 $ 0.23
========= =========
Diluted $ 0.17 $ 0.21
========= =========
Weighted average shares:
Basic 251,776 251,776
========= =========
Diluted 280,346 280,346
========= =========
Notes:
(a) Non-cash stock based compensation expense.
(b) Employer payroll taxes on employee exercises of non-qualified
stock options.
(c) Amortization of acquired intangible assets.
(d) Merger related costs.
(e) Incremental income taxes associated with certain pro forma
entries.
(f) Impairment of certain equity investments.
Twelve Months Ended
December 31, 2001
-----------------------------------
Pro Forma
Reported Entries Pro Forma
-----------------------------------
Net revenues $ 748,821 $ -- $ 748,821
Cost of net revenues 134,816 (53)(a) 134,763
---------------------- ---------
Gross profit 614,005 53 614,058
---------------------- ---------
Operating expenses:
Sales and marketing 253,474 (208)(a) 253,266
Product development 75,288 (452)(a) 74,836
General and
administrative 105,784 (1,292)(a) 104,492
Payroll expense on
employee stock options 2,442 (2,442)(b) --
Amortization of acquired
intangible assets 36,591 (36,591)(c) --
---------------------- ---------
Total operating
expenses 473,579 (40,985) 432,594
---------------------- ---------
Income from operations 140,426 41,038 181,464
Interest and other
income (expense), net 41,613 -- 41,613
Interest expense (2,851) -- (2,851)
Impairment of certain
equity investments (16,245) 16,245(f) --
---------------------- ---------
Income before income
taxes and minority
interests 162,943 57,283 220,226
Provision for income
taxes (80,009) (10,278)(e) (90,287)
Minority interests in
consolidated companies 7,514 -- 7,514
---------------------- ---------
Net income $ 90,448 $47,005 $ 137,453
====================== =========
Net income per share:
Basic $ 0.34 $ 0.51
========= =========
Diluted $ 0.32 $ 0.49
========= =========
Weighted average shares:
Basic 268,971 268,971
========= =========
Diluted 280,595 280,595
========= =========
Notes:
(a) Non-cash stock based compensation expense.
(b) Employer payroll taxes on employee exercises of non-qualified
stock options.
(c) Amortization of acquired intangible assets.
(d) Merger related costs.
(e) Incremental income taxes associated with certain pro forma
entries.
(f) Impairment of certain equity investments.
eBAY INC.
SUPPLEMENTAL PRO FORMA FINANCIAL INFORMATION
CONDENSED CONSOLIDATED STATEMENT OF INCOME
(in thousands, except per share amounts; unaudited)
Three Months Ended Twelve Months Ended
December 31, December 31,
------------------- -------------------
2000 2001 2000 2001
------------------- -------------------
Cash flows from
operating activities:
Net income $ 23,865 $ 25,935 $ 48,294 $ 90,448
Adjustments:
Provision for
doubtful accounts
and authorized
credits 5,371 6,413 18,237 25,243
Depreciation and
amortization 10,843 26,725 38,050 86,641
Amortization of
unearned stock-based
compensation 357 907 7,141 3,091
Tax benefit on the
exercise of employee
stock options 16,540 27,883 37,483 81,705
Impairment of certain
equity investments -- -- -- 16,245
Minority interests
and other (669) (2,440) (1,475) (10,170)
Changes in assets
and liabilities:
Accounts receivable (23,644) (10,541) (48,862) (50,221)
Other current assets (7,786) 9,718 (20,530) 11,607
Intangible and
other assets (8,942) 427 (11,992) (4,787)
Deferred tax assets (3,005) (13,449) (8,253) (11,408)
Accounts payable 12,929 2,602 (408) (4,087)
Accrued expenses
and other liabilities (352) (220) 31,167 6,790
Deferred revenue
and customer advances 5,832 80 6,659 1,516
Income taxes payable 3,126 9,643 4,637 9,499
------------------- ---------------------
Net cash provided by
operating activities 34,465 83,683 100,148 252,112
------------------- ---------------------
Cash flows from
investing activities:
Purchases of property
and equipment (13,529) (13,743) (49,753) (57,420)
Purchases of
investments (15,918) (252,193) (398,998) (602,485)
Maturities and sales
of investments 63,602 216,558 248,547 738,989
Purchases of other
non-current assets (5,850) 332 (5,850) (1,733)
Proceeds from sale of
property and equipment -- -- -- 4,560
Acquisitions, net
of cash acquired -- -- -- (111,730)
------------------- ---------------------
Net cash provided by
(used in) investing
activities 28,305 (49,046) (206,054) (29,819)
------------------- ---------------------
Cash flows from
financing activities:
Proceeds from issuance of
common stock, net 6,158 66,522 45,373 123,391
Proceeds from issuance of
common stock by
subsidiaries -- -- 37,736 --
Principal payments on
long-term debt 3,375 (47) 2,869 (21,886)
------------------- ---------------------
Net cash provided by
financing activities 9,533 66,475 85,978 101,505
------------------- ---------------------
Effect of exchange rate
changes on cash
and cash equivalents (988) (872) -- (1,702)
------------------- ---------------------
Net increase (decrease)
in cash and
cash equivalents 71,315 100,240 (19,928) 322,096
Cash and cash
equivalents at
beginning of period 130,558 423,729 221,801 201,873
------------------- ---------------------
Cash and cash
equivalents at
end of period $ 201,873 $ 523,969 $ 201,873 $ 523,969
===================== =====================

Ebay News 2002 1 15 Earnings

  • 1.
    eBay Announces FourthQuarter and Year End 2001 Financial Results Record Quarterly Net Revenues of $219.4 Million Record Pro Forma EPS of $0.14 SAN JOSE, Calif. Jan. 15, 2002 - eBay Inc. (Nasdaq:EBAY)(www.ebay.com), the world's online marketplace, reported financial results for its fourth quarter and fiscal year ended December 31, 2001. Consolidated net revenues for the quarter ended December 31, 2001, totaled a record $219.4 million, representing a 64% increase over the $134.0 million generated in the same period last year. Consolidated net income for the quarter was $25.9 million, or $0.09 per diluted share. eBay's pro forma consolidated net income, excluding certain charges, was a record $38.5 million, or $0.14 per diluted share. For the full year, eBay generated consolidated net revenues of $748.8 million, representing 74% annual growth. Consolidated net income for the year was $90.4 million, or $0.32 per diluted share. On a pro forma basis, excluding certain charges, eBay reported consolidated net income of $137.5 million, or $0.49 per diluted share. This represents 135% year-over-year growth in pro forma net income as compared to the $58.6 million reported in 2000, and 133% growth in pro forma earnings per share as compared to $0.21 in 2000. "Our fourth quarter results capped off an outstanding year," said Meg Whitman, President and CEO of eBay. "We have excellent momentum going into 2002 and feel confident with our long-term strategy, ongoing execution and the inherent strength of our business model." Based on the momentum in the business, eBay now believes that revenues for the first half of 2002 could be approximately $490 to $510 million. The company also continues to believe that pro forma earnings per share over the same period could range between $0.32 to $0.33 per diluted share. Key Financial and Operating Metrics Online Net Revenues -- eBay reported record online net revenues of $211.6 million, representing 72% year-over-year growth from the $123.1 million reported in Q4-00. Gross Profit -- eBay reported record gross profit totaling $179.4 million or 82% of net revenues during the quarter, which is consistent with the 82% gross profit reported in Q4-00. Pro Forma Operating Income -- eBay reported record pro forma operating income, which excludes certain charges, totaling $55.4 million, or 25% of net revenues. This represents a 95% increase over Q4-00 pro forma operating income of $28.4 million, or 21% of Q4-00 net revenues. Pro Forma Net Income -- eBay reported record pro forma net income, which excludes certain charges, totaling $38.5 million, or $0.14 per diluted share. This earnings level represents a 54% increase over Q4-00 pro forma net income of $25.0 million. Operating and Free Cash Flows -- For the quarter, eBay reported $83.7 million in operating cash flows, 143% higher than the $34.5 million reported in Q4-00. Free cash flows for Q4-01 were $69.9 million, 234% higher than the $20.9 million reported in Q4-00. For the full year 2001, eBay generated a record $252.1 million in operating cash flows, representing 152% growth versus operating cash flows of $100.1 million in 2000. For the full year 2001, free cash flows grew to $194.7 million, 286% higher than the $50.4 million reported in 2000. Gross Merchandise Sales -- eBay users transacted a record $2.735 billion in gross merchandise sales during the fourth quarter, representing a 69% year-over-year increase from the $1.616 billion reported in Q4-00. Listings -- eBay hosted a record 126.5 million listings during the quarter, representing 59% year-over-year growth. Registered Users -- eBay added a record 4.8 million users, to end Q4-01 with 42.4 million confirmed registered users. This level represents an 88% increase over the 22.5 million users reported at the end of Q4-00. Key Execution Highlights
  • 2.
    Holiday Highlights According toJupiter Media Metrix, eBay was the No. 1 online holiday shopping destination, with nearly 5 million unique daily visitors during the peak December shopping season. Average auction duration on eBay.com decreased almost 10% versus December 2000, as a result of increased adoption of eBay's Buy It Now feature, which was offered as an option on 45% of eBay.com listings during the month of December. Geographic Expansion On a fully allocated basis, eBay's international business achieved operating profitability for the first time in Q4-01, ahead of expectations. Net revenues from international operations contributed 18% of Q4-01 consolidated net revenues, up from 16% in Q3-01, highlighted by 51% sequential net revenue growth in Germany, 26% sequential net revenue growth in Canada, and 25% sequential net revenue growth in the U.K. In the U.S. business, online revenues excluding advertising grew 10% sequentially, representing an acceleration from the quarter-over-quarter growth rate in Q3-01. Including advertising, online revenues in the U.S. were up 11% sequentially, which also represents an acceleration versus the quarter-over-quarter growth rate in Q3-01. The company successfully integrated the former iBazar Spain site into eBay's global technology platform on January 8, 2002, following the integrations of the French, Italian and Dutch sites. With the changeover of the Belgian site, eBay expects to complete the iBazar integration process by the end of Q1-02. Category and Pricing Format Development The company achieved strong quarter-over-quarter growth in gross merchandise sales across virtually all meta-level categories. The largest categories in Q4-01 were eBay Motors, computers, consumer electronics, collectibles, books/movies/music, sports and toys. eBay's fixed price initiatives, Buy It Now, Half.com and eBay Stores, contributed more than 19% of total gross merchandise sales in Q4-01, up sequentially from 16% in Q3-01. Gross merchandise sales processed using eBay Payments by Billpoint increased 14% sequentially and 263% year-over-year. Revenues from third party advertisers represented approximately 13% of net revenues, roughly the same percentage as in Q3- 01. Technology Infrastructure eBay achieved 99.9% site availability for the second consecutive quarter. At the same time, eBay supported 300 million page views per day, 20% more than in Q3, and sent out more than 1.5 giga-bits of data per second, a 25% sequential increase. The company successfully implemented the first components of V3, eBay's next generation technology platform. Community Development eBay's "Auction for America" successfully raised $10 million to help the victims, their families and the communities affected by the terrorist attacks of September 11. The fundraising tool created for "Auction for America" will become a permanent feature for charities using eBay. Financial and Operating Summary For the fourth quarter, the company reported net revenues of $219.4 million, representing a 64% year-over-year increase. The sequential increase was driven largely by better-than-expected holiday sales in the U.S. online business, strong international growth, solid contributions from eBay Motors and eBay Payments by Billpoint, and continued success in the development of third party advertising revenues. Net revenues from eBay's offline segment contributed $7.8 million in Q4-01 net revenues, as compared to the $10.9 million reported in Q4-00. Gross profit as a percentage of net revenues held steady with the prior quarter at 82%. Sales and marketing expenses totaled $71.6 million, or 33% of net revenues, which compares favorably to the 34% of net revenues reported in Q3-01 and the 37% reported in Q4-00. The sequential dollar increase of approximately $5.3 million resulted primarily from increases in online and offline marketing campaigns, iBazar integration and staff additions to our
  • 3.
    category and businessdevelopment teams. Product development costs totaled $21.7 million, or approximately 10% of net revenues in Q4-01, consistent with Q3-01, and down from 11% of net revenues in Q4-00. The sequential dollar increase of approximately $1.5 million resulted primarily from site feature and functionality improvements, iBazar integration and V3 architecture development. General and administrative costs totaled $31.2 million, or about 14% of net revenues, compared with 14% in Q3-01 and 14% in Q4-00. The sequential dollar increase of approximately $3.6 million resulted principally from costs associated with international expansion, legal expenses and general infrastructure growth. Net interest and other income totaled $6.5 million in Q4-01, down from the $11.6 million reported in Q4-00, reflecting the lower interest rate environment. eBay recorded a consolidated tax provision of $24.0 million, representing a 48% effective tax rate on Q4-01 consolidated pre- tax income. The effective rate includes the impact of non-deductible goodwill amortization and losses in certain international jurisdictions. On a pro forma basis, excluding certain charges, the consolidated effective tax rate remained consistent with the prior quarter at 40%. eBay's balance sheet remains very strong as the company ended the quarter with consolidated assets approaching $1.7 billion, including $1.1 billion in aggregate cash and investments. For the quarter, eBay reported $83.7 million in operating cash flows, 143% higher than the $34.5 million reported in Q4-00. $27.9 million of this amount is attributable to tax benefits on certain stock option exercises. Free cash flows for Q4-01 were $69.9 million, 234% higher than the $20.9 million reported in Q4-00. For the full year 2001, eBay generated a record $252.1 million in operating cash flows, representing 152% growth versus operating cash flows of $100.1 million in 2000. Of the $252.1 million in operating cash flows, $81.7 million is attributable to tax benefits on certain stock option exercises. For the full year 2001, free cash flows grew to $194.7 million, 286% higher than the $50.4 million reported in 2000. Business Outlook Based on the momentum in the business, eBay now believes that revenues for the first half of 2002 could be approximately $490 to $510 million. Further, eBay expects that Q1-02 net revenue growth will be driven primarily by transactions, both in the U.S. and in international markets. Given the difficult environment for online advertising, the company believes that advertising revenues as a percentage of net revenues will be down in Q1-02. eBay continues to execute on a strategy that balances increasing bottom-line returns with investments in future growth. Near- term investments include international development and selective expansion, broadening and deepening category offerings, development of fixed price formats and other merchandising options, improving the user experience, ongoing development of eBay's next generation architecture, and attracting new buyers and sellers to the eBay platform while building loyalty with eBay's existing community of users. As a result of its higher net revenue outlook, eBay believes that these incremental investments can be made while delivering improved sequential bottom line profitability. Accordingly, eBay continues to believe pro forma earnings per share for the first half of 2002 could range between $0.32 and $0.33 per diluted share. About eBay eBay is The World's Online Marketplace(TM). Founded in 1995, eBay created a powerful platform for the sale of goods and services by a passionate community of individuals and businesses. On any given day, there are millions of items across thousands of categories for sale on eBay, as well as on Half.com, eBay's site dedicated to fixed price trading. eBay enables trade on a local, national and international basis with customized sites in markets around the world. Forward Looking Statements This announcement contains forward-looking statements that involve risks and uncertainties, including those relating to the company's ability to grow its business and user base. Actual results could differ materially from those discussed. Factors that could cause or contribute to such differences include, but are not limited to, the company's need to manage both an increasingly broad range of businesses and significant growth, to deal with the increasingly competitive environment for online trading, to manage regulatory and litigation risks, to maintain site stability and continue to expand its model to new types of merchandise and sellers and to continue to expand outside of the U.S., as well as the timing and commercial success of new features and functions added to the company's sites, the price and demand for advertising offered by the company, the success of the company's commercial partners, and the costs of announced and prospective joint ventures, acquisitions and other commercial transactions. More information about potential factors which could affect the company's business and financial results is included in the company's Annual Report on Form 10-K for the year ended December 31, 2000, and the company's Quarterly Reports on Form 10-Q for the periods ended March 31, 2001, June 30, 2001 and September 30, 2001. All forward-looking statements are based on information available to the company on the date hereof, and the company
  • 4.
    assumes no obligationto update such statements. eBAY INC. CONDENSED CONSOLIDATED BALANCE SHEET (in thousands; unaudited) December 31, December 31, 2000 2001 ------------ ------------ ASSETS Current assets: Cash and cash equivalents $ 201,873 $ 523,969 Short-term investments 354,166 199,450 Accounts receivable, net 67,163 101,703 Other current assets 52,262 58,683 ------------ ------------ Total current assets 675,464 883,805 Long-term investments 218,197 286,998 Restricted cash and investments 126,390 129,614 Property and equipment, net 125,161 142,349 Intangible assets, net 13,063 198,639 Deferred tax asset 13,892 21,540 Other assets 10,236 15,584 ------------ ------------ $ 1,182,403 $ 1,678,529 ============ ============ LIABILITIES AND STOCKHOLDERS' EQUITY Current liabilities: Accounts payable $ 31,725 $ 33,235 Accrued expenses and other current liabilities 66,697 94,593 Deferred revenue and customer advances 12,656 15,583 Short-term debt 15,272 16,111 Income taxes payable 11,092 20,617 ----------- ------------ Total current liabilities 137,442 180,139 Long term debt 11,404 12,008 Other liabilities 6,549 19,493 Minority interests 13,248 37,751 ----------- ------------ Total liabilities 168,643 249,391 ----------- ------------ Total stockholders' equity 1,013,760 1,429,138 ----------- ------------ $ 1,182,403 $ 1,678,529
  • 5.
    =========== =========== eBAY INC. CONDENSEDCONSOLIDATED STATEMENT OF INCOME (in thousands, except per share amounts; unaudited) Three Months Ended Twelve Months Ended December 31, December 31, ----------------------- --------------------- 2000 2001 2000 2001 ----------------------- --------------------- Net revenues $ 134,008 $ 219,401 $ 431,424 $ 748,821 Cost of net revenues 23,954 39,989 95,453 134,816 ----------------------- --------------------- Gross profit 110,054 179,412 335,971 614,005 ----------------------- --------------------- Operating expenses: Sales and marketing 49,039 71,554 166,767 253,474 Product development 14,142 21,723 55,863 75,288 General and administrative 19,003 31,246 74,577 105,784 Payroll expense on employee stock options 585 881 2,337 2,442 Amortization of acquired intangible assets 554 12,390 1,433 36,591 ----------------------- --------------------- Total operating expenses 83,323 137,794 300,977 473,579 ----------------------- --------------------- Income from operations 26,731 41,618 34,994 140,426 Interest and other income (expense), net 12,114 7,186 46,337 41,613 Interest expense (538) (722) (3,374) (2,851) Impairment of certain equity investments -- -- -- (16,245) ----------------------- --------------------- Income before income taxes and minority interests 38,307 48,082 77,957 162,943 Provision for income taxes (15,910) (24,038) (32,725) (80,009) Minority interests in consolidated companies 1,468 1,891 3,062 7,514 ----------------------- --------------------- Net income $ 23,865 $ 25,935 $ 48,294 $ 90,448 ======================= ==================== Net income per share: Basic $ 0.09 $ 0.09 $ 0.19 $ 0.34 ======================= =================== Diluted $ 0.09 $ 0.09 $ 0.17 $ 0.32 ======================= ==================== Weighted average shares: Basic 259,789 274,599 251,776 268,971 ======================= ====================
  • 6.
    Diluted 279,822 283,564280,346 280,595 ======================= ==================== eBAY INC. SUPPLEMENTAL PRO FORMA FINANCIAL INFORMATION CONDENSED CONSOLIDATED STATEMENT OF INCOME (in thousands, except per share amounts; unaudited) The accompanying supplemental pro forma financial information is presented for informational purposes only and should not be considered as a substitute for the historical financial information presented in accordance with generally accepted accounting principles. Three Months Ended December 31, 2001 ------------------ Pro Forma Reported Entries Pro Forma ----------------------------------- Net Revenues $ 134,008 $ -- $ 134,008 Cost of net revenues 23,954 (10)(a) 23,944 ---------------------- --------- Gross profit 110,054 10 110,064 ---------------------- --------- Operating expenses: Sales and marketing 49,039 (63)(a) 48,976 Product development 14,142 (170)(a) 13,972 General and administrative 19,003 (297)(a,d) 18,706 Payroll expense on employee stock options 585 (585)(b) -- Amortization of acquired intangible assets 554 (554)(c) -- ---------------------- --------- Total operating expenses 83,323 (1,669) 81,654 ---------------------- --------- Income from operations 26,731 1,679 28,410 Interest and other income (expense), net 12,114 -- 12,114 Interest expense (538) -- (538) Impairment of certain equity investments -- -- -- ---------------------- --------- Income before income taxes and minority
  • 7.
    interests 38,307 1,67939,986 Provision for income taxes (15,910) (503)(e) (16,413) Minority interests in consolidated companies 1,468 -- 1,468 ---------------------- --------- Net income $ 23,865 $ 1,176 $ 25,041 ====================== ========= Net income per share: Basic $ 0.09 $ 0.10 ========= ========= Diluted $ 0.09 $ 0.09 ========= ========= Weighted average shares: Basic 259,789 259,789 ========= ========= Diluted 279,822 279,822 ========= ========= Three Months Ended December 31, 2001 ------------------ Pro Forma Reported Entries Pro Forma ----------------------------------- Net Revenues $ 219,401 $ 219,401 Cost of net revenues 39,989 (19)(a) 39,970 ---------------------- --------- Gross profit 179,412 19 179,431 ---------------------- --------- Operating expenses: Sales and marketing 71,554 (47)(a) 71,507 Product development 21,723 (96)(a) 21,627 General and administrative 31,246 (364)(a) 30,882 Payroll expense on employee stock options 881 (881)(b) -- Amortization of acquired intangible assets 12,390 (12,390)(c) -- ---------------------- --------- Total operating expenses 137,794 (13,778) 124,016 ---------------------- --------- Income from operations 41,618 13,797 55,415 Interest and other income (expense), net 7,186 -- 7,186 Interest expense (722) -- (722) Impairment of
  • 8.
    certain equity investments ---- -- ---------------------- --------- Income before income taxes and minority interests 48,082 13,797 61,879 Provision for income taxes (24,038) (1,259)(e) (25,297) Minority interests in consolidated companies 1,891 -- 1,891 ---------------------- --------- Net income $ 25,935 $ 12,538 $ 38,473 ====================== ========= Net income per share: Basic $ 0.09 $ 0.14 ========= ========= Diluted $ 0.09 $ 0.14 ========= ========= Weighted average shares: Basic 274,599 274,599 ========= ========= Diluted 283,564 283,564 ========= ========= Notes: (a) Non-cash stock based compensation expense. (b) Employer payroll taxes on employee exercises of non-qualified stock options. (c) Amortization of acquired intangible assets. (d) Merger related costs. (e) Incremental income taxes associated with certain pro forma entries. eBAY INC. SUPPLEMENTAL PRO FORMA FINANCIAL INFORMATION CONDENSED CONSOLIDATED STATEMENT OF INCOME (in thousands, except per share amounts; unaudited) The accompanying supplemental pro forma financial information is presented for informational purposes only and should not be considered as a substitute for the historical financial information presented in accordance with generally accepted accounting principles. Twelve Months Ended December 31, 2000 ----------------------------------- Pro Forma Reported Entries Pro Forma ----------------------------------- Net revenues $ 431,424 $ -- $ 431,424
  • 9.
    Cost of netrevenues 95,453 (82)(a) 95,371 ---------------------- --------- Gross profit 335,971 82 336,053 ---------------------- --------- Operating expenses: Sales and marketing 166,767 (762)(a) 166,005 Product development 55,863 (4,160)(a) 51,703 General and administrative 74,577 (3,687)(a,d) 70,890 Payroll expense on employee stock options 2,337 (2,337)(b) -- Amortization of acquired intangible assets 1,433 (1,433)(c) -- ---------------------- --------- Total operating expenses 300,977 (12,379) 288,598 ---------------------- --------- Income from operations 34,994 12,461 47,455 Interest and other income (expense), net 46,337 -- 46,337 Interest expense (3,374) -- (3,374) Impairment of certain equity investments -- -- -- ---------------------- --------- Income before income taxes and minority interests 77,957 12,461 90,418 Provision for income taxes (32,725) (2,191)(e) (34,916) Minority interests in consolidated companies 3,062 -- 3,062 ---------------------- --------- Net income $ 48,294 $10,270 $ 58,564 ====================== ========= Net income per share: Basic $ 0.19 $ 0.23 ========= ========= Diluted $ 0.17 $ 0.21 ========= ========= Weighted average shares: Basic 251,776 251,776 ========= ========= Diluted 280,346 280,346 ========= ========= Notes: (a) Non-cash stock based compensation expense. (b) Employer payroll taxes on employee exercises of non-qualified stock options. (c) Amortization of acquired intangible assets. (d) Merger related costs. (e) Incremental income taxes associated with certain pro forma entries. (f) Impairment of certain equity investments. Twelve Months Ended December 31, 2001 ----------------------------------- Pro Forma
  • 10.
    Reported Entries ProForma ----------------------------------- Net revenues $ 748,821 $ -- $ 748,821 Cost of net revenues 134,816 (53)(a) 134,763 ---------------------- --------- Gross profit 614,005 53 614,058 ---------------------- --------- Operating expenses: Sales and marketing 253,474 (208)(a) 253,266 Product development 75,288 (452)(a) 74,836 General and administrative 105,784 (1,292)(a) 104,492 Payroll expense on employee stock options 2,442 (2,442)(b) -- Amortization of acquired intangible assets 36,591 (36,591)(c) -- ---------------------- --------- Total operating expenses 473,579 (40,985) 432,594 ---------------------- --------- Income from operations 140,426 41,038 181,464 Interest and other income (expense), net 41,613 -- 41,613 Interest expense (2,851) -- (2,851) Impairment of certain equity investments (16,245) 16,245(f) -- ---------------------- --------- Income before income taxes and minority interests 162,943 57,283 220,226 Provision for income taxes (80,009) (10,278)(e) (90,287) Minority interests in consolidated companies 7,514 -- 7,514 ---------------------- --------- Net income $ 90,448 $47,005 $ 137,453 ====================== ========= Net income per share: Basic $ 0.34 $ 0.51 ========= ========= Diluted $ 0.32 $ 0.49 ========= ========= Weighted average shares: Basic 268,971 268,971 ========= ========= Diluted 280,595 280,595 ========= ========= Notes: (a) Non-cash stock based compensation expense. (b) Employer payroll taxes on employee exercises of non-qualified stock options. (c) Amortization of acquired intangible assets. (d) Merger related costs. (e) Incremental income taxes associated with certain pro forma entries. (f) Impairment of certain equity investments.
  • 11.
    eBAY INC. SUPPLEMENTAL PROFORMA FINANCIAL INFORMATION CONDENSED CONSOLIDATED STATEMENT OF INCOME (in thousands, except per share amounts; unaudited) Three Months Ended Twelve Months Ended December 31, December 31, ------------------- ------------------- 2000 2001 2000 2001 ------------------- ------------------- Cash flows from operating activities: Net income $ 23,865 $ 25,935 $ 48,294 $ 90,448 Adjustments: Provision for doubtful accounts and authorized credits 5,371 6,413 18,237 25,243 Depreciation and amortization 10,843 26,725 38,050 86,641 Amortization of unearned stock-based compensation 357 907 7,141 3,091 Tax benefit on the exercise of employee stock options 16,540 27,883 37,483 81,705 Impairment of certain equity investments -- -- -- 16,245 Minority interests and other (669) (2,440) (1,475) (10,170) Changes in assets and liabilities: Accounts receivable (23,644) (10,541) (48,862) (50,221) Other current assets (7,786) 9,718 (20,530) 11,607 Intangible and other assets (8,942) 427 (11,992) (4,787) Deferred tax assets (3,005) (13,449) (8,253) (11,408) Accounts payable 12,929 2,602 (408) (4,087) Accrued expenses and other liabilities (352) (220) 31,167 6,790 Deferred revenue and customer advances 5,832 80 6,659 1,516 Income taxes payable 3,126 9,643 4,637 9,499 ------------------- --------------------- Net cash provided by operating activities 34,465 83,683 100,148 252,112 ------------------- --------------------- Cash flows from investing activities: Purchases of property and equipment (13,529) (13,743) (49,753) (57,420) Purchases of investments (15,918) (252,193) (398,998) (602,485) Maturities and sales of investments 63,602 216,558 248,547 738,989 Purchases of other non-current assets (5,850) 332 (5,850) (1,733)
  • 12.
    Proceeds from saleof property and equipment -- -- -- 4,560 Acquisitions, net of cash acquired -- -- -- (111,730) ------------------- --------------------- Net cash provided by (used in) investing activities 28,305 (49,046) (206,054) (29,819) ------------------- --------------------- Cash flows from financing activities: Proceeds from issuance of common stock, net 6,158 66,522 45,373 123,391 Proceeds from issuance of common stock by subsidiaries -- -- 37,736 -- Principal payments on long-term debt 3,375 (47) 2,869 (21,886) ------------------- --------------------- Net cash provided by financing activities 9,533 66,475 85,978 101,505 ------------------- --------------------- Effect of exchange rate changes on cash and cash equivalents (988) (872) -- (1,702) ------------------- --------------------- Net increase (decrease) in cash and cash equivalents 71,315 100,240 (19,928) 322,096 Cash and cash equivalents at beginning of period 130,558 423,729 221,801 201,873 ------------------- --------------------- Cash and cash equivalents at end of period $ 201,873 $ 523,969 $ 201,873 $ 523,969 ===================== =====================