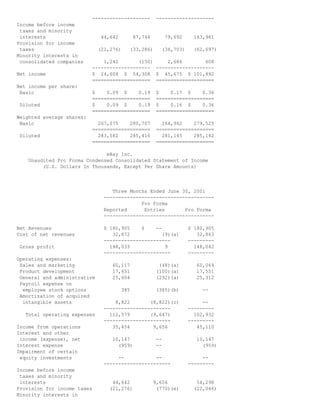
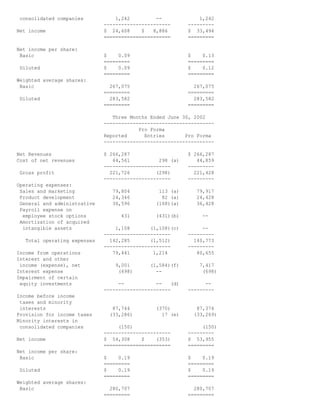
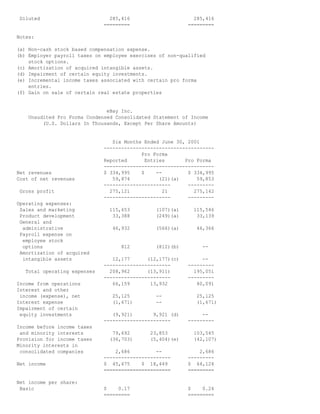
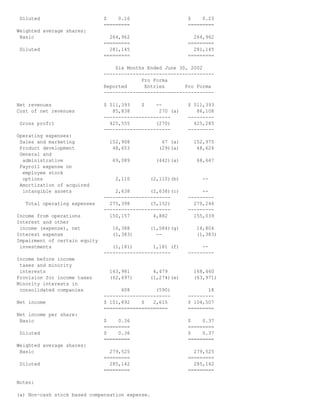
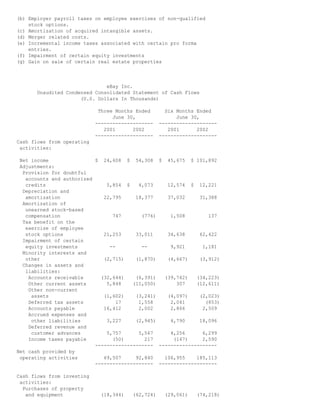
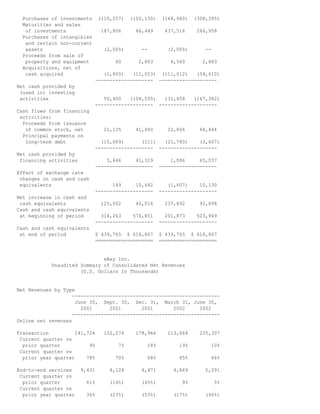
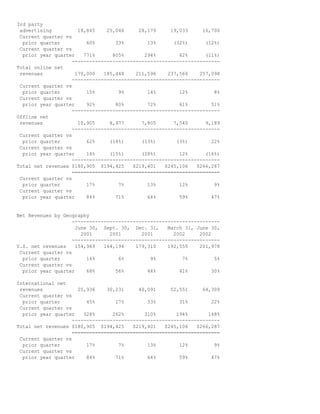
citigroup January 17, 2002 - Fourth Quarter Financial Supplement
Ebay News 2002 7 18 Earnings
1. eBay Inc. Announces Second Quarter 2002 Financial Results
Company Reports Accelerating Year-over-Year Transaction Revenue Growth of 66%
Achieves Record EPS of $0.19 and Pro Forma Operating Margin of 30%
SAN JOSE, Calif. July 18, 2002 - eBay Inc. (Nasdaq: EBAY; www.ebay.com), the world's online marketplace, reported financial
results for its second quarter ended June 30, 2002.
As announced on July 8, eBay reported consolidated net revenues totaling a record $266.3 million. Consolidated net income
for the quarter was a record $54.3 million, or $0.19 per diluted share. eBay's pro forma consolidated net income, excluding
certain items, was a record $54.0 million, or $0.19 per diluted share.
Online net transaction revenues in Q2-02 increased 66% year-over-year to a record $235.3 million, driven by 48% year-over-
year transaction revenue growth in the U.S. and 152% year-over-year growth internationally. This transaction revenue growth
was partially offset by an 11% year-over-year decrease in third party advertising revenues. As a result, consolidated Q2-02 net
revenues increased 47% over the $180.9 million generated in Q2-01.
"The strength of our transaction business allowed us once again to deliver record revenues and record profitability," said Meg
Whitman, President and CEO of eBay. "These results demonstrate that our continued focus on expanding the eBay
marketplace is accelerating the company's growth around the world."
Key Financial and Operating Metrics
Online Transaction Revenues -- eBay reported record net online transaction revenues of $235.3 million, representing 66%
year-over-year growth from the $141.7 million reported in Q2-01 versus the 65% year-over-year growth rate achieved in Q1-
02.
Gross Profit -- eBay reported record gross profit totaling $221.7 million or 83% of net revenues during the quarter, up from the
82% gross profit reported in Q2-01.
Pro Forma Operating Income -- eBay reported record pro forma operating income totaling $80.7 million, or 30% of net
revenues. This represents a 79% increase over Q2-01 pro forma operating income of $45.1 million, or 25% of Q2-01 net
revenues.
Net Income -- eBay reported record net income totaling $54.3 million, or $0.19 per diluted share. This represents a 121%
increase over the net income level of $24.6 million reported in Q2-01.
Pro Forma Net Income -- eBay reported record pro forma net income totaling $54.0 million, or $0.19 per diluted share. This
earnings level represents a 61% increase over Q2-01 pro forma net income of $33.5 million.
Operating and Free Cash Flows -- eBay reported a record $92.8 million in operating cash flows, 34% higher than the $69.5
million reported in Q2-01. Free cash flows for Q2-02 were $30.1 million, a 41% decrease from the $51.2 million reported in Q2-
01.
Gross Merchandise Sales -- eBay users transacted a record $3.40 billion in gross merchandise sales, or GMS, during the
second quarter, representing a 51% year-over-year increase from the $2.25 billion reported in Q2-01.
Listings -- eBay hosted a record 145.2 million listings during the quarter, representing a 47% year-over-year increase from the
98.7 million reported in Q2-01.
Registered Users -- eBay added 4.4 million new confirmed registered users, offset by approximately 700 thousand user IDs
eliminated as part of the company's enhanced trust and safety policies at Internet Auction Company, its South Korean
subsidiary. Cumulative confirmed registered users at the end of Q2-02 totaled a record 49.7 million, representing a 46%
increase over the 34.1 million users reported at the end of Q2-01.
Key Execution Highlights
2. U.S. Online Net Revenues -- U.S. online net transaction revenues totaled $172.2 million in Q2-02, representing 48% year-over-
year growth. Including net revenues from third party advertising and end-to-end services, total U.S. online net revenues were
$192.8 million, representing 34% year-over-year growth.
International Net Revenues -- Net revenues from international operations totaled $64.3 million in Q2-02, or 24% of consolidated
net revenues. This net revenue level represents a 148% year-over-year growth rate. Highlighting the quarter was continuing
strong growth in Germany and the U.K., which reported 25% and 26% sequential quarterly net revenue growth, respectively.
Key Category Performance -- The company achieved double-digit year-over-year growth rates in gross merchandise sales
across virtually all top-level categories. Globally, eBay's ten largest categories in Q2-02 were: eBay Motors, Computers,
Consumer Electronics, Book/Movies/Music, Sports, Collectibles, Toys, Clothing & Accessories, Jewelry & Gemstones and
Photo.
Fixed-Price Trading -- eBay's fixed price offerings continue to drive seller success and contributed more than 19% of total
gross merchandise sales during Q2-02. In addition, more than 29,000 sellers are currently taking advantage of the enhanced
merchandising capabilities of eBay Stores.
Financial and Operating Summary
During Q2-02, the company reported record net revenues of $266.3 million, representing a 47% year-over-year increase. The
strong Q2-02 performance was due largely to better-than-expected transaction revenues, driven by a 48% year-over-year
increase in U.S. online net transaction revenues and a 152% increase in international online transaction revenues. Revenues
from third party advertisers were down 11% year-over-year to $16.7 million, which represented approximately 6% of net
revenues, down from the 10% of net revenues reported in Q2-01. The decrease in advertising revenues was consistent with
the company's expectations.
Gross profit as a percentage of net revenues was 83% as compared with 83% in Q1-02 and 82% in Q2-01. Gross margins on a
sequential basis benefited from a combination of strong revenue growth and relatively fixed costs in site operations, largely
offset by investments in our international customer support infrastructure and disaster recovery site.
Sales and marketing expenses totaled $79.8 million, or 30% of net revenues, consistent with the 30% of net revenues reported
in Q1-02, and comparing favorably to the 33% reported in Q2-01. The sequential increase in sales and marketing expenses
was attributed to higher sales and marketing expenditures in our international businesses, as well as in certain vertical
categories, in particular eBay Motors, and costs associated with eBay Live, the company's first ever community celebration.
Product development costs totaled $24.3 million, or approximately 9% of net revenues, compared to 10% of net revenues in
Q1-02. While these expenses were roughly the same dollar level as in Q1-02, product development expenses in Q2-02 reflect
an actual increase in spending, offset by $1.6 million in capitalized internal software development related to eBay's next
generation technology infrastructure.
General and administrative costs totaled $36.6 million, or about 14% of net revenues, up from 13% of net revenues in Q1-02
and consistent with 14% of net revenues in Q2-01. The sequential dollar increase of approximately $4.1 million resulted
principally from costs associated with the company's international expansion efforts, various legal matters and employee-
related costs.
Net interest and other income totaled $8.3 million in Q2-02, up from the $5.5 million reported in Q1-02, primarily reflecting a
$1.6 million gain on the sales of certain real estate properties.
eBay reported a consolidated pro forma tax provision of $33.3 million, reflecting a 38% effective tax rate.
eBay's balance sheet remains strong. At the end of Q2-02, the company had consolidated assets totaling nearly $2.0 billion,
including nearly $1.3 billion in aggregate cash and investments.
The company reported $92.8 million in operating cash flows, 34% higher than the $69.5 million reported in Q2-01. Of this
amount, $33 million is attributable to tax benefits on stock option exercises. In addition, Q2-02 operating cash flows were
impacted by the timing of the company's $18.8 million payment to its largest advertising partner, America Online, for services to
be rendered over the course of 2002.
Free cash flows during Q2-02 totaled $30.1 million, 41% lower than the $51.2 million reported in Q2-01. Of the $62.7 million in
capital expenditures in Q2-02, approximately $5 million resulted from investments in software development, $11 million from the
purchase of the company's customer support facility in Salt Lake City, and $30 million related to the purchase of a corporate
aircraft. The company now expects that capital expenditures for 2002 will approximate $130 million, compared to previous
guidance of $95 million.
Business Outlook
3. Based on the company's most recent performance, eBay now expects that net revenues for Q3-02 could range between $278
and $281 million, Q3-02 pro forma earnings per diluted share will approximate $0.19, and GAAP earnings per diluted share will
also approximate $0.19.
For the full year 2002, eBay continues to expect that net revenues will approximate $1.1 billion. For Q3-02 and Q4-02, eBay
also believes that the pro forma effective tax rate will be 36 percent. On the bottom line, eBay now believes that pro forma
earnings per diluted share could range between $0.76 and $0.78 for the full year, reflecting a $0.03 increase from previous
guidance. On a GAAP basis, earnings per diluted share could range between $0.74 and $0.76 for the full year. The company
also expects its pro forma operating margin will approximate 30% for 2002, compared to previous guidance of 29 to 30 percent.
GAAP operating margin for the full year is expected to approximate 29 percent.
In addition, eBay currently believes that 2003 net revenues could range between $1.50 billion and $1.55 billion, including an
expected 45% year-over-year growth rate in online transaction revenues from anticipated 2002 levels, as well as the
company's current expectations for third party advertising, end-to-end service and offline revenues. The company expects that
both pro forma and GAAP operating margins in 2003 could range from 31 to 32 percent. The company anticipates that the pro
forma effective tax rate for 2003 will approximate 36 percent. This 2003 guidance excludes the expected impact of the recently
announced agreement to acquire PayPal, Inc. About eBay
eBay is the world's online marketplace(TM). Founded in 1995, eBay created a powerful platform for the sale of goods and
services by a passionate community of individuals and businesses. On any given day, there are millions of items across
thousands of categories for sale on eBay. eBay enables trade on a local, national and international basis with customized sites
in markets around the world.
Forward-Looking Statements
This announcement contains forward-looking statements that involve risks and uncertainties, including those relating to the
company's ability to grow its business and user base. Actual results could differ materially from those discussed. Factors that
could cause or contribute to such differences include, but are not limited to: the company's need to manage an increasingly
broad range of businesses, to deal with the increasingly competitive environment for online trading, to manage regulatory and
litigation risks even as its product offerings and geographies expand, to maintain site stability and continue to expand its model
to new types of merchandise and sellers, to continue to expand outside of the U.S., as well as the timing and commercial
success of new features and functions added to the company's sites, the price and demand for advertising offered by the
company, the success of the company's commercial partners, and the costs of announced and prospective joint ventures,
acquisitions and other commercial transactions. Additional factors that could cause or contribute to such differences and that
relate to the announced acquisition of PayPal, Inc. include the possibility of delay or non-closure, the reaction of each
company's user base to the acquisition, the future growth and identified risks relating to PayPal, and the possibility that the
future integration of the two companies will be more difficult or costly than expected. More information about potential factors
which could affect the company's business and financial results is included in the company's Annual Report on Form 10-K for
the year ended December 31, 2001, its quarterly report on Form 10-Q for the first quarter of 2002, and its other S.E.C. filings
and prospectuses. All forward-looking statements are based on information available to the company on the date hereof, and
the company assumes no obligation to update such statements.
eBay Inc.
Unaudited Condensed Consolidated Balance Sheet
(U.S. Dollars In Thousands)
December 31, June 30,
2001 2002
---------- ----------
ASSETS
Current assets:
Cash and cash equivalents $ 523,969 $ 616,867
Short-term investments 199,450 121,651
Accounts receivable, net 101,703 128,769
Other current assets 58,683 70,299
---------- ----------
Total current assets 883,805 937,586
Long-term investments 286,998 412,969
Restricted cash and investments 129,614 129,963
Property and equipment, net 142,349 187,055
Intangible assets, net 198,639 263,980
Deferred tax assets 21,540 23,520
4. Other assets 15,584 14,950
---------- ----------
$1,678,529 $1,970,023
========== ==========
LIABILITIES AND STOCKHOLDERS' EQUITY
Current liabilities:
Accounts payable $ 33,235 $ 36,531
Accrued expenses and other current
liabilities 94,593 116,025
Deferred revenue and customer advances 15,583 22,373
Short-term debt 16,111 14,974
Income taxes payable 20,617 23,318
---------- ----------
Total current liabilities 180,139 213,221
Long-term debt 12,008 9,808
Other liabilities 19,493 20,421
Minority interests 37,751 30,470
---------- ----------
Total liabilities 249,391 273,920
---------- ----------
Total stockholders' equity 1,429,138 1,696,103
---------- ----------
$1,678,529 $1,970,023
========== ==========
eBay Inc.
Unaudited Condensed Consolidated Statement of Income
(U.S. Dollars In Thousands, Except Per Share Amounts)
Three Months Ended Six Months Ended
June 30, June 30,
-------------------- --------------------
2001 2002 2001 2002
-------------------- --------------------
Net revenues $ 180,905 $ 266,287 $ 334,995 $ 511,393
Cost of net revenues 32,872 44,561 59,874 85,838
-------------------- --------------------
Gross profit 148,033 221,726 275,121 425,555
-------------------- --------------------
Operating expenses:
Sales and marketing 60,117 79,804 115,653 152,908
Product development 17,651 24,346 33,388 48,653
General and
administrative 25,604 36,596 46,932 69,089
Payroll expense on
employee stock options 385 431 812 2,110
Amortization of acquired
intangible assets 8,822 1,108 12,177 2,638
-------------------- --------------------
Total operating
expenses 112,579 142,285 208,962 275,398
-------------------- --------------------
Income from operations 35,454 79,441 66,159 150,157
Interest and other
income (expense), net 10,147 9,001 25,125 16,388
Interest expense (959) (698) (1,671) (1,383)
Impairment of certain
equity investments -- (9,921) (1,181)
5. -------------------- --------------------
Income before income
taxes and minority
interests 44,642 87,744 79,692 163,981
Provision for income
taxes (21,276) (33,286) (36,703) (62,697)
Minority interests in
consolidated companies 1,242 (150) 2,686 608
-------------------- --------------------
Net income $ 24,608 $ 54,308 $ 45,675 $ 101,892
==================== ====================
Net income per share:
Basic $ 0.09 $ 0.19 $ 0.17 $ 0.36
==================== ====================
Diluted $ 0.09 $ 0.19 $ 0.16 $ 0.36
==================== ====================
Weighted average shares:
Basic 267,075 280,707 264,962 279,525
==================== ====================
Diluted 283,582 285,416 281,145 285,142
==================== ====================
eBay Inc.
Unaudited Pro Forma Condensed Consolidated Statement of Income
(U.S. Dollars In Thousands, Except Per Share Amounts)
Three Months Ended June 30, 2001
--------------------------------------
Pro Forma
Reported Entries Pro Forma
--------------------------------------
Net Revenues $ 180,905 $ -- $ 180,905
Cost of net revenues 32,872 (9)(a) 32,863
----------------------- ---------
Gross profit 148,033 9 148,042
----------------------- ---------
Operating expenses:
Sales and marketing 60,117 (48)(a) 60,069
Product development 17,651 (100)(a) 17,551
General and administrative 25,604 (292)(a) 25,312
Payroll expense on
employee stock options 385 (385)(b) --
Amortization of acquired
intangible assets 8,822 (8,822)(c) --
----------------------- ---------
Total operating expenses 112,579 (9,647) 102,932
----------------------- ---------
Income from operations 35,454 9,656 45,110
Interest and other
income (expense), net 10,147 -- 10,147
Interest expense (959) -- (959)
Impairment of certain
equity investments -- -- --
----------------------- ---------
Income before income
taxes and minority
interests 44,642 9,656 54,298
Provision for income taxes (21,276) (770)(e) (22,046)
Minority interests in
6. consolidated companies 1,242 -- 1,242
----------------------- ---------
Net income $ 24,608 $ 8,886 $ 33,494
======================= =========
Net income per share:
Basic $ 0.09 $ 0.13
========= =========
Diluted $ 0.09 $ 0.12
========= =========
Weighted average shares:
Basic 267,075 267,075
========= =========
Diluted 283,582 283,582
========= =========
Three Months Ended June 30, 2002
--------------------------------------
Pro Forma
Reported Entries Pro Forma
--------------------------------------
Net Revenues $ 266,287 $ 266,287
Cost of net revenues 44,561 298 (a) 44,859
----------------------- ---------
Gross profit 221,726 (298) 221,428
----------------------- ---------
Operating expenses:
Sales and marketing 79,804 113 (a) 79,917
Product development 24,346 82 (a) 24,428
General and administrative 36,596 (168)(a) 36,428
Payroll expense on
employee stock options 431 (431)(b) --
Amortization of acquired
intangible assets 1,108 (1,108)(c) --
----------------------- ---------
Total operating expenses 142,285 (1,512) 140,773
----------------------- ---------
Income from operations 79,441 1,214 80,655
Interest and other
income (expense), net 9,001 (1,584)(f) 7,417
Interest expense (698) -- (698)
Impairment of certain
equity investments -- -- (d) --
----------------------- ---------
Income before income
taxes and minority
interests 87,744 (370) 87,374
Provision for income taxes (33,286) 17 (e) (33,269)
Minority interests in
consolidated companies (150) (150)
----------------------- ---------
Net income $ 54,308 $ (353) $ 53,955
======================= =========
Net income per share:
Basic $ 0.19 $ 0.19
========= =========
Diluted $ 0.19 $ 0.19
========= =========
Weighted average shares:
Basic 280,707 280,707
========= =========
7. Diluted 285,416 285,416
========= =========
Notes:
(a) Non-cash stock based compensation expense.
(b) Employer payroll taxes on employee exercises of non-qualified
stock options.
(c) Amortization of acquired intangible assets.
(d) Impairment of certain equity investments.
(e) Incremental income taxes associated with certain pro forma
entries.
(f) Gain on sale of certain real estate properties
eBay Inc.
Unaudited Pro Forma Condensed Consolidated Statement of Income
(U.S. Dollars In Thousands, Except Per Share Amounts)
Six Months Ended June 30, 2001
--------------------------------------
Pro Forma
Reported Entries Pro Forma
--------------------------------------
Net revenues $ 334,995 $ -- $ 334,995
Cost of net revenues 59,874 (21)(a) 59,853
----------------------- ---------
Gross profit 275,121 21 275,142
----------------------- ---------
Operating expenses:
Sales and marketing 115,653 (107)(a) 115,546
Product development 33,388 (249)(a) 33,139
General and
administrative 46,932 (566)(a) 46,366
Payroll expense on
employee stock
options 812 (812)(b) --
Amortization of acquired
intangible assets 12,177 (12,177)(c) --
----------------------- ---------
Total operating expenses 208,962 (13,911) 195,051
----------------------- ---------
Income from operations 66,159 13,932 80,091
Interest and other
income (expense), net 25,125 -- 25,125
Interest expense (1,671) -- (1,671)
Impairment of certain
equity investments (9,921) 9,921 (d) --
----------------------- ---------
Income before income taxes
and minority interests 79,692 23,853 103,545
Provision for income taxes (36,703) (5,404)(e) (42,107)
Minority interests in
consolidated companies 2,686 -- 2,686
----------------------- ---------
Net income $ 45,675 $ 18,449 $ 64,124
======================= =========
Net income per share:
Basic $ 0.17 $ 0.24
========= =========
8. Diluted $ 0.16 $ 0.23
========= =========
Weighted average shares:
Basic 264,962 264,962
========= =========
Diluted 281,145 281,145
========= =========
Six Months Ended June 30, 2002
--------------------------------------
Pro Forma
Reported Entries Pro Forma
--------------------------------------
Net revenues $ 511,393 $ -- $ 511,393
Cost of net revenues 85,838 270 (a) 86,108
----------------------- ---------
Gross profit 425,555 (270) 425,285
----------------------- ---------
Operating expenses:
Sales and marketing 152,908 67 (a) 152,975
Product development 48,653 (29)(a) 48,624
General and
administrative 69,089 (442)(a) 68,647
Payroll expense on
employee stock
options 2,110 (2,110)(b) --
Amortization of acquired
intangible assets 2,638 (2,638)(c) --
----------------------- ---------
Total operating expenses 275,398 (5,152) 270,246
----------------------- ---------
Income from operations 150,157 4,882 155,039
Interest and other
income (expense), net 16,388 (1,584)(g) 14,804
Interest expense (1,383) -- (1,383)
Impairment of certain equity
investments (1,181) 1,181 (f) --
----------------------- ---------
Income before income
taxes and minority
interests 163,981 4,479 168,460
Provision for income taxes (62,697) (1,274)(e) (63,971)
Minority interests in
consolidated companies 608 (590) 18
----------------------- ---------
Net income $ 101,892 $ 2,615 $ 104,507
====================== =========
Net income per share:
Basic $ 0.36 $ 0.37
========= =========
Diluted $ 0.36 $ 0.37
========= =========
Weighted average shares:
Basic 279,525 279,525
========= =========
Diluted 285,142 285,142
========= =========
Notes:
(a) Non-cash stock based compensation expense.
9. (b) Employer payroll taxes on employee exercises of non-qualified
stock options.
(c) Amortization of acquired intangible assets.
(d) Merger related costs.
(e) Incremental income taxes associated with certain pro forma
entries.
(f) Impairment of certain equity investments
(g) Gain on sale of certain real estate properties
eBay Inc.
Unaudited Condensed Consolidated Statement of Cash Flows
(U.S. Dollars In Thousands)
Three Months Ended Six Months Ended
June 30, June 30,
-------------------- --------------------
2001 2002 2001 2002
-------------------- --------------------
Cash flows from operating
activities:
Net income $ 24,608 $ 54,308 $ 45,675 $ 101,892
Adjustments:
Provision for doubtful
accounts and authorized
credits 5,854 $ 4,073 12,574 $ 12,221
Depreciation and
amortization 22,795 18,377 37,032 31,388
Amortization of
unearned stock-based
compensation 747 (776) 1,508 137
Tax benefit on the
exercise of employee
stock options 21,253 33,011 34,638 62,422
Impairment of certain
equity investments -- -- 9,921 1,181
Minority interests and
other (2,715) (1,870) (4,667) (3,912)
Changes in assets and
liabilities:
Accounts receivable (32,644) (6,391) (39,742) (34,223)
Other current assets 5,848 (11,050) 307 (12,611)
Other non-current
assets (1,602) (3,241) (4,097) (2,023)
Deferred tax assets 17 1,558 2,041 (853)
Accounts payable 16,412 2,002 2,866 2,509
Accrued expenses and
other liabilities 3,227 (2,945) 4,790 18,096
Deferred revenue and
customer advances 5,757 5,567 4,256 6,299
Income taxes payable (50) 217 (147) 2,590
-------------------- --------------------
Net cash provided by
operating activities 69,507 92,840 106,955 185,113
-------------------- --------------------
Cash flows from investing
activities:
Purchases of property
and equipment (18,344) (62,724) (29,061) (74,218)
10. Purchases of investments (115,257) (100,150) (168,480) (308,395)
Maturities and sales
of investments 187,806 66,449 437,516 266,958
Purchases of intangibles
and certain non-current
assets (2,065) -- (2,065) --
Proceeds from sale of
property and equipment 60 2,883 4,560 2,883
Acquisitions, net of
cash acquired (1,800) (11,053) (111,012) (54,610)
-------------------- --------------------
Net cash provided by
(used in) investing
activities 50,400 (104,595) 131,458 (167,382)
-------------------- --------------------
Cash flows from financing
activities:
Proceeds from issuance
of common stock, net 21,135 41,440 22,866 68,444
Principal payments on
long-term debt (15,689) (111) (21,780) (3,407)
-------------------- --------------------
Net cash provided by
financing activities 5,446 41,329 1,086 65,037
-------------------- --------------------
Effect of exchange rate
changes on cash and cash
equivalents 149 10,442 (1,607) 10,130
-------------------- --------------------
Net increase in cash and
cash equivalents 125,502 40,016 237,892 92,898
Cash and cash equivalents
at beginning of period 314,263 576,851 201,873 523,969
-------------------- --------------------
Cash and cash equivalents
at end of period $ 439,765 $ 616,867 $ 439,765 $ 616,867
==================== ====================
eBay Inc.
Unaudited Summary of Consolidated Net Revenues
(U.S. Dollars In Thousands)
Net Revenues by Type
---------------------------------------------------
June 30, Sept. 30, Dec. 31, March 31, June 30,
2001 2001 2001 2002 2002
---------------------------------------------------
Online net revenues
Transaction 141,724 152,274 178,946 213,664 235,307
Current quarter vs
prior quarter 9% 7% 18% 19% 10%
Current quarter vs
prior year quarter 78% 70% 68% 65% 66%
End-to-end services 9,431 8,128 4,471 4,869 5,091
Current quarter vs
prior quarter 61% (14%) (45%) 9% 5%
Current quarter vs
prior year quarter 36% (23%) (53%) (17%) (46%)
11. 3rd party
advertising 18,845 25,046 28,179 19,033 16,700
Current quarter vs
prior quarter 60% 33% 13% (32%) (12%)
Current quarter vs
prior year quarter 771% 805% 294% 62% (11%)
---------------------------------------------------
Total online net
revenues 170,000 185,448 211,596 237,566 257,098
---------------------------------------------------
Current quarter vs
prior quarter 15% 9% 14% 12% 8%
Current quarter vs
prior year quarter 92% 80% 72% 61% 51%
---------------------------------------------------
Offline net
revenues 10,905 8,977 7,805 7,540 9,189
---------------------------------------------------
Current quarter vs
prior quarter 62% (18%) (13%) (3%) 22%
Current quarter vs
prior year quarter 14% (15%) (28%) 12% (16%)
---------------------------------------------------
Total net revenues $180,905 $194,425 $219,401 $245,106 $266,287
===================================================
Current quarter vs
prior quarter 17% 7% 13% 12% 9%
Current quarter vs
prior year quarter 84% 71% 64% 59% 47%
Net Revenues by Geography
---------------------------------------------------
June 30, Sept. 30, Dec. 31, March 31, June 30,
2001 2001 2001 2002 2002
---------------------------------------------------
U.S. net revenues 154,969 164,194 179,310 192,555 201,978
Current quarter vs
prior quarter 14% 6% 9% 7% 5%
Current quarter vs
prior year quarter 68% 56% 44% 41% 30%
International net
revenues 25,936 30,231 40,091 52,551 64,309
Current quarter vs
prior quarter 45% 17% 33% 31% 22%
Current quarter vs
prior year quarter 328% 262% 310% 194% 148%
---------------------------------------------------
Total net revenues $180,905 $194,425 $219,401 $245,106 $266,287
===================================================
Current quarter vs
prior quarter 17% 7% 13% 12% 9%
Current quarter vs
prior year quarter 84% 71% 64% 59% 47%