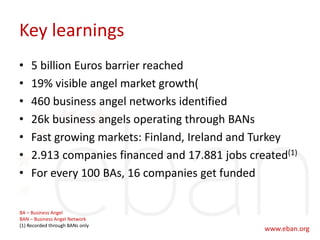
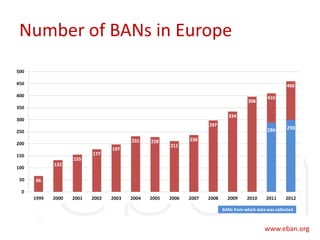
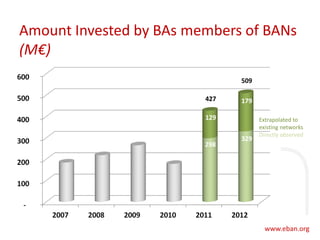
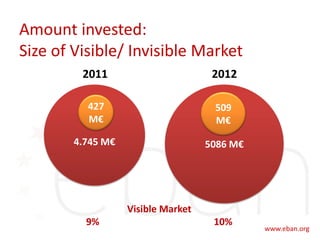
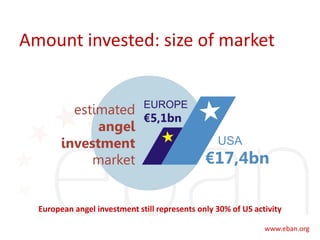
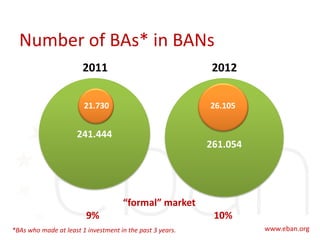
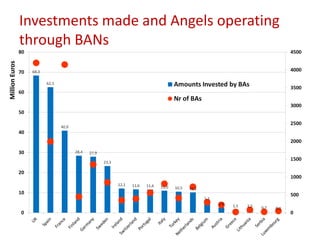
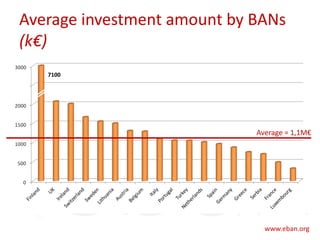
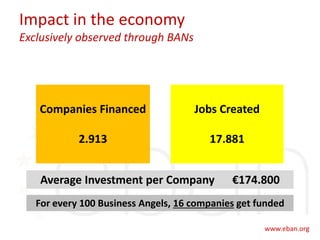
European Angel Investment Overview
2012
www.eban.org info@eban.org
Key learnings
• 5 billion Euros barrier reached
• 19% visible angel market growth(
• 460 business angel networks identified
• 26k business angels operating through BANs
• Fast growing markets: Finland, Ireland and Turkey
• 2.913 companies financed and 17.881 jobs created(1)
• For every 100 BAs, 16 companies get funded
BA – Business Angel
BAN – Business Angel Network
(1) Recorded through BANs only
Introductory note
• Sources:
– Direct statistics provided by EBAN Members
– Deals published by investors
– Published information from credible sources (eg.
government agencies, Bureau van Dijck…)
Number of BANs in Europe
286
BANs from which data was collected
298
Amount Invested by BAs members of BANs
(M€)
Extrapolated to
existing networks
Directly observed
329
179
298
129
427
509
Amount invested:
Size of Visible/ Invisible Market
4.745 M€ 5086 M€
427
M€
509
M€
2011 2012
Visible Market
9% 10%
Amount invested: size of market
European angel investment still represents only 30% of US activity
Number of BAs* in BANs
241.444
261.054
2011 2012
“formal” market
9% 10%
21.730 26.105
*BAs who made at least 1 investment in the past 3 years.
Investments made and Angels operating
through BANs
MillionEuros
Average investment amount by BANs
(k€)
Average = 1,1M€
7100
Visible market growth/ decline
(amount invested)
838%
250%
175%
116%
Light areas: markets with <10M€ of investment
Impact in the economy
Exclusively observed through BANs
Companies Financed
2.913
Jobs Created
17.881
Average Investment per Company €174.800
For every 100 Business Angels, 16 companies get funded
EBAN - The European Trade Association for Business Angels,
Seed Funds, and other Early Stage Market Players
Rue Vautier 54 | 1050 Brussels | Belgium
Tel.: +32 2 626 20 60
Fax: +32 2 626 20 69
info@eban.org
www.eban.org

European business angel investment overview 2012 - European Business Angels Network (EBAN)

  • 1.
    European Angel InvestmentOverview 2012 www.eban.org info@eban.org
  • 2.
    Key learnings • 5billion Euros barrier reached • 19% visible angel market growth( • 460 business angel networks identified • 26k business angels operating through BANs • Fast growing markets: Finland, Ireland and Turkey • 2.913 companies financed and 17.881 jobs created(1) • For every 100 BAs, 16 companies get funded BA – Business Angel BAN – Business Angel Network (1) Recorded through BANs only
  • 3.
    Introductory note • Sources: –Direct statistics provided by EBAN Members – Deals published by investors – Published information from credible sources (eg. government agencies, Bureau van Dijck…)
  • 4.
    Number of BANsin Europe 286 BANs from which data was collected 298
  • 5.
    Amount Invested byBAs members of BANs (M€) Extrapolated to existing networks Directly observed 329 179 298 129 427 509
  • 6.
    Amount invested: Size ofVisible/ Invisible Market 4.745 M€ 5086 M€ 427 M€ 509 M€ 2011 2012 Visible Market 9% 10%
  • 7.
    Amount invested: sizeof market European angel investment still represents only 30% of US activity
  • 8.
    Number of BAs*in BANs 241.444 261.054 2011 2012 “formal” market 9% 10% 21.730 26.105 *BAs who made at least 1 investment in the past 3 years.
  • 9.
    Investments made andAngels operating through BANs MillionEuros
  • 10.
    Average investment amountby BANs (k€) Average = 1,1M€ 7100
  • 11.
    Visible market growth/decline (amount invested) 838% 250% 175% 116% Light areas: markets with <10M€ of investment
  • 12.
    Impact in theeconomy Exclusively observed through BANs Companies Financed 2.913 Jobs Created 17.881 Average Investment per Company €174.800 For every 100 Business Angels, 16 companies get funded
  • 13.
    EBAN - TheEuropean Trade Association for Business Angels, Seed Funds, and other Early Stage Market Players Rue Vautier 54 | 1050 Brussels | Belgium Tel.: +32 2 626 20 60 Fax: +32 2 626 20 69 info@eban.org www.eban.org