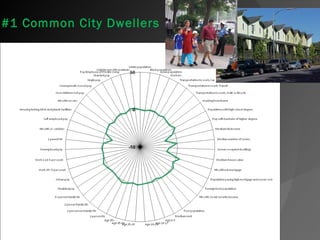
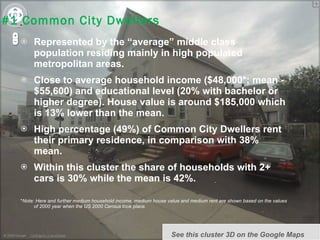
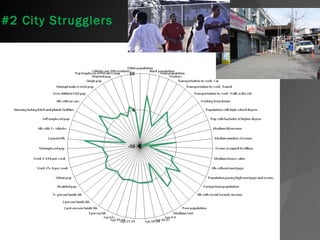
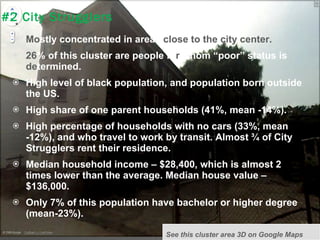
The document summarizes an East Massachusetts geodemographic classification created using 2000 US Census block group data. It identifies 5 clusters in the region based on socioeconomic characteristics. Cluster 1 represents a middle-class population living in cities. Cluster 2 lives near city centers with lower incomes. Cluster 3 consists of wealthy suburban residents. Cluster 4 includes university students and downtown residents. Cluster 5 is suburban middle class households. The classification can be used for market research and analysis applications.
2. Introduction Geodemographics is the analysis of people by where they live (Sleight, 1996) Geodemographic classification categories neighborhoods based on their socio-economic and lifestyle characteristics. Geodemographic segmentation is a multivariate statistical classification technique for discovering whether the individuals of a population fall into different groups by making quantitative comparisons of multiple characteristics with the assumption that the differences within any group should be less than the differences between groups. (Wikipedia)
21. ResearchObjectives To build the geodemographic classification of East Massachusetts based on results of 2000 US Census To create the multipurpose basis for further research analysis To develop and test methodology for more comprehensive geodemographic classifications to be elaborated
22. Research Methodologies The methodology applied for creation of East Massachusetts classification was developed by Dr. Dan Vickers (University of Sheffield) and described in his work “Multi-level Integrated Classification Based on the 2001 Census”. Dr. Vickers has created The National Classification of Census Output Areas for UK, this classification was officially endorsed by the Office for National Statistics (UK). http://www.sasi.group.shef.ac.uk/area_classification/index.html
23. Clustering Process Selection of cluster objects (operational taxonomic units) Variables selection Variables standardisation Clustering method selection Identification of cluster number Interpretation, testing and mapping of clusters
24. Classification Inputs The 4,340 block groups of 9 Massachusetts counties were used: Essex, Middlesex, Suffolk, Norfolk, Bristol, Plymouth, Barnstable, Worchester Total number of households: 2,117,000 Overall population: 5,510,000
25. Project Results Various approaches to the classification design were evaluated and more appropriate ones were selected The geodemographic classification was visually represented and tested in ArcGis, Google Earth and Maptube 5 super clusters were identified, narratively described and mapped. Geographic database of cluster locations has been created
26. Mapping Clusters Mapping clusters in ArcGis using full boundaries – each block group belongs to a certain cluster. Although the population clustering is obvious, uneven census sizes gives wrong perception of the population density. Thus low populated areas dominate on the map
27. Mapping Clusters Mapping clusters in Arcgis using block group centroids represents cluster distribution more accurately and corresponds with population density.
28. Mapping Clusters Mapping the classification visualizes the geodemographicclusterisation and shows that the population is clustered. For example brown dots are grouped representing one of the cluster areas. The created clusters can also be exported to Google Earth…
29. Mapping Clusters or Maptube.org – the online resource which allows to create public maps for free. East Massachusetts Geodemographic Classification Map can be easily accessed there.
30. Naming and Describing Clusters 5 clusters of the classification were named: Common City Dwellers City Strugglers Wealthy Suburbs University Students and Downtown Residents Suburban Middle Class
32. #1 Common City Dwellers Represented by the “average” middle class population residing mainly in high populated metropolitan areas. Close to average household income ($48,000*; mean - $55,600) and educational level (20% with bachelor or higher degree). House value is around $185,000 which is 13% lower than the mean. High percentage (49%) of Common City Dwellers rent their primary residence, in comparison with 38% mean. Within this cluster the share of households with 2+ cars is 30% while the mean is 42%. *Note: Here and further medium household income, medium house value and medium rent are shown based on the values of 2000 year when the US 2000 Census took place. See this cluster 3D on Google Maps
47. High average rent price - $800 (mean - $680), and higher than average share of population who pays high mortgage and housing costs (8%; mean – 3%).See this cluster area 3D on Google Maps
50. Extremely high proportion of people do not use a car as a means of transportation to get to work (64%; mean - 29%), instead they take public transit (29%; mean - 10%), use a bicycle or walk (23%; mean - 5%). Low share of households with 2+ cars (12%; mean – 42%).
51. High percentage of population with bachelor or higher degree (41%; mean 23%). Medium income ($49,000; mean – $55,600), medium house value ($276,000; mean – $211,000).
52. High average rent - $910 (mean - $680) and low proportion of residence owners (28%; mean 61%).See this cluster area 3D on Google Maps
56. 84% (mean - 72%) use car to go to work, 55% (mean- 42%) of households have 2+ cars. Only 5% of households have no car.
57. Household median income is almost the same as the mean - $56,000, but average house value ($175,000) is lower than the mean ($211,000).
58. Large proportion of owner occupied households (78%; mean – 62%).See this cluster area 3D on Google Maps
59. References Callingham, M. (2005), From areal classification to geodemographics, paper presented at the Demographic User Group Conference, Royal Society, London 10th November 2005. Debenham, J. E. (2002), Understanding Geodemographic Classification: Creating The Building Blocks For An Extension, Working Paper 02/1 School of Geography, University of Leeds [online] http://www.geog.leeds.ac.uk/wpapers/02-1.pdf Harris, R., Sleight, P. and Webber, R. (2005), Geodemographics, GIS and Neighbourhood Targeting, London, Wiley Longley, P. A. (2005), Geographical Information Systems: a renaissance of geodemographics for public service delivery, Progress in Human Geography, 29(1) Sleight, P. (2004) Targeting customers: How to Use Geodemographic and Lifestyle Data in Your Business, Henley-on –Thames, World Advertising Research Centre Vickers, D. (2006) , Multi-level Integrated Classification Based on the 2001 Census, The University of Leeds Webber, R. and Farr, M. (2001) , MOSAIC-From an area classification system to household classification, Journal of Targeting, Measurement and Analysis for Marketing,10(1).