
Recommended
Recommended
More Related Content
Similar to Market Regression Analysis Summary
Similar to Market Regression Analysis Summary (20)
Recently uploaded
Recently uploaded (20)
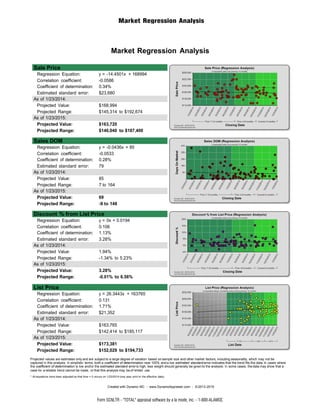
Market Regression Analysis Summary
- 1. Market Regression Analysis Form SCNLTR - "TOTAL" appraisal software by a la mode, inc. - 1-800-ALAMODE Created with Dynamo MC - www.DynamoAppraiser.com - © 2013-2015 Market Regression Analysis Sale Price Regression Equation: y = -14.4501x + 168994 Correlation coefficient: -0.0586 Coefficient of determination: 0.34% Estimated standard error: $23,680 As of 1/23/2014: Projected Value: $168,994 Projected Range: $145,314 to $192,674 As of 1/23/2015: Projected Value: $163,720 Projected Range: $140,040 to $187,400 Sales DOM Regression Equation: y = -0.0436x + 85 Correlation coefficient: -0.0533 Coefficient of determination: 0.28% Estimated standard error: 79 As of 1/23/2014: Projected Value: 85 Projected Range: 7 to 164 As of 1/23/2015: Projected Value: 69 Projected Range: -9 to 148 Discount % from List Price Regression Equation: y = 0x + 0.0194 Correlation coefficient: 0.106 Coefficient of determination: 1.13% Estimated standard error: 3.28% As of 1/23/2014: Projected Value: 1.94% Projected Range: -1.34% to 5.23% As of 1/23/2015: Projected Value: 3.28% Projected Range: -0.01% to 6.56% List Price Regression Equation: y = 26.3443x + 163765 Correlation coefficient: 0.131 Coefficient of determination: 1.71% Estimated standard error: $21,352 As of 1/23/2014: Projected Value: $163,765 Projected Range: $142,414 to $185,117 As of 1/23/2015: Projected Value: $173,381 Projected Range: $152,029 to $194,733 Projected values are estimates only and are subject to a large degree of variation based on sample size and other market factors, including seasonality, which may not be captured in this analysis. In simplistic terms, both a coefficient of determination near 100% and a low estimated standard error indicates that the trend fits the data.In cases where the coefficient of determination is low and/or the estimated standard error is high, less weight should generally be given to the analysis. In some cases, the data may show that a case for a reliable trend cannot be made, or that this analysis may be of limited use. * All equations have been adjusted so that time = 0 occurs on 1/23/2014 (one year prior to the effective date).
- 2. Express Summary Form SCNLTR - "TOTAL" appraisal software by a la mode, inc. - 1-800-ALAMODE Created with Dynamo MC - www.DynamoAppraiser.com - © 2013-2015 Express Summary An analysis of local MLS services revealed the following information regarding recent comparable sales and listings: Average listing price $169,355 Average sale price $166,263 Average DOM 77 days Average discount from list price 2.63% Average sale/list price ratio 97.37% Median listing price $169,900 Median sale price $165,000 Median DOM 52.5 days Median discount from list price 2.28% Median sale/list price ratio 97.72%
- 3. 1004MC Trend Summary Form SCNLTR - "TOTAL" appraisal software by a la mode, inc. - 1-800-ALAMODE Created with Dynamo MC - www.DynamoAppraiser.com - © 2013-2015 1004MC Trend Summary Prior 7 - 12 Months Prior 4 - 6 Months Current - 3 Months 1/23/2014 - 7/22/2014 7/23/2014 - 10/22/2014 10/23/2014 - 1/23/2015 Count Listings 27 29 34 Sales 42 24 24 Price DOM Price DOM Price DOM Average Listings $165,726 64.7 $167,248 97.7 $172,755 111.3 Sales $167,647 85.1 $167,333 64.8 $162,771 75.2 Median Listings $169,900 37 $167,900 76 $172,400 79.5 Sales $163,000 46.5 $171,500 60 $162,500 53 Current - 12 Months 1/23/2014 - 1/23/2015 Count Listings 63 Sales 90 Price DOM Average Listings $169,355 - - Sales $166,263 77 Median Listings $169,900 - - Sales $165,000 52.5
- 4. 42 7.00 27 3.86 $163,000 46.5 $169,900 37 97.64 % 24 8.00 29 3.6 $171,500 60 $167,900 76 98.62 % 24 8.00 34 4.25 $162,500 53 $172,400 79.5 97.59 % Seller concessions are not typical in this market. When there are concessions, they are typically used for closing costs or prepaids. Foreclosures are not a factor in the market. Local MLS services, discussions with local realtors and local lenders Total sales are decreasing. Total active listings are increasing. Months supply is increasing. Median sale price is stable. Median sale DOM is increasing. Median list price is stable. Median list DOM is increasing. Median sale list percent is stable. This analysis may be of limited use due to lack of additional data. Form 1004MC2 - "TOTAL" appraisal software by a la mode, inc. - 1-800-ALAMODE File No.Market Conditions Addendum to the Appraisal Report MARKETRESEARCH&ANALYSISCONDO/CO-OPPROJECTSAPPRAISER The purpose of this addendum is to provide the lender/client with a clear and accurate understanding of the market trends and conditions prevalent in the subject neighborhood. This is a required addendum for all appraisal reports with an effective date on or after April 1, 2009. Property Address City State ZIP Code Borrower Instructions: The appraiser must use the information required on this form as the basis for his/her conclusions, and must provide support for those conclusions, regarding housing trends and overall market conditions as reported in the Neighborhood section of the appraisal report form. The appraiser must fill in all the information to the extent it is available and reliable and must provide analysis as indicated below. If any required data is unavailable or is considered unreliable, the appraiser must provide an explanation. It is recognized that not all data sources will be able to provide data for the shaded areas below; if it is available, however, the appraiser must include the data in the analysis. If data sources provide the required information as an average instead of the median, the appraiser should report the available figure and identify it as an average. Sales and listings must be properties that compete with the subject property, determined by applying the criteria that would be used by a prospective buyer of the subject property. The appraiser must explain any anomalies in the data, such as seasonal markets, new construction, foreclosures, etc. Inventory Analysis Prior 7–12 Months Prior 4–6 Months Current – 3 Months Overall Trend Median Sale & List Price, DOM, Sale/List % Prior 7–12 Months Prior 4–6 Months Current – 3 Months Total # of Comparable Sales (Settled) Absorption Rate (Total Sales/Months) Total # of Comparable Active Listings Months of Housing Supply (Total Listings/Ab.Rate) Median Comparable Sale Price Median Comparable Sales Days on Market Median Comparable List Price Median Comparable Listings Days on Market Median Sale Price as % of List Price Increasing Stable Declining Increasing Stable Declining Declining Stable Increasing Declining Stable Increasing Overall Trend Increasing Stable Declining Declining Stable Increasing Increasing Stable Declining Declining Stable Increasing Increasing Stable Declining Seller-(developer, builder, etc.)paid financial assistance prevalent? Yes No Declining Stable Increasing Explain in detail the seller concessions trends for the past 12 months (e.g., seller contributions increased from 3% to 5%, increasing use of buydowns, closing costs, condo fees, options, etc.). Are foreclosure sales (REO sales) a factor in the market? Yes No If yes, explain (including the trends in listings and sales of foreclosed properties). Cite data sources for above information. Summarize the above information as support for your conclusions in the Neighborhood section of the appraisal report form. If you used any additional information, such as an analysis of pending sales and/or expired and withdrawn listings, to formulate your conclusions, provide both an explanation and support for your conclusions. If the subject is a unit in a condominium or cooperative project , complete the following: Project Name: Subject Project Data Prior 7–12 Months Prior 4–6 Months Current – 3 Months Overall Trend Total # of Comparable Sales (Settled) Absorption Rate (Total Sales/Months) Months of Unit Supply (Total Listings/Ab.Rate) Total # of Active Comparable Listings Increasing Stable Declining Increasing Stable Declining Declining Stable Increasing Declining Stable Increasing Are foreclosure sales (REO sales) a factor in the project? Yes No If yes, indicate the number of REO listings and explain the trends in listings and sales of foreclosed properties. Summarize the above trends and address the impact on the subject unit and project. Signature Appraiser Name Company Name Company Address State License/Certification # State Email Address Signature Supervisory Appraiser Name Company Name Company Address State License/Certification # State Email Address Freddie Mac Form 71 March 2009 Page 1 of 1 Fannie Mae Form 1004MC March 2009
- 5. Form PIC3W - "TOTAL" appraisal software by a la mode, inc. - 1-800-ALAMODE Market Data Chart Addendum Borrower/Client Lender $110,000 $138,000 $166,000 $194,000 $222,000 $250,000 SalePrice Prior 7-12 months Prior 4-6 months Current-3 months 1/23/2014 2/23/2014 3/23/2014 4/23/2014 5/23/2014 6/23/2014 7/23/2014 8/23/2014 9/23/2014 10/23/2014 11/23/2014 12/23/2014 1/23/2015 Closing Date Sale Price Comparable sales over previous 12 months Dynamo MC © 2013-2015 www.DynamoAppraiser.com $110,000 $138,000 $166,000 $194,000 $222,000 $250,000 SalePrice Prior 7-12 months Prior 4-6 months Current-3 mon… 1/23/2014 2/23/20143/23/2014 4/23/2014 5/23/2014 6/23/2014 7/23/2014 8/23/2014 9/23/201410/23/201411/23/201412/23/2014 1/23/2015 Closing Date Linear Regression Equation y = -14.4501x + 168994 Coefficient of Determination R² = 0.34 % Estimated Standard Error S = $23,680 Sale Price Trend Line Estimated Error Range Sale Price (Regression Analysis) Comparable sales over previous 12 months Dynamo MC © 2013-2015 www.DynamoAppraiser.com 82 164 246 328 410 DaysOnMarket Prior 7-12 months Prior 4-6 months Current-3 months 1/23/2014 2/23/2014 3/23/2014 4/23/2014 5/23/2014 6/23/2014 7/23/2014 8/23/2014 9/23/2014 10/23/2014 11/23/2014 12/23/2014 1/23/2015 Closing Date Sales DOM Comparable sales over previous 12 months Dynamo MC © 2013-2015 www.DynamoAppraiser.com Property Address City County State Zip Code
- 6. Form PIC3W - "TOTAL" appraisal software by a la mode, inc. - 1-800-ALAMODE Market Data Chart Addendum Borrower/Client Lender 82 164 246 328 410 DaysOnMarket Prior 7-12 months Prior 4-6 months Current-3 months 1/23/2014 2/23/2014 3/23/2014 4/23/2014 5/23/2014 6/23/2014 7/23/2014 8/23/2014 9/23/2014 10/23/2014 11/23/2014 12/23/2014 1/23/2015 Closing Date Linear Regression Equation y = -0.0436x + 85 Coefficient of Determination R² = 0.28 % Estimated Standard Error S = 79 DOM Trend Line Estimated Error Range Sales DOM (Regression Analysis) Comparable sales over previous 12 months Dynamo MC © 2013-2015 www.DynamoAppraiser.com -5% 0% 5% 10% 15% 20% Discount% Prior 7-12 months Prior 4-6 months Current-3 months 1/23/2014 2/23/2014 3/23/2014 4/23/2014 5/23/2014 6/23/2014 7/23/2014 8/23/2014 9/23/2014 10/23/2014 11/23/2014 12/23/2014 1/23/2015 Closing Date Discount % from List Price Comparable sales over previous 12 months Dynamo MC © 2013-2015 www.DynamoAppraiser.com -5% 0% 5% 10% 15% 20% Discount% Prior 7-12 months Prior 4-6 months Current-3 months 1/23/2014 2/23/2014 3/23/2014 4/23/2014 5/23/2014 6/23/2014 7/23/2014 8/23/2014 9/23/2014 10/23/2014 11/23/2014 12/23/2014 1/23/2015 Closing Date Linear Regression Equation y = 0x + 0.0194 Coefficient of Determination R² = 1.13 % Estimated Standard Error S = 3.28% Discount % Trend Line Estimated Error Range Discount % from List Price (Regression Analysis) Comparable sales over previous 12 months Dynamo MC © 2013-2015 www.DynamoAppraiser.com Property Address City County State Zip Code
- 7. Form PIC3W - "TOTAL" appraisal software by a la mode, inc. - 1-800-ALAMODE Market Data Chart Addendum Borrower/Client Lender $110,000 $134,000 $158,000 $182,000 $206,000 $230,000 ListPrice 7-12 4-6 0-3 5/23/20136/23/20137/23/20138/23/20139/23/201310/23/201311/23/201312/23/20131/23/20142/23/20143/23/20144/23/20145/23/20146/23/20147/23/20148/23/20149/23/201410/23/201411/23/201412/23/20141/23/2015 List Date List Price Comparable listings considered active during previous 12 months Dynamo MC © 2013-2015 www.DynamoAppraiser.com $110,000 $134,000 $158,000 $182,000 $206,000 $230,000 ListPrice 7-12 4-6 0-3 5/23/20136/23/20137/23/20138/23/20139/23/2013 10/23/2013 11/23/2013 12/23/20131/23/20142/23/2014 3/23/20144/23/20145/23/20146/23/20147/23/20148/23/20149/23/2014 10/23/2014 11/23/2014 12/23/20141/23/2015 List Date Linear Regression Equation y = 26.3443x + 163765 Coefficient of Determination R² = 1.71 % Estimated Standard Error S = $21,352 List Price Trend Line Estimated Error Range List Price (Regression Analysis) Comparable listings considered active during previous 12 months Dynamo MC © 2013-2015 www.DynamoAppraiser.com Property Address City County State Zip Code
- 8. Form PIC3W - "TOTAL" appraisal software by a la mode, inc. - 1-800-ALAMODE Market Data Chart Addendum Borrower/Client Lender 0 5 10 15 20 25 30 35 ActiveListings Prior 7-12 months Prior 4-6 months Current-3 months 1/23/2014 2/23/2014 3/23/2014 4/23/2014 5/23/2014 6/23/2014 7/23/2014 8/23/2014 9/23/2014 10/23/2014 11/23/2014 12/23/2014 1/23/2015 Date Inventory History Comparable properties during previous 12 months, compiled by day Dynamo MC © 2013-2015 www.DynamoAppraiser.com Property Address City County State Zip Code
- 9. Form PIC3W - "TOTAL" appraisal software by a la mode, inc. - 1-800-ALAMODE Market Data Chart Addendum Borrower/Client Lender Property Address City County State Zip Code
- 10. Comparables Considered (2/10) Form SCNLTR - "TOTAL" appraisal software by a la mode, inc. - 1-800-ALAMODE Created with Dynamo MC - www.DynamoAppraiser.com - © 2013-2015 MLS # Address Status Price List Price Sold Date Listed Date Pended Date Closed Date Inactive 201308921 10430 FIRELIGHT AVE Sold $189,900 $189,900 6/18/2013 7/29/2013 8/23/2013 201408434 12518 BUCKINGHAM AVE Sold $189,000 $189,000 6/16/2014 8/9/2014 9/19/2014 2014001456 314 SHELBY DR Pending $189,000 10/16/2014 12/27/2014 2014003400 1542 W BELLRIDGE DR Active $189,000 12/7/2014 201401642 12539 E SHERATON DR Sold $194,000 $188,000 2/4/2014 2/23/2014 3/24/2014 2015000023 12025 MOLLYLEA DR Active $187,900 12/30/2014 201411765 13916 LEIGHWOOD AVE Sold $187,500 $187,500 8/14/2014 9/10/2014 10/30/2014 201211442 1790 TUDOR DR Sold $189,000 $187,000 8/9/2012 1/29/2013 2/28/2013 201411614 1302 BRAEBURN DR Sold $189,000 $187,000 8/12/2014 9/30/2014 11/26/2014 2014002540 9443 WOODBINE DR Sold $196,000 $186,500 11/1/2014 11/3/2014 1/7/2015 2014003836 8983 MEADOWOOD DR Active $186,000 12/23/2014 201407601 11563 SHERATON DR Sold $188,900 $185,900 5/31/2014 6/17/2014 7/29/2014 201309170 618 TRAMMELL DR Active $185,000 6/22/2013 201313712 11871 PARKWOOD DR Sold $187,900 $185,000 9/11/2013 10/17/2013 11/15/2013 201410216 12334 BUCKINGHAM AVE Sold $184,900 $184,900 7/16/2014 8/22/2014 10/7/2014 2014000918 1655 CORA DR Active $184,500 10/6/2014 201401555 12431 BROOKSHIRE AVE Sold $188,500 $184,000 2/6/2014 3/20/2014 5/29/2014 2014003583 9320 W VAN PL Active $182,900 12/2/2014 201307467 11079 MAJOR OAK DR Sold $185,000 $182,000 5/21/2013 9/4/2013 10/7/2013 201317772 554 LONITA ST Sold $189,900 $182,000 12/18/2013 1/16/2014 2/25/2014 2015000225 11139 MAJOR OAK DR Active $182,000 1/7/2015 201408378 1024 CORA DR Sold $179,900 $181,500 6/17/2014 7/11/2014 8/21/2014 201401966 12321 SHERBROOK Sold $193,000 $181,000 2/16/2014 6/24/2014 7/30/2014 201409330 475 KAY DR Sold $177,900 $180,800 7/1/2014 9/12/2014
- 11. Comparables Considered (3/10) Form SCNLTR - "TOTAL" appraisal software by a la mode, inc. - 1-800-ALAMODE Created with Dynamo MC - www.DynamoAppraiser.com - © 2013-2015 MLS # Address Status Price List Price Sold Date Listed Date Pended Date Closed Date Inactive 201211668 765 ELIZABETH DR Sold $198,000 $180,000 8/14/2012 3/29/2013 5/31/2013 201300722 13317 E PARNELL AVE Sold $184,000 $180,000 1/15/2013 1/15/2013 1/28/2013 201312671 12555 WARWICK AVE Sold $189,900 $180,000 8/27/2013 9/23/2013 10/1/2013 201301238 12754 E GLENHAVEN DR Sold $179,900 $179,900 1/25/2013 2/19/2013 3/28/2013 201309650 11776 GLENHAVEN DR Sold $179,900 $179,900 7/1/2013 11/6/2013 12/2/2013 201315898 547 WOODCLIFF DR Sold $179,900 $179,900 10/31/2013 5/4/2014 9/5/2014 201404742 10151 GRANDEUR DR Sold $179,900 $179,900 4/9/2014 4/16/2014 5/9/2014 201412331 12265 PARKWOOD DR Active $179,900 8/26/2014 2014002063 12550 E MILLBURN AVE Active $179,900 11/4/2014 2015000829 632 SUMMIT RIDGE DR Active $179,900 1/21/2015 201207797 1302 BRAEBURN DR Sold $178,500 $178,500 6/3/2012 4/13/2013 5/15/2013 2014003120 12318 FAIRHAVEN AVE Active $178,500 12/2/2014 201406923 1542 W BELLRIDGE DR Sold $185,000 $178,000 5/20/2014 6/24/2014 8/7/2014 201412940 9443 CAMMY AVE Sold $176,000 $176,000 9/8/2014 10/7/2014 11/24/2014 201303563 12267 E SHERATON AVE Sold $179,900 $175,000 3/11/2013 3/31/2013 4/26/2013 201406074 9060 MEADOWOOD Sold $175,000 $175,000 5/2/2014 5/5/2014 6/17/2014 201408498 10565 GOODWOOD BLVD Sold $179,900 $175,000 6/17/2014 7/1/2014 8/29/2014 201409077 11750 PARKWOOD DR Active $174,900 6/25/2014 201413045 11636 MOLLYLEA DR Active $174,900 9/11/2014 2014002064 10962 BURTON AVE Pending $174,000 10/31/2014 1/7/2015 201410482 12685 PARNELL AVE Sold $172,900 $172,900 7/21/2014 9/25/2014 11/7/2014 201402310 1079 S TINLEY DR Sold $174,900 $170,000 2/24/2014 3/7/2014 4/1/2014 201316146 428 GLENWILD DR Sold $169,900 $169,900 11/5/2013 1/5/2014 2/7/2014 201405395 12290 QUEENSBURY AVE Sold $169,900 $169,900 4/22/2014 5/5/2014 6/2/2014
- 12. Comparables Considered (4/10) Form SCNLTR - "TOTAL" appraisal software by a la mode, inc. - 1-800-ALAMODE Created with Dynamo MC - www.DynamoAppraiser.com - © 2013-2015 MLS # Address Status Price List Price Sold Date Listed Date Pended Date Closed Date Inactive 201407022 9336 S RIVEROAKS DR Active $169,900 5/7/2014 2015000561 513 OAKFORD DR Active $169,900 1/7/2015 201310644 556 GLENWILD DR Sold $169,000 $169,000 7/18/2013 7/20/2013 8/30/2013 201315450 13640 LEIGHWOOD AVE Sold $169,000 $169,000 10/17/2013 1/30/2014 2/10/2014 201403631 13326 BERWICK AVE Sold $164,500 $169,000 3/23/2014 5/14/2014 5/30/2014 201405288 10988 BELLARBOR DR Active $169,000 4/21/2014 201316823 792 HAVENWOOD DR Sold $167,000 $168,000 11/20/2013 12/13/2013 1/3/2014 201404768 1820 S WOODHAVEN ST Sold $171,900 $168,000 4/9/2014 4/25/2014 5/12/2014 201406606 10448 CLASSIQUE AVE Sold $179,999 $168,000 5/13/2014 7/17/2014 8/27/2014 201413011 10206 RHAPSODY DR Sold $179,900 $168,000 9/10/2014 9/19/2014 10/27/2014 2014001139 12378 FAIRHAVEN DR Pending $167,900 10/10/2014 1/8/2015 201310143 1125 BRAEBURN DR Sold $174,900 $167,500 7/9/2013 7/17/2013 7/26/2013 201403456 11085 CHARINGTON AVE Sold $169,900 $167,500 3/18/2014 4/22/2014 5/23/2014 2014002135 11163 MAJOR OAK DR Active $166,980 11/5/2014 201405190 11520 MOLLYLEA DR Sold $168,500 $166,500 4/15/2014 7/10/2014 8/29/2014 201411109 513 PEBBLEBROOK DR Sold $169,900 $166,000 8/2/2014 9/10/2014 10/30/2014 201209255 555 N PARKVIEW PLACE Sold $179,900 $165,000 6/29/2012 1/28/2013 3/8/2013 201303025 1322 MARILYN DR Sold $169,500 $165,000 3/1/2013 5/10/2013 6/10/2013 201305324 9925 S RIVEROAKS DR Sold $167,900 $165,000 4/10/2013 7/18/2013 8/26/2013 201306507 9722 MOLLYLEA DR Sold $165,000 $165,000 4/25/2013 5/14/2013 6/3/2013 201405636 822 TRAMMELL DR Sold $169,900 $165,000 4/26/2014 8/10/2014 10/23/2014 201406193 1474 S ELAINE DR Sold $165,000 $165,000 5/5/2014 5/10/2014 6/26/2014 201410797 10401 CLASSIQUE AVE Sold $174,900 $165,000 7/28/2014 12/4/2014 12/8/2014 2014000042 424 PEBBLEBROOK DR Sold $175,000 $165,000 9/15/2014 11/11/2014 11/25/2014
- 13. Comparables Considered (5/10) Form SCNLTR - "TOTAL" appraisal software by a la mode, inc. - 1-800-ALAMODE Created with Dynamo MC - www.DynamoAppraiser.com - © 2013-2015 MLS # Address Status Price List Price Sold Date Listed Date Pended Date Closed Date Inactive 2014001962 9465 SOUTHMOOR DR Pending $165,000 10/29/2014 1/5/2015 2015000788 1235 MELANIE ST Active $165,000 1/20/2015 201311131 861 SINCLAIR DR Sold $164,900 $164,900 7/26/2013 9/13/2013 10/16/2013 201407565 11530 PARKWOOD DR Active $164,500 6/2/2014 201302467 10565 GOODWOOD BLVD Sold $180,000 $163,500 2/19/2013 3/6/2013 5/1/2013 201303401 9320 W VAN Sold $169,900 $163,000 3/6/2013 2/11/2014 3/19/2014 201401018 10659 RONDO AVE Sold $171,500 $163,000 1/24/2014 1/31/2014 2/14/2014 201306784 663 N PARKVIEW PLACE Sold $175,000 $162,000 5/7/2013 6/13/2013 7/19/2013 201315103 13244 BERWICK AVE Sold $163,900 $162,000 10/14/2013 3/16/2014 4/25/2014 201317559 12342 MOLLYLEA DR Sold $162,000 $162,000 12/11/2013 2/2/2014 4/30/2014 2015000041 9727 N PARKVIEW DR Active $162,000 12/31/2014 201316624 11147 MAJOR OAK DR Sold $161,800 $161,800 11/13/2013 11/15/2013 11/15/2013 201401519 10114 S RIVEROAKS DR Sold $165,000 $161,500 2/4/2014 2/20/2014 3/21/2014 201203366 12562 SHERBROOK Sold $172,500 $161,000 3/6/2012 2/2/2013 3/15/2013 201304309 1658 S ELAINE DR Sold $167,500 $161,000 3/19/2013 4/15/2013 5/24/2013 201304500 10966 SHERATON DR Sold $164,900 $161,000 3/26/2013 4/1/2013 5/13/2013 201207700 418 N BROADMOOR CIR Sold $169,900 $160,000 5/31/2012 4/18/2013 6/21/2013 201214474 9343 MEREDITH DR Sold $169,000 $160,000 10/17/2012 7/25/2013 8/30/2013 201300587 10458 CLASSIQUE AVE Sold $162,000 $160,000 1/12/2013 1/12/2013 3/14/2013 201301612 254 KIRKLEY PL W Sold $169,000 $160,000 1/30/2013 3/31/2013 5/3/2013 201303896 644 S BURGESS DR Sold $165,000 $160,000 3/14/2013 8/2/2013 10/21/2013 201309368 12230 MOLLYLEA DR Sold $170,000 $160,000 6/24/2013 9/19/2013 9/20/2013 201311951 12272 GOODWOOD BLVD Sold $165,000 $160,000 8/12/2013 10/30/2013 12/20/2013 2014000276 277 E KIRKLEY PL Sold $164,900 $160,000 9/21/2014 9/28/2014 11/10/2014
- 14. Comparables Considered (6/10) Form SCNLTR - "TOTAL" appraisal software by a la mode, inc. - 1-800-ALAMODE Created with Dynamo MC - www.DynamoAppraiser.com - © 2013-2015 MLS # Address Status Price List Price Sold Date Listed Date Pended Date Closed Date Inactive 2015000300 9653 MOLLYLEA DR Active $160,000 1/6/2015 201411809 11625 MOLLYLEA DR Sold $159,900 $159,900 8/16/2014 10/22/2014 11/24/2014 2014002152 424 WILTON DR Active $159,900 11/3/2014 2014003646 459 KAY DR Active $159,900 12/16/2014 201411440 378 WILTON DR Sold $159,800 $159,800 8/8/2014 11/20/2014 1/9/2015 201216779 12340 SHERBROOK Sold $157,717 $157,717 12/12/2012 1/4/2013 1/31/2013 201315894 433 LITTLE JOHN DR Sold $164,900 $157,000 10/31/2013 3/24/2014 4/29/2014 201409794 1905 STONEGATE CT Sold $164,900 $157,000 7/10/2014 9/12/2014 201403696 1333 CAROLYN SUE DR Sold $159,900 $156,175 3/25/2014 3/27/2014 5/9/2014 2015000867 12445 MOLLYLEA DR Active $155,900 1/21/2015 201308067 542 TRAMMELL DR Sold $155,000 $155,500 6/3/2013 7/22/2013 8/23/2013 201410465 1850 WIMPOLE ST Sold $161,000 $155,250 7/21/2014 12/12/2014 1/15/2015 201214369 986 MARLBROOK DR Sold $155,000 $155,000 10/15/2012 12/9/2012 3/8/2013 201215589 1076 HAVENWOOD DR Sold $155,000 $155,000 11/12/2012 5/16/2013 7/10/2013 201300854 9669 JUDI AVE Sold $159,900 $155,000 1/17/2013 1/28/2013 2/28/2013 201304742 12666 E GLENHAVEN DR Sold $158,900 $155,000 4/1/2013 4/5/2013 5/1/2013 201314861 9024 S PARKVIEW DR Sold $159,900 $155,000 10/9/2013 3/6/2014 3/28/2014 201404879 12454 BROOKSHIRE AVE Sold $169,900 $155,000 4/11/2014 8/4/2014 8/21/2014 201407421 10624 SHERMOOR DR Sold $155,000 $155,000 5/29/2014 5/29/2014 5/29/2014 201411315 11640 PARKWOOD DR Active $155,000 8/5/2014 2014002865 404 WILTON DR Sold $158,000 $155,000 11/22/2014 12/10/2014 12/15/2015 201400632 11488 GOODWOOD BLVD Sold $154,900 $154,900 1/15/2014 2/28/2014 3/28/2014 201410712 13907 KATHERINE AVE Sold $154,900 $154,900 7/25/2014 7/25/2014 9/8/2014 201315821 10018 MOLLYLEA DR Sold $154,000 $154,000 10/1/2013 8/30/2013 10/28/2013
- 15. Comparables Considered (7/10) Form SCNLTR - "TOTAL" appraisal software by a la mode, inc. - 1-800-ALAMODE Created with Dynamo MC - www.DynamoAppraiser.com - © 2013-2015 MLS # Address Status Price List Price Sold Date Listed Date Pended Date Closed Date Inactive 201401979 13373 BERWICK AVE Sold $158,000 $154,000 2/17/2014 12/15/2014 1/14/2015 2014000778 1604 CORA DR Sold $162,000 $153,852 9/26/2014 11/3/2014 12/5/2014 201304855 11625 ARCHERY DR Sold $158,000 $153,000 4/2/2013 7/18/2013 8/16/2013 201404736 9555 DAMUTH DR Sold $153,000 $153,000 4/9/2014 5/5/2014 6/19/2014 2014002495 11047 MAJOR OAK DR Active $153,000 11/14/2014 201314238 1852 S WOODHAVEN DR Sold $155,000 $152,500 9/26/2013 10/21/2013 12/4/2013 201404874 12682 SHERBROOK Sold $154,900 $152,450 4/10/2014 6/12/2014 8/8/2014 201408841 12445 ARCHERY DR Sold $179,900 $152,000 6/22/2014 9/15/2014 10/24/2014 2014003589 12738 LOCKHAVEN AVE Active $150,900 12/15/2014 201213172 12235 PARKWOOD AVE Sold $158,900 $150,000 9/15/2012 3/14/2013 4/30/2013 201217037 11016 GOODWOOD BLVD Sold $154,900 $150,000 12/20/2012 1/10/2014 2/12/2014 201302079 765 MARILYN DR Sold $147,500 $150,000 2/8/2013 4/25/2013 5/30/2013 201306590 1244 MARILYN DR Sold $155,000 $150,000 5/2/2013 1/15/2014 1/22/2014 201316734 9423 CAMMY AVE Sold $144,900 $150,000 11/18/2013 12/6/2013 2/26/2014 201212036 1823 S WOODHAVEN DR Sold $149,900 $149,900 8/24/2012 12/3/2012 2/1/2013 201302536 9925 MIRAFLORES DR Sold $149,900 $149,900 2/20/2013 3/25/2013 5/3/2013 201401330 10620 FERNCLIFF AVE Sold $155,000 $149,500 2/1/2014 6/15/2014 7/31/2014 201413132 9449 MOLLYLEA DR Active $149,000 9/12/2014 201316140 1819 S WOODHAVEN DR Sold $155,900 $148,500 11/1/2013 6/7/2014 6/27/2014 201217058 12723 PARNELL AVE Sold $149,900 $147,777 12/19/2012 3/12/2013 5/10/2013 2014001513 445 N PARKVIEW PLACE Sold $149,500 $147,500 10/20/2014 11/25/2014 12/23/2014 201408196 814 DONCASTER DR Sold $159,900 $146,350 6/11/2014 7/3/2014 8/11/2014 201212163 9376 GREENBRIAR DR Sold $149,900 $146,000 8/27/2012 2/15/2013 3/28/2013 201313524 925 E RIVEROAKS DR Sold $149,900 $146,000 9/12/2013 6/11/2014 6/27/2014
- 16. Comparables Considered (8/10) Form SCNLTR - "TOTAL" appraisal software by a la mode, inc. - 1-800-ALAMODE Created with Dynamo MC - www.DynamoAppraiser.com - © 2013-2015 MLS # Address Status Price List Price Sold Date Listed Date Pended Date Closed Date Inactive 201206693 703 SHARP RD Sold $145,000 $145,000 5/7/2012 1/27/2013 2/28/2013 201313248 11840 MOLLYLEA DR Sold $159,900 $145,000 9/6/2013 12/2/2013 12/26/2013 201316363 13232 BERWICK AVE Sold $149,500 $145,000 11/9/2013 4/23/2014 6/23/2014 201400173 11250 GLENHAVEN DR Sold $149,900 $145,000 1/6/2014 6/25/2014 7/17/2014 201401754 327 KIRKLEY PL W Sold $145,000 $145,000 2/11/2014 6/30/2014 8/5/2014 2014000170 10968 WAVERLAND DR Sold $147,500 $145,000 9/18/2014 10/13/2014 11/3/2014 2014000264 10921 WORTHINGTON AVE Pending $145,000 9/17/2014 12/22/2014 2014001453 530 E RIVEROAKS DR Active $145,000 10/17/2014 201400665 13228 AVANTS AVE Sold $155,000 $144,000 1/16/2014 4/21/2014 5/30/2014 201206083 12080 ARCHERY DR Sold $150,000 $143,000 5/1/2012 11/7/2012 2/7/2013 201308948 10921 W ROBIN HOOD DR Sold $148,500 $143,000 6/19/2013 8/14/2013 9/13/2013 201213995 10928 BURTON AVE Sold $149,900 $142,900 10/9/2012 1/3/2013 2/22/2013 201409248 777 S BURGESS DR Active $142,800 7/1/2014 201306747 9524 MEREDITH DR Sold $142,500 $142,500 4/24/2013 7/20/2013 8/16/2013 201312551 1864 BELLROSE DR Sold $151,400 $142,000 8/23/2013 9/20/2013 10/9/2013 201314122 923 S TINLEY DR Sold $150,000 $142,000 9/24/2013 10/31/2013 12/6/2013 2014002553 1085 BRAEBURN DR Sold $144,500 $142,000 11/16/2014 12/19/2014 1/20/2015 201405990 309 LITTLE JOHN DR Sold $150,000 $140,000 5/2/2014 5/21/2014 5/23/2014 201202236 9285 N PARKVIEW Sold $139,900 $139,900 2/14/2012 3/22/2013 5/28/2013 201409332 10822 WAVERLAND DR Pending $139,900 7/1/2014 1/7/2015 201301147 11755 GLENHAVEN DR Sold $149,900 $139,000 1/24/2013 3/18/2013 4/16/2013 201303142 10925 SHERATON DR Sold $144,999 $138,000 3/3/2013 3/27/2013 5/2/2013 201313530 12362 MOLLYLEA DR Sold $137,000 $136,000 9/12/2013 3/19/2014 5/8/2014
- 17. Comparables Considered (9/10) Form SCNLTR - "TOTAL" appraisal software by a la mode, inc. - 1-800-ALAMODE Created with Dynamo MC - www.DynamoAppraiser.com - © 2013-2015 MLS # Address Status Price List Price Sold Date Listed Date Pended Date Closed Date Inactive 201208730 661 VOOHRIES DR Sold $148,500 $135,000 6/20/2012 2/17/2013 4/15/2013 201401624 13814 KATHERINE AVE Pending $135,000 2/3/2014 11/12/2014 201212632 8974 MEADOWOOD Sold $139,900 $134,900 9/10/2012 12/10/2012 2/5/2013 201406188 380 NASSAU DR Sold $134,900 $134,900 5/7/2014 7/28/2014 8/29/2014 201312971 12285 ARCHERY DR Sold $134,900 $132,000 9/1/2013 11/12/2013 1/17/2014 201301191 960 E RIVEROAKS DR Sold $139,500 $131,000 1/25/2013 3/8/2013 4/12/2013 201306957 9878 MIRAFLORES DR Sold $139,900 $131,000 5/11/2013 6/28/2013 10/18/2013 201216590 1021 BRAEBURN DR Sold $136,650 $130,000 12/10/2012 8/5/2013 10/30/2013 201309914 545 CORA DR Sold $130,000 $130,000 7/5/2013 7/5/2013 7/5/2013 201314703 350 NASSAU DR Sold $130,000 $130,000 10/6/2013 10/8/2013 11/23/2013 201406675 277 BROADMOOR AVE Sold $130,000 $130,000 4/28/2014 4/29/2014 5/8/2014 201304598 13268 ARLINGFORD AVE Sold $129,000 $129,000 3/25/2013 7/27/2013 9/30/2013 201308350 1447 STOKLEY PL Sold $127,500 $127,500 6/6/2013 8/1/2013 10/8/2013 201302001 526 GLENWILD DR Sold $129,900 $127,300 2/7/2013 3/27/2013 6/12/2013 201314407 9087 REDBUD AVE Sold $124,900 $126,350 9/30/2013 10/7/2013 11/15/2013 201215561 12842 ARLINGFORD AVE Sold $125,000 $125,000 11/10/2012 4/5/2013 6/28/2013 201216126 9060 FLORIDA BLVD Sold $122,000 $125,000 11/26/2012 1/30/2013 2/26/2013 201402568 10969 MAJOR OAK DR Sold $139,900 $125,000 2/28/2014 5/30/2014 6/16/2014 201211281 458 KAY DR Sold $129,900 $123,000 8/8/2012 1/18/2013 2/14/2013 201308508 12351 ARCHERY DR Sold $127,000 $123,000 6/11/2013 7/2/2013 8/15/2013 201217158 859 TIFTON DR Sold $129,500 $121,000 12/25/2012 5/6/2013 8/16/2013 201406209 10135 GRANDEUR DR Sold $119,700 $120,800 5/7/2014 9/10/2014 10/28/2014 201301409 12625 E SHERATON AVE Sold $120,750 $120,750 12/18/2012 12/18/2012 1/24/2013 201312826 11733 PARKWOOD DR Sold $124,900 $120,000 8/28/2013 9/25/2013 10/16/2013
- 18. Comparables Considered (10/10) Form SCNLTR - "TOTAL" appraisal software by a la mode, inc. - 1-800-ALAMODE Created with Dynamo MC - www.DynamoAppraiser.com - © 2013-2015 MLS # Address Status Price List Price Sold Date Listed Date Pended Date Closed Date Inactive 201407599 840 DARTMOOR DR Sold $124,900 $120,000 6/2/2014 7/29/2014 9/30/2014 201408611 12471 PARKWOOD DR Sold $129,900 $120,000 6/18/2014 9/15/2014 10/10/2014 201408760 12461 PARKWOOD AVE Sold $140,000 $120,000 6/23/2014 12/16/2014 1/5/2015 2014003079 1302 S FLANNERY RD Pending $120,000 12/1/2014 12/5/2014
- 19. Comparables Included (1/6) Form SCNLTR - "TOTAL" appraisal software by a la mode, inc. - 1-800-ALAMODE Created with Dynamo MC - www.DynamoAppraiser.com - © 2013-2015 Comparables Included MLS # Address Status Price List Price Sold Date Listed Date Pended Date Closed Date Inactive 201318075 12031 BEAUVERDE CT Sold $252,000 $242,000 12/12/2013 6/6/2014 7/21/2014 201408768 10443 STARLIGHT AVE Sold $229,000 $222,500 6/22/2014 6/26/2014 7/18/2014 201410240 10423 N CARRIAGE HOUSE AVE Sold $224,500 $222,500 7/16/2014 7/25/2014 7/31/2014 201404916 220 CHAPEL VIEW CT Sold $220,000 $218,000 4/12/2014 5/30/2014 7/11/2014 201412281 9927 REGENCY DR Active $209,900 8/25/2014 2014003071 1790 TUDOR DR Active $209,900 12/1/2014 201402342 11531 MILLBURN DR Sold $210,000 $205,000 2/24/2014 4/10/2014 5/12/2014 2015000420 12471 PARKWOOD DR Sold $205,000 $205,000 1/9/2015 1/9/2015 1/9/2015 201315688 923 SINCLAIR DR Sold $199,900 $199,900 10/27/2013 5/18/2014 6/9/2014 201406067 555 CORA DR Sold $205,000 $199,500 3/31/2014 6/10/2014 7/3/2014 2014000488 745 DONCASTER DR Pending $199,000 9/26/2014 12/10/2014 201315812 748 N PARKVIEW PLACE Sold $215,000 $195,000 10/29/2013 1/7/2014 1/31/2014 201410313 10941 CHARINGTON AVE Sold $197,000 $195,000 7/17/2014 8/8/2014 9/17/2014 2014001305 12441 E SHERATON AVE Active $195,000 10/15/2014 201407261 1336 SHERWOOD FOREST BLVD Active $194,900 5/27/2014 201406239 9444 CAMMY AVE Sold $192,900 $192,900 5/6/2014 6/16/2014 7/31/2014 201405961 1418 CORA DR Sold $199,500 $192,500 4/28/2014 9/25/2014 10/23/2014 201408434 12518 BUCKINGHAM AVE Sold $189,000 $189,000 6/16/2014 8/9/2014 9/19/2014 2014001456 314 SHELBY DR Pending $189,000 10/16/2014 12/27/2014 2014003400 1542 W BELLRIDGE DR Active $189,000 12/7/2014 201401642 12539 E SHERATON DR Sold $194,000 $188,000 2/4/2014 2/23/2014 3/24/2014 2015000023 12025 MOLLYLEA DR Active $187,900 12/30/2014
- 20. Comparables Included (2/6) Form SCNLTR - "TOTAL" appraisal software by a la mode, inc. - 1-800-ALAMODE Created with Dynamo MC - www.DynamoAppraiser.com - © 2013-2015 MLS # Address Status Price List Price Sold Date Listed Date Pended Date Closed Date Inactive 201411765 13916 LEIGHWOOD AVE Sold $187,500 $187,500 8/14/2014 9/10/2014 10/30/2014 201411614 1302 BRAEBURN DR Sold $189,000 $187,000 8/12/2014 9/30/2014 11/26/2014 2014002540 9443 WOODBINE DR Sold $196,000 $186,500 11/1/2014 11/3/2014 1/7/2015 2014003836 8983 MEADOWOOD DR Active $186,000 12/23/2014 201407601 11563 SHERATON DR Sold $188,900 $185,900 5/31/2014 6/17/2014 7/29/2014 201309170 618 TRAMMELL DR Active $185,000 6/22/2013 201410216 12334 BUCKINGHAM AVE Sold $184,900 $184,900 7/16/2014 8/22/2014 10/7/2014 2014000918 1655 CORA DR Active $184,500 10/6/2014 201401555 12431 BROOKSHIRE AVE Sold $188,500 $184,000 2/6/2014 3/20/2014 5/29/2014 2014003583 9320 W VAN PL Active $182,900 12/2/2014 201317772 554 LONITA ST Sold $189,900 $182,000 12/18/2013 1/16/2014 2/25/2014 2015000225 11139 MAJOR OAK DR Active $182,000 1/7/2015 201408378 1024 CORA DR Sold $179,900 $181,500 6/17/2014 7/11/2014 8/21/2014 201401966 12321 SHERBROOK Sold $193,000 $181,000 2/16/2014 6/24/2014 7/30/2014 201409330 475 KAY DR Sold $177,900 $180,800 7/1/2014 9/12/2014 201315898 547 WOODCLIFF DR Sold $179,900 $179,900 10/31/2013 5/4/2014 9/5/2014 201404742 10151 GRANDEUR DR Sold $179,900 $179,900 4/9/2014 4/16/2014 5/9/2014 201412331 12265 PARKWOOD DR Active $179,900 8/26/2014 2014002063 12550 E MILLBURN AVE Active $179,900 11/4/2014 2015000829 632 SUMMIT RIDGE DR Active $179,900 1/21/2015 2014003120 12318 FAIRHAVEN AVE Active $178,500 12/2/2014 201406923 1542 W BELLRIDGE DR Sold $185,000 $178,000 5/20/2014 6/24/2014 8/7/2014 201412940 9443 CAMMY AVE Sold $176,000 $176,000 9/8/2014 10/7/2014 11/24/2014 201406074 9060 MEADOWOOD Sold $175,000 $175,000 5/2/2014 5/5/2014 6/17/2014
- 21. Comparables Included (3/6) Form SCNLTR - "TOTAL" appraisal software by a la mode, inc. - 1-800-ALAMODE Created with Dynamo MC - www.DynamoAppraiser.com - © 2013-2015 MLS # Address Status Price List Price Sold Date Listed Date Pended Date Closed Date Inactive 201408498 10565 GOODWOOD BLVD Sold $179,900 $175,000 6/17/2014 7/1/2014 8/29/2014 201409077 11750 PARKWOOD DR Active $174,900 6/25/2014 201413045 11636 MOLLYLEA DR Active $174,900 9/11/2014 201410482 12685 PARNELL AVE Sold $172,900 $172,900 7/21/2014 9/25/2014 11/7/2014 201402310 1079 S TINLEY DR Sold $174,900 $170,000 2/24/2014 3/7/2014 4/1/2014 201316146 428 GLENWILD DR Sold $169,900 $169,900 11/5/2013 1/5/2014 2/7/2014 201405395 12290 QUEENSBURY AVE Sold $169,900 $169,900 4/22/2014 5/5/2014 6/2/2014 201407022 9336 S RIVEROAKS DR Active $169,900 5/7/2014 2015000561 513 OAKFORD DR Active $169,900 1/7/2015 201315450 13640 LEIGHWOOD AVE Sold $169,000 $169,000 10/17/2013 1/30/2014 2/10/2014 201403631 13326 BERWICK AVE Sold $164,500 $169,000 3/23/2014 5/14/2014 5/30/2014 201405288 10988 BELLARBOR DR Active $169,000 4/21/2014 201404768 1820 S WOODHAVEN ST Sold $171,900 $168,000 4/9/2014 4/25/2014 5/12/2014 201406606 10448 CLASSIQUE AVE Sold $179,999 $168,000 5/13/2014 7/17/2014 8/27/2014 201413011 10206 RHAPSODY DR Sold $179,900 $168,000 9/10/2014 9/19/2014 10/27/2014 2014001139 12378 FAIRHAVEN DR Pending $167,900 10/10/2014 1/8/2015 201403456 11085 CHARINGTON AVE Sold $169,900 $167,500 3/18/2014 4/22/2014 5/23/2014 2014002135 11163 MAJOR OAK DR Active $166,980 11/5/2014 201405190 11520 MOLLYLEA DR Sold $168,500 $166,500 4/15/2014 7/10/2014 8/29/2014 201411109 513 PEBBLEBROOK DR Sold $169,900 $166,000 8/2/2014 9/10/2014 10/30/2014 201405636 822 TRAMMELL DR Sold $169,900 $165,000 4/26/2014 8/10/2014 10/23/2014 201406193 1474 S ELAINE DR Sold $165,000 $165,000 5/5/2014 5/10/2014 6/26/2014 201410797 10401 CLASSIQUE AVE Sold $174,900 $165,000 7/28/2014 12/4/2014 12/8/2014 2014000042 424 PEBBLEBROOK DR Sold $175,000 $165,000 9/15/2014 11/11/2014 11/25/2014
- 22. Comparables Included (4/6) Form SCNLTR - "TOTAL" appraisal software by a la mode, inc. - 1-800-ALAMODE Created with Dynamo MC - www.DynamoAppraiser.com - © 2013-2015 MLS # Address Status Price List Price Sold Date Listed Date Pended Date Closed Date Inactive 2015000788 1235 MELANIE ST Active $165,000 1/20/2015 201407565 11530 PARKWOOD DR Active $164,500 6/2/2014 201303401 9320 W VAN Sold $169,900 $163,000 3/6/2013 2/11/2014 3/19/2014 201401018 10659 RONDO AVE Sold $171,500 $163,000 1/24/2014 1/31/2014 2/14/2014 201315103 13244 BERWICK AVE Sold $163,900 $162,000 10/14/2013 3/16/2014 4/25/2014 201317559 12342 MOLLYLEA DR Sold $162,000 $162,000 12/11/2013 2/2/2014 4/30/2014 2015000041 9727 N PARKVIEW DR Active $162,000 12/31/2014 201401519 10114 S RIVEROAKS DR Sold $165,000 $161,500 2/4/2014 2/20/2014 3/21/2014 2014000276 277 E KIRKLEY PL Sold $164,900 $160,000 9/21/2014 9/28/2014 11/10/2014 2015000300 9653 MOLLYLEA DR Active $160,000 1/6/2015 201411809 11625 MOLLYLEA DR Sold $159,900 $159,900 8/16/2014 10/22/2014 11/24/2014 2014002152 424 WILTON DR Active $159,900 11/3/2014 2014003646 459 KAY DR Active $159,900 12/16/2014 201411440 378 WILTON DR Sold $159,800 $159,800 8/8/2014 11/20/2014 1/9/2015 201315894 433 LITTLE JOHN DR Sold $164,900 $157,000 10/31/2013 3/24/2014 4/29/2014 201409794 1905 STONEGATE CT Sold $164,900 $157,000 7/10/2014 9/12/2014 201403696 1333 CAROLYN SUE DR Sold $159,900 $156,175 3/25/2014 3/27/2014 5/9/2014 2015000867 12445 MOLLYLEA DR Active $155,900 1/21/2015 201410465 1850 WIMPOLE ST Sold $161,000 $155,250 7/21/2014 12/12/2014 1/15/2015 201314861 9024 S PARKVIEW DR Sold $159,900 $155,000 10/9/2013 3/6/2014 3/28/2014 201404879 12454 BROOKSHIRE AVE Sold $169,900 $155,000 4/11/2014 8/4/2014 8/21/2014 201407421 10624 SHERMOOR DR Sold $155,000 $155,000 5/29/2014 5/29/2014 5/29/2014 201411315 11640 PARKWOOD DR Active $155,000 8/5/2014 201400632 11488 GOODWOOD BLVD Sold $154,900 $154,900 1/15/2014 2/28/2014 3/28/2014
- 23. Comparables Included (5/6) Form SCNLTR - "TOTAL" appraisal software by a la mode, inc. - 1-800-ALAMODE Created with Dynamo MC - www.DynamoAppraiser.com - © 2013-2015 MLS # Address Status Price List Price Sold Date Listed Date Pended Date Closed Date Inactive 201410712 13907 KATHERINE AVE Sold $154,900 $154,900 7/25/2014 7/25/2014 9/8/2014 201401979 13373 BERWICK AVE Sold $158,000 $154,000 2/17/2014 12/15/2014 1/14/2015 2014000778 1604 CORA DR Sold $162,000 $153,852 9/26/2014 11/3/2014 12/5/2014 201404736 9555 DAMUTH DR Sold $153,000 $153,000 4/9/2014 5/5/2014 6/19/2014 2014002495 11047 MAJOR OAK DR Active $153,000 11/14/2014 201404874 12682 SHERBROOK Sold $154,900 $152,450 4/10/2014 6/12/2014 8/8/2014 201408841 12445 ARCHERY DR Sold $179,900 $152,000 6/22/2014 9/15/2014 10/24/2014 2014003589 12738 LOCKHAVEN AVE Active $150,900 12/15/2014 201217037 11016 GOODWOOD BLVD Sold $154,900 $150,000 12/20/2012 1/10/2014 2/12/2014 201316734 9423 CAMMY AVE Sold $144,900 $150,000 11/18/2013 12/6/2013 2/26/2014 201401330 10620 FERNCLIFF AVE Sold $155,000 $149,500 2/1/2014 6/15/2014 7/31/2014 201413132 9449 MOLLYLEA DR Active $149,000 9/12/2014 201316140 1819 S WOODHAVEN DR Sold $155,900 $148,500 11/1/2013 6/7/2014 6/27/2014 2014001513 445 N PARKVIEW PLACE Sold $149,500 $147,500 10/20/2014 11/25/2014 12/23/2014 201408196 814 DONCASTER DR Sold $159,900 $146,350 6/11/2014 7/3/2014 8/11/2014 201313524 925 E RIVEROAKS DR Sold $149,900 $146,000 9/12/2013 6/11/2014 6/27/2014 201316363 13232 BERWICK AVE Sold $149,500 $145,000 11/9/2013 4/23/2014 6/23/2014 201400173 11250 GLENHAVEN DR Sold $149,900 $145,000 1/6/2014 6/25/2014 7/17/2014 201401754 327 KIRKLEY PL W Sold $145,000 $145,000 2/11/2014 6/30/2014 8/5/2014 2014000170 10968 WAVERLAND DR Sold $147,500 $145,000 9/18/2014 10/13/2014 11/3/2014 2014000264 10921 WORTHINGTON AVE Pending $145,000 9/17/2014 12/22/2014 2014001453 530 E RIVEROAKS DR Active $145,000 10/17/2014 201400665 13228 AVANTS AVE Sold $155,000 $144,000 1/16/2014 4/21/2014 5/30/2014
- 24. Comparables Included (6/6) Form SCNLTR - "TOTAL" appraisal software by a la mode, inc. - 1-800-ALAMODE Created with Dynamo MC - www.DynamoAppraiser.com - © 2013-2015 MLS # Address Status Price List Price Sold Date Listed Date Pended Date Closed Date Inactive 201409248 777 S BURGESS DR Active $142,800 7/1/2014 2014002553 1085 BRAEBURN DR Sold $144,500 $142,000 11/16/2014 12/19/2014 1/20/2015 201405990 309 LITTLE JOHN DR Sold $150,000 $140,000 5/2/2014 5/21/2014 5/23/2014 201409332 10822 WAVERLAND DR Pending $139,900 7/1/2014 1/7/2015 201313530 12362 MOLLYLEA DR Sold $137,000 $136,000 9/12/2013 3/19/2014 5/8/2014 201401624 13814 KATHERINE AVE Pending $135,000 2/3/2014 11/12/2014 201406188 380 NASSAU DR Sold $134,900 $134,900 5/7/2014 7/28/2014 8/29/2014 201406675 277 BROADMOOR AVE Sold $130,000 $130,000 4/28/2014 4/29/2014 5/8/2014 201402568 10969 MAJOR OAK DR Sold $139,900 $125,000 2/28/2014 5/30/2014 6/16/2014 201406209 10135 GRANDEUR DR Sold $119,700 $120,800 5/7/2014 9/10/2014 10/28/2014 201407599 840 DARTMOOR DR Sold $124,900 $120,000 6/2/2014 7/29/2014 9/30/2014 201408611 12471 PARKWOOD DR Sold $129,900 $120,000 6/18/2014 9/15/2014 10/10/2014 201408760 12461 PARKWOOD AVE Sold $140,000 $120,000 6/23/2014 12/16/2014 1/5/2015
- 25. 1004MC Trend Worksheet (1/22) Form SCNLTR - "TOTAL" appraisal software by a la mode, inc. - 1-800-ALAMODE Created with Dynamo MC - www.DynamoAppraiser.com - © 2013-2015 1004MC Trend Worksheet Comparables in analysis Total considered: 217 Total included: 130 Effective date: 1/23/2015 Prior 7 - 12 Months Prior 4 - 6 Months Current - 3 Months 1/23/2014 - 7/22/2014 7/23/2014 - 10/22/2014 10/23/2014 - 1/23/2015 MLS # ---------- Address Status Listed Used As Price DOM Price DOM Price DOM Pended Closed Inactivated 201212240 ---------- 10914 MAY BELLE CT Sold 8/31/2012 11/9/2012 3/6/2013 2014002630 ---------- 10914 MAY BELLE CT Pending 11/14/2014 1/6/2015 201318075 ---------- 12031 BEAUVERDE CT Sold 12/12/2013 6/6/2014 7/21/2014 Sale $252,000 176 201408768 ---------- 10443 STARLIGHT AVE Sold 6/22/2014 6/26/2014 7/18/2014 Sale $229,000 4 201410240 ---------- 10423 N CARRIAGE HOUSE AVE Sold 7/16/2014 Listing $224,500 7 7/25/2014 7/31/2014 Sale $224,500 9 201404916 ---------- 220 CHAPEL VIEW CT Sold 4/12/2014 5/30/2014 7/11/2014 Sale $220,000 48 201412281 ---------- 9927 REGENCY DR Active 8/25/2014 Listing $209,900 59 $209,900 151 2014003071 ---------- 1790 TUDOR DR Active 12/1/2014 Listing $209,900 53
- 26. 1004MC Trend Worksheet (2/22) Form SCNLTR - "TOTAL" appraisal software by a la mode, inc. - 1-800-ALAMODE Created with Dynamo MC - www.DynamoAppraiser.com - © 2013-2015 Prior 7 - 12 Months Prior 4 - 6 Months Current - 3 Months 1/23/2014 - 7/22/2014 7/23/2014 - 10/22/2014 10/23/2014 - 1/23/2015 MLS # ---------- Address Status Listed Used As Price DOM Price DOM Price DOM Pended Closed Inactivated 201402342 ---------- 11531 MILLBURN DR Sold 2/24/2014 4/10/2014 5/12/2014 Sale $210,000 45 2015000420 ---------- 12471 PARKWOOD DR Sold 1/9/2015 1/9/2015 1/9/2015 Sale $205,000 0 201411455 ---------- 12114 E GLENHAVEN DR Pending 8/8/2014 9/27/2014 201315688 ---------- 923 SINCLAIR DR Sold 10/27/2013 5/18/2014 6/9/2014 Sale $199,900 203 201406067 ---------- 555 CORA DR Sold 3/31/2014 6/10/2014 7/3/2014 Sale $205,000 71 2014000488 ---------- 745 DONCASTER DR Pending 9/26/2014 Listing $199,000 27 12/10/2014 201310727 ---------- 12443 FAIRHAVEN DR Sold 7/21/2013 12/6/2013 1/17/2014 201212826 ---------- 10492 E GRANDEUR DR Sold 9/13/2012 1/10/2013 2/15/2013 201315812 ---------- 748 N PARKVIEW PLACE Sold 10/29/2013 1/7/2014 1/31/2014 Sale $215,000 70 201410313 ---------- 10941 CHARINGTON AVE Sold 7/17/2014 Listing $197,000 6 8/8/2014 9/17/2014 Sale $197,000 22
- 27. Comparables Considered (1/10) Form SCNLTR - "TOTAL" appraisal software by a la mode, inc. - 1-800-ALAMODE Created with Dynamo MC - www.DynamoAppraiser.com - © 2013-2015 Comparables Considered MLS # Address Status Price List Price Sold Date Listed Date Pended Date Closed Date Inactive 201212240 10914 MAY BELLE CT Sold $269,900 $259,000 8/31/2012 11/9/2012 3/6/2013 2014002630 10914 MAY BELLE CT Pending $246,900 11/14/2014 1/6/2015 201318075 12031 BEAUVERDE CT Sold $252,000 $242,000 12/12/2013 6/6/2014 7/21/2014 201408768 10443 STARLIGHT AVE Sold $229,000 $222,500 6/22/2014 6/26/2014 7/18/2014 201410240 10423 N CARRIAGE HOUSE AVE Sold $224,500 $222,500 7/16/2014 7/25/2014 7/31/2014 201404916 220 CHAPEL VIEW CT Sold $220,000 $218,000 4/12/2014 5/30/2014 7/11/2014 201412281 9927 REGENCY DR Active $209,900 8/25/2014 2014003071 1790 TUDOR DR Active $209,900 12/1/2014 201402342 11531 MILLBURN DR Sold $210,000 $205,000 2/24/2014 4/10/2014 5/12/2014 2015000420 12471 PARKWOOD DR Sold $205,000 $205,000 1/9/2015 1/9/2015 1/9/2015 201411455 12114 E GLENHAVEN DR Pending $200,000 8/8/2014 9/27/2014 201315688 923 SINCLAIR DR Sold $199,900 $199,900 10/27/2013 5/18/2014 6/9/2014 201406067 555 CORA DR Sold $205,000 $199,500 3/31/2014 6/10/2014 7/3/2014 2014000488 745 DONCASTER DR Pending $199,000 9/26/2014 12/10/2014 201310727 12443 FAIRHAVEN DR Sold $199,000 $196,000 7/21/2013 12/6/2013 1/17/2014 201212826 10492 E GRANDEUR DR Sold $199,900 $195,000 9/13/2012 1/10/2013 2/15/2013 201315812 748 N PARKVIEW PLACE Sold $215,000 $195,000 10/29/2013 1/7/2014 1/31/2014 201410313 10941 CHARINGTON AVE Sold $197,000 $195,000 7/17/2014 8/8/2014 9/17/2014 2014001305 12441 E SHERATON AVE Active $195,000 10/15/2014 201407261 1336 SHERWOOD FOREST BLVD Active $194,900 5/27/2014 201406239 9444 CAMMY AVE Sold $192,900 $192,900 5/6/2014 6/16/2014 7/31/2014 201405961 1418 CORA DR Sold $199,500 $192,500 4/28/2014 9/25/2014 10/23/2014
- 28. 1004MC Trend Worksheet (3/22) Form SCNLTR - "TOTAL" appraisal software by a la mode, inc. - 1-800-ALAMODE Created with Dynamo MC - www.DynamoAppraiser.com - © 2013-2015 Prior 7 - 12 Months Prior 4 - 6 Months Current - 3 Months 1/23/2014 - 7/22/2014 7/23/2014 - 10/22/2014 10/23/2014 - 1/23/2015 MLS # ---------- Address Status Listed Used As Price DOM Price DOM Price DOM Pended Closed Inactivated 2014001305 ---------- 12441 E SHERATON AVE Active 10/15/2014 Listing $195,000 8 $195,000 100 201407261 ---------- 1336 SHERWOOD FOREST BLVD Active 5/27/2014 Listing $194,900 57 $194,900 149 $194,900 241 201406239 ---------- 9444 CAMMY AVE Sold 5/6/2014 6/16/2014 7/31/2014 Sale $192,900 41 201405961 ---------- 1418 CORA DR Sold 4/28/2014 Listing $199,500 86 9/25/2014 10/23/2014 Sale $199,500 150 201308921 ---------- 10430 FIRELIGHT AVE Sold 6/18/2013 7/29/2013 8/23/2013 201408434 ---------- 12518 BUCKINGHAM AVE Sold 6/16/2014 Listing $189,000 37 8/9/2014 9/19/2014 Sale $189,000 54 2014001456 ---------- 314 SHELBY DR Pending 10/16/2014 Listing $189,000 7 12/27/2014 2014003400 ---------- 1542 W BELLRIDGE DR Active 12/7/2014 Listing $189,000 47 201401642 ---------- 12539 E SHERATON DR Sold 2/4/2014 2/23/2014 3/24/2014 Sale $194,000 19 2015000023 ---------- 12025 MOLLYLEA DR Active 12/30/2014 Listing $187,900 24
- 29. 1004MC Trend Worksheet (4/22) Form SCNLTR - "TOTAL" appraisal software by a la mode, inc. - 1-800-ALAMODE Created with Dynamo MC - www.DynamoAppraiser.com - © 2013-2015 Prior 7 - 12 Months Prior 4 - 6 Months Current - 3 Months 1/23/2014 - 7/22/2014 7/23/2014 - 10/22/2014 10/23/2014 - 1/23/2015 MLS # ---------- Address Status Listed Used As Price DOM Price DOM Price DOM Pended Closed Inactivated 201411765 ---------- 13916 LEIGHWOOD AVE Sold 8/14/2014 9/10/2014 10/30/2014 Sale $187,500 27 201211442 ---------- 1790 TUDOR DR Sold 8/9/2012 1/29/2013 2/28/2013 201411614 ---------- 1302 BRAEBURN DR Sold 8/12/2014 9/30/2014 11/26/2014 Sale $189,000 49 2014002540 ---------- 9443 WOODBINE DR Sold 11/1/2014 11/3/2014 1/7/2015 Sale $196,000 2 2014003836 ---------- 8983 MEADOWOOD DR Active 12/23/2014 Listing $186,000 31 201407601 ---------- 11563 SHERATON DR Sold 5/31/2014 6/17/2014 7/29/2014 Sale $188,900 17 201309170 ---------- 618 TRAMMELL DR Active 6/22/2013 Listing $185,000 396 $185,000 488 $185,000 580 201313712 ---------- 11871 PARKWOOD DR Sold 9/11/2013 10/17/2013 11/15/2013 201410216 ---------- 12334 BUCKINGHAM AVE Sold 7/16/2014 Listing $184,900 7 8/22/2014 10/7/2014 Sale $184,900 37 2014000918 ---------- 1655 CORA DR Active 10/6/2014 Listing $184,500 17 $184,500 109
- 30. 1004MC Trend Worksheet (5/22) Form SCNLTR - "TOTAL" appraisal software by a la mode, inc. - 1-800-ALAMODE Created with Dynamo MC - www.DynamoAppraiser.com - © 2013-2015 Prior 7 - 12 Months Prior 4 - 6 Months Current - 3 Months 1/23/2014 - 7/22/2014 7/23/2014 - 10/22/2014 10/23/2014 - 1/23/2015 MLS # ---------- Address Status Listed Used As Price DOM Price DOM Price DOM Pended Closed Inactivated 201401555 ---------- 12431 BROOKSHIRE AVE Sold 2/6/2014 3/20/2014 5/29/2014 Sale $188,500 42 2014003583 ---------- 9320 W VAN PL Active 12/2/2014 Listing $182,900 52 201307467 ---------- 11079 MAJOR OAK DR Sold 5/21/2013 9/4/2013 10/7/2013 201317772 ---------- 554 LONITA ST Sold 12/18/2013 1/16/2014 2/25/2014 Sale $189,900 29 2015000225 ---------- 11139 MAJOR OAK DR Active 1/7/2015 Listing $182,000 16 201408378 ---------- 1024 CORA DR Sold 6/17/2014 7/11/2014 8/21/2014 Sale $179,900 24 201401966 ---------- 12321 SHERBROOK Sold 2/16/2014 6/24/2014 7/30/2014 Sale $193,000 128 201409330 ---------- 475 KAY DR Sold 7/1/2014 Listing $177,900 22 9/12/2014 Sale $177,900 73 201211668 ---------- 765 ELIZABETH DR Sold 8/14/2012 3/29/2013 5/31/2013 201300722 ---------- 13317 E PARNELL AVE Sold 1/15/2013 1/15/2013 1/28/2013
- 31. 1004MC Trend Worksheet (6/22) Form SCNLTR - "TOTAL" appraisal software by a la mode, inc. - 1-800-ALAMODE Created with Dynamo MC - www.DynamoAppraiser.com - © 2013-2015 Prior 7 - 12 Months Prior 4 - 6 Months Current - 3 Months 1/23/2014 - 7/22/2014 7/23/2014 - 10/22/2014 10/23/2014 - 1/23/2015 MLS # ---------- Address Status Listed Used As Price DOM Price DOM Price DOM Pended Closed Inactivated 201312671 ---------- 12555 WARWICK AVE Sold 8/27/2013 9/23/2013 10/1/2013 201301238 ---------- 12754 E GLENHAVEN DR Sold 1/25/2013 2/19/2013 3/28/2013 201309650 ---------- 11776 GLENHAVEN DR Sold 7/1/2013 11/6/2013 12/2/2013 201315898 ---------- 547 WOODCLIFF DR Sold 10/31/2013 5/4/2014 9/5/2014 Sale $179,900 185 201404742 ---------- 10151 GRANDEUR DR Sold 4/9/2014 4/16/2014 5/9/2014 Sale $179,900 7 201412331 ---------- 12265 PARKWOOD DR Active 8/26/2014 Listing $179,900 58 $179,900 150 2014002063 ---------- 12550 E MILLBURN AVE Active 11/4/2014 Listing $179,900 80 2015000829 ---------- 632 SUMMIT RIDGE DR Active 1/21/2015 Listing $179,900 2 201207797 ---------- 1302 BRAEBURN DR Sold 6/3/2012 4/13/2013 5/15/2013 2014003120 ---------- 12318 FAIRHAVEN AVE Active 12/2/2014 Listing $178,500 52
- 32. 1004MC Trend Worksheet (7/22) Form SCNLTR - "TOTAL" appraisal software by a la mode, inc. - 1-800-ALAMODE Created with Dynamo MC - www.DynamoAppraiser.com - © 2013-2015 Prior 7 - 12 Months Prior 4 - 6 Months Current - 3 Months 1/23/2014 - 7/22/2014 7/23/2014 - 10/22/2014 10/23/2014 - 1/23/2015 MLS # ---------- Address Status Listed Used As Price DOM Price DOM Price DOM Pended Closed Inactivated 201406923 ---------- 1542 W BELLRIDGE DR Sold 5/20/2014 6/24/2014 8/7/2014 Sale $185,000 35 201412940 ---------- 9443 CAMMY AVE Sold 9/8/2014 10/7/2014 11/24/2014 Sale $176,000 29 201303563 ---------- 12267 E SHERATON AVE Sold 3/11/2013 3/31/2013 4/26/2013 201406074 ---------- 9060 MEADOWOOD Sold 5/2/2014 5/5/2014 6/17/2014 Sale $175,000 3 201408498 ---------- 10565 GOODWOOD BLVD Sold 6/17/2014 7/1/2014 8/29/2014 Sale $179,900 14 201409077 ---------- 11750 PARKWOOD DR Active 6/25/2014 Listing $174,900 28 $174,900 120 $174,900 212 201413045 ---------- 11636 MOLLYLEA DR Active 9/11/2014 Listing $174,900 42 $174,900 134 2014002064 ---------- 10962 BURTON AVE Pending 10/31/2014 1/7/2015 201410482 ---------- 12685 PARNELL AVE Sold 7/21/2014 Listing $172,900 2 9/25/2014 11/7/2014 Sale $172,900 66 201402310 ---------- 1079 S TINLEY DR Sold 2/24/2014 3/7/2014 4/1/2014 Sale $174,900 11
- 33. 1004MC Trend Worksheet (8/22) Form SCNLTR - "TOTAL" appraisal software by a la mode, inc. - 1-800-ALAMODE Created with Dynamo MC - www.DynamoAppraiser.com - © 2013-2015 Prior 7 - 12 Months Prior 4 - 6 Months Current - 3 Months 1/23/2014 - 7/22/2014 7/23/2014 - 10/22/2014 10/23/2014 - 1/23/2015 MLS # ---------- Address Status Listed Used As Price DOM Price DOM Price DOM Pended Closed Inactivated 201316146 ---------- 428 GLENWILD DR Sold 11/5/2013 1/5/2014 2/7/2014 Sale $169,900 61 201405395 ---------- 12290 QUEENSBURY AVE Sold 4/22/2014 5/5/2014 6/2/2014 Sale $169,900 13 201407022 ---------- 9336 S RIVEROAKS DR Active 5/7/2014 Listing $169,900 77 $169,900 169 $169,900 261 2015000561 ---------- 513 OAKFORD DR Active 1/7/2015 Listing $169,900 16 201310644 ---------- 556 GLENWILD DR Sold 7/18/2013 7/20/2013 8/30/2013 201315450 ---------- 13640 LEIGHWOOD AVE Sold 10/17/2013 1/30/2014 2/10/2014 Sale $169,000 105 201403631 ---------- 13326 BERWICK AVE Sold 3/23/2014 5/14/2014 5/30/2014 Sale $164,500 52 201405288 ---------- 10988 BELLARBOR DR Active 4/21/2014 Listing $169,000 93 $169,000 185 $169,000 277 201316823 ---------- 792 HAVENWOOD DR Sold 11/20/2013 12/13/2013 1/3/2014 201404768 ---------- 1820 S WOODHAVEN ST Sold 4/9/2014 4/25/2014 5/12/2014 Sale $171,900 16
- 34. 1004MC Trend Worksheet (9/22) Form SCNLTR - "TOTAL" appraisal software by a la mode, inc. - 1-800-ALAMODE Created with Dynamo MC - www.DynamoAppraiser.com - © 2013-2015 Prior 7 - 12 Months Prior 4 - 6 Months Current - 3 Months 1/23/2014 - 7/22/2014 7/23/2014 - 10/22/2014 10/23/2014 - 1/23/2015 MLS # ---------- Address Status Listed Used As Price DOM Price DOM Price DOM Pended Closed Inactivated 201406606 ---------- 10448 CLASSIQUE AVE Sold 5/13/2014 7/17/2014 8/27/2014 Sale $179,999 65 201413011 ---------- 10206 RHAPSODY DR Sold 9/10/2014 9/19/2014 10/27/2014 Sale $179,900 9 2014001139 ---------- 12378 FAIRHAVEN DR Pending 10/10/2014 Listing $167,900 13 1/8/2015 201310143 ---------- 1125 BRAEBURN DR Sold 7/9/2013 7/17/2013 7/26/2013 201403456 ---------- 11085 CHARINGTON AVE Sold 3/18/2014 4/22/2014 5/23/2014 Sale $169,900 35 2014002135 ---------- 11163 MAJOR OAK DR Active 11/5/2014 Listing $166,980 79 201405190 ---------- 11520 MOLLYLEA DR Sold 4/15/2014 7/10/2014 8/29/2014 Sale $168,500 86 201411109 ---------- 513 PEBBLEBROOK DR Sold 8/2/2014 9/10/2014 10/30/2014 Sale $169,900 39 201209255 ---------- 555 N PARKVIEW PLACE Sold 6/29/2012 1/28/2013 3/8/2013 201303025 ---------- 1322 MARILYN DR Sold 3/1/2013 5/10/2013 6/10/2013
- 35. 1004MC Trend Worksheet (10/22) Form SCNLTR - "TOTAL" appraisal software by a la mode, inc. - 1-800-ALAMODE Created with Dynamo MC - www.DynamoAppraiser.com - © 2013-2015 Prior 7 - 12 Months Prior 4 - 6 Months Current - 3 Months 1/23/2014 - 7/22/2014 7/23/2014 - 10/22/2014 10/23/2014 - 1/23/2015 MLS # ---------- Address Status Listed Used As Price DOM Price DOM Price DOM Pended Closed Inactivated 201305324 ---------- 9925 S RIVEROAKS DR Sold 4/10/2013 7/18/2013 8/26/2013 201306507 ---------- 9722 MOLLYLEA DR Sold 4/25/2013 5/14/2013 6/3/2013 201405636 ---------- 822 TRAMMELL DR Sold 4/26/2014 Listing $169,900 88 8/10/2014 10/23/2014 Sale $169,900 106 201406193 ---------- 1474 S ELAINE DR Sold 5/5/2014 5/10/2014 6/26/2014 Sale $165,000 5 201410797 ---------- 10401 CLASSIQUE AVE Sold 7/28/2014 Listing $174,900 87 12/4/2014 12/8/2014 Sale $174,900 129 2014000042 ---------- 424 PEBBLEBROOK DR Sold 9/15/2014 Listing $175,000 38 11/11/2014 11/25/2014 Sale $175,000 57 2014001962 ---------- 9465 SOUTHMOOR DR Pending 10/29/2014 1/5/2015 2015000788 ---------- 1235 MELANIE ST Active 1/20/2015 Listing $165,000 3 201311131 ---------- 861 SINCLAIR DR Sold 7/26/2013 9/13/2013 10/16/2013 201407565 ---------- 11530 PARKWOOD DR Active 6/2/2014 Listing $164,500 51 $164,500 143 $164,500 235
- 36. 1004MC Trend Worksheet (11/22) Form SCNLTR - "TOTAL" appraisal software by a la mode, inc. - 1-800-ALAMODE Created with Dynamo MC - www.DynamoAppraiser.com - © 2013-2015 Prior 7 - 12 Months Prior 4 - 6 Months Current - 3 Months 1/23/2014 - 7/22/2014 7/23/2014 - 10/22/2014 10/23/2014 - 1/23/2015 MLS # ---------- Address Status Listed Used As Price DOM Price DOM Price DOM Pended Closed Inactivated 201302467 ---------- 10565 GOODWOOD BLVD Sold 2/19/2013 3/6/2013 5/1/2013 201303401 ---------- 9320 W VAN Sold 3/6/2013 2/11/2014 3/19/2014 Sale $169,900 342 201401018 ---------- 10659 RONDO AVE Sold 1/24/2014 1/31/2014 2/14/2014 Sale $171,500 7 201306784 ---------- 663 N PARKVIEW PLACE Sold 5/7/2013 6/13/2013 7/19/2013 201315103 ---------- 13244 BERWICK AVE Sold 10/14/2013 3/16/2014 4/25/2014 Sale $163,900 153 201317559 ---------- 12342 MOLLYLEA DR Sold 12/11/2013 2/2/2014 4/30/2014 Sale $162,000 53 2015000041 ---------- 9727 N PARKVIEW DR Active 12/31/2014 Listing $162,000 23 201316624 ---------- 11147 MAJOR OAK DR Sold 11/13/2013 11/15/2013 11/15/2013 201401519 ---------- 10114 S RIVEROAKS DR Sold 2/4/2014 2/20/2014 3/21/2014 Sale $165,000 16 201203366 ---------- 12562 SHERBROOK Sold 3/6/2012 2/2/2013 3/15/2013
- 37. 1004MC Trend Worksheet (12/22) Form SCNLTR - "TOTAL" appraisal software by a la mode, inc. - 1-800-ALAMODE Created with Dynamo MC - www.DynamoAppraiser.com - © 2013-2015 Prior 7 - 12 Months Prior 4 - 6 Months Current - 3 Months 1/23/2014 - 7/22/2014 7/23/2014 - 10/22/2014 10/23/2014 - 1/23/2015 MLS # ---------- Address Status Listed Used As Price DOM Price DOM Price DOM Pended Closed Inactivated 201304309 ---------- 1658 S ELAINE DR Sold 3/19/2013 4/15/2013 5/24/2013 201304500 ---------- 10966 SHERATON DR Sold 3/26/2013 4/1/2013 5/13/2013 201207700 ---------- 418 N BROADMOOR CIR Sold 5/31/2012 4/18/2013 6/21/2013 201214474 ---------- 9343 MEREDITH DR Sold 10/17/2012 7/25/2013 8/30/2013 201300587 ---------- 10458 CLASSIQUE AVE Sold 1/12/2013 1/12/2013 3/14/2013 201301612 ---------- 254 KIRKLEY PL W Sold 1/30/2013 3/31/2013 5/3/2013 201303896 ---------- 644 S BURGESS DR Sold 3/14/2013 8/2/2013 10/21/2013 201309368 ---------- 12230 MOLLYLEA DR Sold 6/24/2013 9/19/2013 9/20/2013 201311951 ---------- 12272 GOODWOOD BLVD Sold 8/12/2013 10/30/2013 12/20/2013 2014000276 ---------- 277 E KIRKLEY PL Sold 9/21/2014 9/28/2014 11/10/2014 Sale $164,900 7
- 38. 1004MC Trend Worksheet (13/22) Form SCNLTR - "TOTAL" appraisal software by a la mode, inc. - 1-800-ALAMODE Created with Dynamo MC - www.DynamoAppraiser.com - © 2013-2015 Prior 7 - 12 Months Prior 4 - 6 Months Current - 3 Months 1/23/2014 - 7/22/2014 7/23/2014 - 10/22/2014 10/23/2014 - 1/23/2015 MLS # ---------- Address Status Listed Used As Price DOM Price DOM Price DOM Pended Closed Inactivated 2015000300 ---------- 9653 MOLLYLEA DR Active 1/6/2015 Listing $160,000 17 201411809 ---------- 11625 MOLLYLEA DR Sold 8/16/2014 10/22/2014 11/24/2014 Sale $159,900 67 2014002152 ---------- 424 WILTON DR Active 11/3/2014 Listing $159,900 81 2014003646 ---------- 459 KAY DR Active 12/16/2014 Listing $159,900 38 201411440 ---------- 378 WILTON DR Sold 8/8/2014 Listing $159,800 76 11/20/2014 1/9/2015 Sale $159,800 104 201216779 ---------- 12340 SHERBROOK Sold 12/12/2012 1/4/2013 1/31/2013 201315894 ---------- 433 LITTLE JOHN DR Sold 10/31/2013 3/24/2014 4/29/2014 Sale $164,900 144 201409794 ---------- 1905 STONEGATE CT Sold 7/10/2014 Listing $164,900 13 9/12/2014 Sale $164,900 64 201403696 ---------- 1333 CAROLYN SUE DR Sold 3/25/2014 3/27/2014 5/9/2014 Sale $159,900 2 2015000867 ---------- 12445 MOLLYLEA DR Active 1/21/2015 Listing $155,900 2
- 39. 1004MC Trend Worksheet (14/22) Form SCNLTR - "TOTAL" appraisal software by a la mode, inc. - 1-800-ALAMODE Created with Dynamo MC - www.DynamoAppraiser.com - © 2013-2015 Prior 7 - 12 Months Prior 4 - 6 Months Current - 3 Months 1/23/2014 - 7/22/2014 7/23/2014 - 10/22/2014 10/23/2014 - 1/23/2015 MLS # ---------- Address Status Listed Used As Price DOM Price DOM Price DOM Pended Closed Inactivated 201308067 ---------- 542 TRAMMELL DR Sold 6/3/2013 7/22/2013 8/23/2013 201410465 ---------- 1850 WIMPOLE ST Sold 7/21/2014 Listing $161,000 2 $161,000 94 12/12/2014 1/15/2015 Sale $161,000 144 201214369 ---------- 986 MARLBROOK DR Sold 10/15/2012 12/9/2012 3/8/2013 201215589 ---------- 1076 HAVENWOOD DR Sold 11/12/2012 5/16/2013 7/10/2013 201300854 ---------- 9669 JUDI AVE Sold 1/17/2013 1/28/2013 2/28/2013 201304742 ---------- 12666 E GLENHAVEN DR Sold 4/1/2013 4/5/2013 5/1/2013 201314861 ---------- 9024 S PARKVIEW DR Sold 10/9/2013 3/6/2014 3/28/2014 Sale $159,900 148 201404879 ---------- 12454 BROOKSHIRE AVE Sold 4/11/2014 Listing $169,900 103 8/4/2014 8/21/2014 Sale $169,900 115 201407421 ---------- 10624 SHERMOOR DR Sold 5/29/2014 5/29/2014 5/29/2014 Sale $155,000 0 201411315 ---------- 11640 PARKWOOD DR Active 8/5/2014 Listing $155,000 79 $155,000 171
- 40. 1004MC Trend Worksheet (15/22) Form SCNLTR - "TOTAL" appraisal software by a la mode, inc. - 1-800-ALAMODE Created with Dynamo MC - www.DynamoAppraiser.com - © 2013-2015 Prior 7 - 12 Months Prior 4 - 6 Months Current - 3 Months 1/23/2014 - 7/22/2014 7/23/2014 - 10/22/2014 10/23/2014 - 1/23/2015 MLS # ---------- Address Status Listed Used As Price DOM Price DOM Price DOM Pended Closed Inactivated 2014002865 ---------- 404 WILTON DR Sold 11/22/2014 12/10/2014 12/15/2015 201400632 ---------- 11488 GOODWOOD BLVD Sold 1/15/2014 2/28/2014 3/28/2014 Sale $154,900 44 201410712 ---------- 13907 KATHERINE AVE Sold 7/25/2014 7/25/2014 9/8/2014 Sale $154,900 0 201315821 ---------- 10018 MOLLYLEA DR Sold 10/1/2013 8/30/2013 10/28/2013 201401979 ---------- 13373 BERWICK AVE Sold 2/17/2014 Listing $158,000 156 $158,000 248 12/15/2014 1/14/2015 Sale $158,000 301 2014000778 ---------- 1604 CORA DR Sold 9/26/2014 Listing $162,000 27 11/3/2014 12/5/2014 Sale $162,000 38 201304855 ---------- 11625 ARCHERY DR Sold 4/2/2013 7/18/2013 8/16/2013 201404736 ---------- 9555 DAMUTH DR Sold 4/9/2014 5/5/2014 6/19/2014 Sale $153,000 26 2014002495 ---------- 11047 MAJOR OAK DR Active 11/14/2014 Listing $153,000 70 201314238 ---------- 1852 S WOODHAVEN DR Sold 9/26/2013 10/21/2013 12/4/2013
- 41. 1004MC Trend Worksheet (16/22) Form SCNLTR - "TOTAL" appraisal software by a la mode, inc. - 1-800-ALAMODE Created with Dynamo MC - www.DynamoAppraiser.com - © 2013-2015 Prior 7 - 12 Months Prior 4 - 6 Months Current - 3 Months 1/23/2014 - 7/22/2014 7/23/2014 - 10/22/2014 10/23/2014 - 1/23/2015 MLS # ---------- Address Status Listed Used As Price DOM Price DOM Price DOM Pended Closed Inactivated 201404874 ---------- 12682 SHERBROOK Sold 4/10/2014 6/12/2014 8/8/2014 Sale $154,900 63 201408841 ---------- 12445 ARCHERY DR Sold 6/22/2014 Listing $179,900 31 9/15/2014 10/24/2014 Sale $179,900 85 2014003589 ---------- 12738 LOCKHAVEN AVE Active 12/15/2014 Listing $150,900 39 201213172 ---------- 12235 PARKWOOD AVE Sold 9/15/2012 3/14/2013 4/30/2013 201217037 ---------- 11016 GOODWOOD BLVD Sold 12/20/2012 1/10/2014 2/12/2014 Sale $154,900 386 201302079 ---------- 765 MARILYN DR Sold 2/8/2013 4/25/2013 5/30/2013 201306590 ---------- 1244 MARILYN DR Sold 5/2/2013 1/15/2014 1/22/2014 201316734 ---------- 9423 CAMMY AVE Sold 11/18/2013 12/6/2013 2/26/2014 Sale $144,900 18 201212036 ---------- 1823 S WOODHAVEN DR Sold 8/24/2012 12/3/2012 2/1/2013 201302536 ---------- 9925 MIRAFLORES DR Sold 2/20/2013 3/25/2013 5/3/2013
- 42. 1004MC Trend Worksheet (17/22) Form SCNLTR - "TOTAL" appraisal software by a la mode, inc. - 1-800-ALAMODE Created with Dynamo MC - www.DynamoAppraiser.com - © 2013-2015 Prior 7 - 12 Months Prior 4 - 6 Months Current - 3 Months 1/23/2014 - 7/22/2014 7/23/2014 - 10/22/2014 10/23/2014 - 1/23/2015 MLS # ---------- Address Status Listed Used As Price DOM Price DOM Price DOM Pended Closed Inactivated 201401330 ---------- 10620 FERNCLIFF AVE Sold 2/1/2014 6/15/2014 7/31/2014 Sale $155,000 134 201413132 ---------- 9449 MOLLYLEA DR Active 9/12/2014 Listing $149,000 41 $149,000 133 201316140 ---------- 1819 S WOODHAVEN DR Sold 11/1/2013 6/7/2014 6/27/2014 Sale $155,900 218 201217058 ---------- 12723 PARNELL AVE Sold 12/19/2012 3/12/2013 5/10/2013 2014001513 ---------- 445 N PARKVIEW PLACE Sold 10/20/2014 Listing $149,500 3 11/25/2014 12/23/2014 Sale $149,500 36 201408196 ---------- 814 DONCASTER DR Sold 6/11/2014 7/3/2014 8/11/2014 Sale $159,900 22 201212163 ---------- 9376 GREENBRIAR DR Sold 8/27/2012 2/15/2013 3/28/2013 201313524 ---------- 925 E RIVEROAKS DR Sold 9/12/2013 6/11/2014 6/27/2014 Sale $149,900 272 201206693 ---------- 703 SHARP RD Sold 5/7/2012 1/27/2013 2/28/2013 201313248 ---------- 11840 MOLLYLEA DR Sold 9/6/2013 12/2/2013 12/26/2013
- 43. 1004MC Trend Worksheet (18/22) Form SCNLTR - "TOTAL" appraisal software by a la mode, inc. - 1-800-ALAMODE Created with Dynamo MC - www.DynamoAppraiser.com - © 2013-2015 Prior 7 - 12 Months Prior 4 - 6 Months Current - 3 Months 1/23/2014 - 7/22/2014 7/23/2014 - 10/22/2014 10/23/2014 - 1/23/2015 MLS # ---------- Address Status Listed Used As Price DOM Price DOM Price DOM Pended Closed Inactivated 201316363 ---------- 13232 BERWICK AVE Sold 11/9/2013 4/23/2014 6/23/2014 Sale $149,500 165 201400173 ---------- 11250 GLENHAVEN DR Sold 1/6/2014 6/25/2014 7/17/2014 Sale $149,900 170 201401754 ---------- 327 KIRKLEY PL W Sold 2/11/2014 6/30/2014 8/5/2014 Sale $145,000 139 2014000170 ---------- 10968 WAVERLAND DR Sold 9/18/2014 10/13/2014 11/3/2014 Sale $147,500 25 2014000264 ---------- 10921 WORTHINGTON AVE Pending 9/17/2014 Listing $145,000 36 12/22/2014 2014001453 ---------- 530 E RIVEROAKS DR Active 10/17/2014 Listing $145,000 6 $145,000 98 201400665 ---------- 13228 AVANTS AVE Sold 1/16/2014 4/21/2014 5/30/2014 Sale $155,000 95 201206083 ---------- 12080 ARCHERY DR Sold 5/1/2012 11/7/2012 2/7/2013 201308948 ---------- 10921 W ROBIN HOOD DR Sold 6/19/2013 8/14/2013 9/13/2013 201213995 ---------- 10928 BURTON AVE Sold 10/9/2012 1/3/2013 2/22/2013
- 44. 1004MC Trend Worksheet (19/22) Form SCNLTR - "TOTAL" appraisal software by a la mode, inc. - 1-800-ALAMODE Created with Dynamo MC - www.DynamoAppraiser.com - © 2013-2015 Prior 7 - 12 Months Prior 4 - 6 Months Current - 3 Months 1/23/2014 - 7/22/2014 7/23/2014 - 10/22/2014 10/23/2014 - 1/23/2015 MLS # ---------- Address Status Listed Used As Price DOM Price DOM Price DOM Pended Closed Inactivated 201409248 ---------- 777 S BURGESS DR Active 7/1/2014 Listing $142,800 22 $142,800 114 $142,800 206 201306747 ---------- 9524 MEREDITH DR Sold 4/24/2013 7/20/2013 8/16/2013 201312551 ---------- 1864 BELLROSE DR Sold 8/23/2013 9/20/2013 10/9/2013 201314122 ---------- 923 S TINLEY DR Sold 9/24/2013 10/31/2013 12/6/2013 2014002553 ---------- 1085 BRAEBURN DR Sold 11/16/2014 12/19/2014 1/20/2015 Sale $144,500 33 201405990 ---------- 309 LITTLE JOHN DR Sold 5/2/2014 5/21/2014 5/23/2014 Sale $150,000 19 201202236 ---------- 9285 N PARKVIEW Sold 2/14/2012 3/22/2013 5/28/2013 201409332 ---------- 10822 WAVERLAND DR Pending 7/1/2014 Listing $139,900 22 $139,900 114 1/7/2015 201301147 ---------- 11755 GLENHAVEN DR Sold 1/24/2013 3/18/2013 4/16/2013 201303142 ---------- 10925 SHERATON DR Sold 3/3/2013 3/27/2013 5/2/2013
- 45. 1004MC Trend Worksheet (20/22) Form SCNLTR - "TOTAL" appraisal software by a la mode, inc. - 1-800-ALAMODE Created with Dynamo MC - www.DynamoAppraiser.com - © 2013-2015 Prior 7 - 12 Months Prior 4 - 6 Months Current - 3 Months 1/23/2014 - 7/22/2014 7/23/2014 - 10/22/2014 10/23/2014 - 1/23/2015 MLS # ---------- Address Status Listed Used As Price DOM Price DOM Price DOM Pended Closed Inactivated 201313530 ---------- 12362 MOLLYLEA DR Sold 9/12/2013 3/19/2014 5/8/2014 Sale $137,000 188 201208730 ---------- 661 VOOHRIES DR Sold 6/20/2012 2/17/2013 4/15/2013 201401624 ---------- 13814 KATHERINE AVE Pending 2/3/2014 Listing $135,000 170 $135,000 262 11/12/2014 201212632 ---------- 8974 MEADOWOOD Sold 9/10/2012 12/10/2012 2/5/2013 201406188 ---------- 380 NASSAU DR Sold 5/7/2014 Listing $134,900 77 7/28/2014 8/29/2014 Sale $134,900 82 201312971 ---------- 12285 ARCHERY DR Sold 9/1/2013 11/12/2013 1/17/2014 201301191 ---------- 960 E RIVEROAKS DR Sold 1/25/2013 3/8/2013 4/12/2013 201306957 ---------- 9878 MIRAFLORES DR Sold 5/11/2013 6/28/2013 10/18/2013 201216590 ---------- 1021 BRAEBURN DR Sold 12/10/2012 8/5/2013 10/30/2013 201309914 ---------- 545 CORA DR Sold 7/5/2013 7/5/2013 7/5/2013
- 46. 1004MC Trend Worksheet (21/22) Form SCNLTR - "TOTAL" appraisal software by a la mode, inc. - 1-800-ALAMODE Created with Dynamo MC - www.DynamoAppraiser.com - © 2013-2015 Prior 7 - 12 Months Prior 4 - 6 Months Current - 3 Months 1/23/2014 - 7/22/2014 7/23/2014 - 10/22/2014 10/23/2014 - 1/23/2015 MLS # ---------- Address Status Listed Used As Price DOM Price DOM Price DOM Pended Closed Inactivated 201314703 ---------- 350 NASSAU DR Sold 10/6/2013 10/8/2013 11/23/2013 201406675 ---------- 277 BROADMOOR AVE Sold 4/28/2014 4/29/2014 5/8/2014 Sale $130,000 1 201304598 ---------- 13268 ARLINGFORD AVE Sold 3/25/2013 7/27/2013 9/30/2013 201308350 ---------- 1447 STOKLEY PL Sold 6/6/2013 8/1/2013 10/8/2013 201302001 ---------- 526 GLENWILD DR Sold 2/7/2013 3/27/2013 6/12/2013 201314407 ---------- 9087 REDBUD AVE Sold 9/30/2013 10/7/2013 11/15/2013 201215561 ---------- 12842 ARLINGFORD AVE Sold 11/10/2012 4/5/2013 6/28/2013 201216126 ---------- 9060 FLORIDA BLVD Sold 11/26/2012 1/30/2013 2/26/2013 201402568 ---------- 10969 MAJOR OAK DR Sold 2/28/2014 5/30/2014 6/16/2014 Sale $139,900 91 201211281 ---------- 458 KAY DR Sold 8/8/2012 1/18/2013 2/14/2013
- 47. 1004MC Trend Worksheet (22/22) Form SCNLTR - "TOTAL" appraisal software by a la mode, inc. - 1-800-ALAMODE Created with Dynamo MC - www.DynamoAppraiser.com - © 2013-2015 Prior 7 - 12 Months Prior 4 - 6 Months Current - 3 Months 1/23/2014 - 7/22/2014 7/23/2014 - 10/22/2014 10/23/2014 - 1/23/2015 MLS # ---------- Address Status Listed Used As Price DOM Price DOM Price DOM Pended Closed Inactivated 201308508 ---------- 12351 ARCHERY DR Sold 6/11/2013 7/2/2013 8/15/2013 201217158 ---------- 859 TIFTON DR Sold 12/25/2012 5/6/2013 8/16/2013 201406209 ---------- 10135 GRANDEUR DR Sold 5/7/2014 Listing $119,700 77 9/10/2014 10/28/2014 Sale $119,700 126 201301409 ---------- 12625 E SHERATON AVE Sold 12/18/2012 12/18/2012 1/24/2013 201312826 ---------- 11733 PARKWOOD DR Sold 8/28/2013 9/25/2013 10/16/2013 201407599 ---------- 840 DARTMOOR DR Sold 6/2/2014 Listing $124,900 51 7/29/2014 9/30/2014 Sale $124,900 57 201408611 ---------- 12471 PARKWOOD DR Sold 6/18/2014 Listing $129,900 35 9/15/2014 10/10/2014 Sale $129,900 89 201408760 ---------- 12461 PARKWOOD AVE Sold 6/23/2014 Listing $140,000 30 $140,000 122 12/16/2014 1/5/2015 Sale $140,000 176 2014003079 ---------- 1302 S FLANNERY RD Pending 12/1/2014 12/5/2014