Download as PDF, PPTX

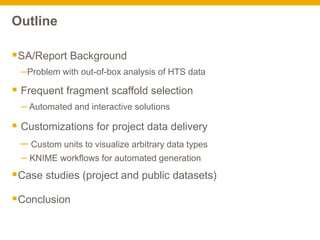
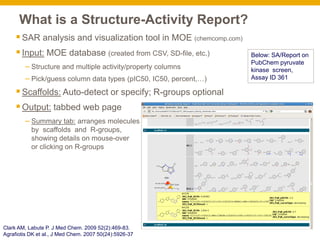


The document outlines the development and application of a structure-activity report (SAR) analysis tool for high-throughput screening (HTS) data, aimed at identifying viable chemical series and enhancing user-friendly data visualization. It addresses challenges in scaffold selection, proposing automated and interactive solutions, and customizations for project-specific data. Case studies illustrate the tool's effectiveness in analyzing diverse datasets and generating intuitive reports for chemical property visualization.