

Recommended
More Related Content
What's hot
What's hot (20)
Similar to Dynamic asset allocation strategy
Similar to Dynamic asset allocation strategy (20)
More from Rifat Ahsan
More from Rifat Ahsan (20)
Recently uploaded
Recently uploaded (20)
Dynamic asset allocation strategy
- 1. 1 Department of Finance, University of Dhaka Report on Portfolio Management: Dynamic Asset Allocation Strategy Submitted to Dr. Mahmood Osman Imam, FCMA Professor Department of Finance University of Dhaka Course Name: Financial Derivatives Course Code: F- 503 Submitted by Md. Monjurul Ahsan Id No: 19-099 (BBA) 20-376 (MBA) Section-A MBA 20th Batch Department of Finance University of Dhaka Date of Submission: 30-01-2019
- 2. 2 Letter of Transmittal January 30, 2019 To Dr. Mahmood Osman Imam Professor Department of Finance University of Dhaka Sir, Here is the report of the group term paper that you assigned us to work on “Portfolio Management: Dynamic Asset Allocation Strategy” fixing the date of submission on January 30, 2019. The topic that you have given us is really an important & interesting fact for the finance students in acquiring practical orientation of dynamic asset allocation strategy. We thank you for choosing us for working on this topic. Yours sincerely ………………………………… Md. Monjurul Ahsan ID: 19-099 (BBA) 20-376 (MBA) Section-A 20th Batch Department of Finance University of Dhaka
- 3. 3 Acknowledgement I express my thanks to our dear course teacher Dr. Mahmood Osman Imam for assigning me the report dealing with dynamic asset allocation strategy. The presentation of this report is of a great expectation in our MBA program and I am quite happy to submit it dully applying that I think should have to be included. Theoretical knowledge is valued when it is successfully applied in practical scenario. In this respect I found this report a great opportunity to deal with some knowledge about dynamic asset allocation strategy. So lastly I would again like to express our heartfelt thanks to our course teacher for providing the theoretical knowledge and valuable guidelines related to the topic assigned.
- 4. 4 Executive Summary Portfolio insurance is a dynamic trading strategy designed to protect a portfolio from market declines while preserving the opportunity to participate in market advances. Several portfolio insurance methods exist and are used in practice. The best-known strategy involves trading in “real” and /or “synthetic” options. With the introduction of exchange-traded index put options, it seemed theoretically possible for an investor to use these contracts to insure well-diversified portfolios, especially index funds. For some reasons, most investors prefer not to use the option market for insuring the portfolios. Hence it calls for the dynamic trading strategy replicating the option strategy to insure the portfolio. In this strategy, the manager replicates an option through a process of continually revising, in a prescribed manner, the proportions of a portfolio consisting of the underlying the asset and the riskless asset. Besides the complex nature of the underlying option pricing theory, the dynamic strategy calls for buying more stock when the market is going up and selling off some stock as the market goes down. In this report there is thorough analysis of the economy, industry and selected companies in order to develop a well-diversified optimum portfolio of 10 stocks. The ten selected companies are from 10 different industries. The portfolio is constructed of Tk 10, 00,000 and in dynamic asset allocation. The proportions allocated to the underlying portfolio and the riskless asset change every period, so that the dynamic insurance strategy requires a significant amount of trading. As in Bangladesh there is no market for derivative securities, I assumed a hypothetical option market for this dynamic asset allocation strategy.
- 5. 5 Table of Contents Executive summary....................................................................................................................4 Introduction............................................................................................................................. -9 Asset Class Selection........................................................................................................ 17-18 Dynamic Asset Allocation Strategy.................................................................................. 19-23 5.1 Delta Calculation ................................................................................................... 23-24 5.2 Insured Portfolio ..........................................................................................................25 5.3 Put Option Dynamics.............................................................................................. 25-26 5.4 Call Option...................................................................................................................27 6. Dynamic Asset Allocation............................................................................................. 28-39 7. Comparison.................................................................................................................... 40-41 8.Conclusion ...........................................................................................................................42
- 6. 6 Introduction Origin of the report For the partial fulfillment of the study, our honorable course teacher, Dr. Mahmood Osman Imam assigned me to report on “Portfolio Management: Dynamic Asset Allocation Strategy”. To conduct the report at first I wanted to know the procedures of constructing the portfolios with given amount of initial investment which will provide knowledge about how insurance can be achieved. Background of the Report To the investor, insurance of portfolio is crucial. Options in the market of Bangladesh are not available, but we can replicate them to construct insured portfolio which will provide a certain return. Without dynamic asset allocation, there have been some strategies that don’t provide portfolio insurance though the return is higher, but, the investor is always at risk and risk-averse investors might not come in the market out of this scenario. Objective of the Report To be honest, the objective of the study is to fulfill the requirement of our course on International Business. Other objectives behind conducting this study are as follows: To enhance our practical knowledge To know how Dynamic asset allocation strategy works To acquire knowledge about the procedures constructing insured portfolio. To compare dynamic asset allocation strategy with other methods. To explore how portfolio insurance provides cushion to investors. Methodology To accomplish the task we take help from our text book, articles, Dhaka Stock Exchange, and different web sites. Limitation of the Report The major limitations encountered are as follows: Lack of adequate information Nonexistent options market in Bangladesh
- 7. 7 Lack of Experience Lack of adequate time relative to the volume of the report Limitation of Knowledge Dynamic Asset Allocation One of the active asset allocation strategies is dynamic asset allocation, with which one constantly adjust the mix of assets as markets rise and fall, and as the economy strengthens and weakens. With this strategy one sell assets that are declining and purchase assets that are increasing, making dynamic asset allocation the polar opposite of a constant-weighting strategy. For example, if the stock market is showing weakness, investors sell stocks in anticipation of further decreases; and if the market is strong, investors purchase stocks in anticipation of continued market gains. In this strategy, the manager replicates an option through continuously revising the proportions of a portfolio consisting of the underlying asset (stock/bond) and the riskless asset (bond/T-bill) to insure portfolio’s value. This strategy requires buying more stock when the market is going up and selling off some stock as the market goes down. The proportions allocated to the underlying risky asset & the riskless asset change every period, so this strategy requires a significant amount of trading. The number of units of the underlying risky asset that must be held long at any given moment will be given by the call option’s “Delta”. The amount of riskless asset to hold is determined by subtracting the value of the units held in the underlying asset from the total value of the insured portfolio. Many experts believe that what an investor buys or sells is more important than when he or she buys or sells it. This is the essence of asset allocation. Because many asset classes tend to rise and fall together, a portfolio’s overall return is much more affected by how the portfolio is allocated rather than the specific securities chosen. A well-known 1986 study by Brinson, Hood and Bee bower confirmed that 95% of the time, asset allocation determined a portfolio’s returns rather than the specific securities chosen. A dynamic asset allocation strategy is a mix of active and passive investing. On one hand the investor keeps a consistent, long-term asset allocation and does not alter that based on short-term market swings or stock fads. On the other hand, the investor buys and sells securities in his portfolio occasionally in order to keep the portfolio aligned with the original weightings.
- 8. 8 Merits of Dynamic Asset Allocation Strategy Often cheaper than active trading The strategy requires less in trading commissions and advisory fees. Reduced downside risk as investments are avoid on declining markets Better exploitation of changing economic scenarios and Benefit of diversification of investments. Disadvantages of Dynamic Asset Allocation Strategy The need of active management of portfolio Chance of loss because of wrong market interpretation and wrong investing decisions High risk when compared to strategic and tactical methods. Process of dynamic asset allocation There are some steps by which dynamic asset allocation strategy can be made successful. In a flow chart all the relevant step is given below: 1. Put Option Dynamics 2. Insured Portfolio Dynamics 3. Call Option Deltas 4. Asset Allocation
- 9. 9 1. Put option dynamics In this step all the put prices of each step have to be finding out from the strike prices. It helps to find out the deltas of call which is very much essential for constructing a new portfolio. 2. Insured portfolio dynamics The total value of risky and risk free investment will be combined which is known as insured portfolio. In each of the time period this amount will be find out. Basically it represents the new portfolio amount. 3. Call option delta To construct new portfolio call option delta helps very much. The difference between up and down movement stock price will be divided by the respective put option value difference to find out the delta value. 4. Asset allocation Due to the changes in call option delta value in each period asset allocation also changes. According to call option delta shares may be bought or sold out. If delta increases then some new risky shares have to buy and with the same amount risk free asset have to sell. On the other hand if delta decreases than the previous time step then some risky shares have to sell and with the same amount some risk free asset have to include. In each step risk free asset will be increased at the risk free rate. Through this way asset allocation has been done and new portfolio has been formed.
- 10. 10 Three Steps Analysis Economy Analysis: The economy of Bangladesh is a rapidly developing market-based economy. Its per capita income in 2018 was estimated to be US$ 1314 (adjusted by GDP Per Capita). According to the International Monetary Fund, Bangladesh ranked as the 44th largest economy in the world in 2018 in PPP terms and 57th largest in nominal terms, among the Next Eleven (N-11) of Goldman Sachs and D-8 economies, with a gross domestic product of US$306 billion in PPP terms and US$115.6 billion in nominal terms. Bangladesh's economy has grown roughly 6% per year since 1996 despite political instability, poor infrastructure, corruption, insufficient power supplies, slow implementation of economic reforms, and the 2008-09 global financial crisis and recession. Although more than half of GDP is generated through the service sector, almost half of Bangladeshis are employed in the agriculture sector with rice as the single-most-important product. Garment exports, the backbone of Bangladesh’s industrial sector and 80% of total exports, surpassed $21 billion last year, 18% of GDP. The sector has remained resilient in recent years amidst a series of factory accidents that have killed over 1,000 workers and crippling strikes that shut down virtually all economic activity. Steady garment export growth combined with remittances from overseas Bangladeshis, which totaled almost $15 billion and 13% of GDP IN 2018, are the largest contributors to Bangladesh’s current account surplus and record foreign exchange holdings. Textile industry: The textile and clothing (T&C) industries provide the single source of economic growth in Bangladesh's rapidly developing economy. Exports of textiles and garments are the principal source of foreign exchange earnings. Agriculture for domestic consumption is Bangladesh’s largest employment sector. By 2002 exports of textiles, clothing, and ready-made garments (RMG) accounted for 77% of Bangladesh’s total merchandise exports. By 2013, about 4 million people, mostly women, worked in Bangladesh's $19 billion-a-year industry, export-oriented ready-made garment (RMG) industry. Bangladesh is second only to China, the world's second-largest apparel exporter of western brands. Sixty percent of the export contracts of western brands are with European buyers and about forty percent with American buyers only 5% of textile factories are owned by foreign investors, with most of the production being controlled by local investors. As
- 11. 11 Textile industry is not reached its maturity stage yet investment in these industries will generate a good return for the investors and for this reason I have selected companies from these industries in the portfolio. Pharmaceutical industry: Pharmaceutical is the core of Bangladesh’s Healthcare sector, and serves as one of the most important manufacturing industry. With a history since 1950s, the industry has now turned one of the most successful pharmaceuticals manufacturing industry among the developing countries. Presently, the industry meets 97% of local demand and exports to more than 80 countries. The industry has been experiencing robust growth over the last few years. A local industry supporting drug policy and effective regulatory framework, along with TRIPS relaxations are the key reasons for success of the industry. As Pharmaceutical industry is in a growth stage in industry life cycle there is a probability of making better investment return in this industry. Cement Industry: Development of cement industry in Bangladesh dates back to the early-fifties but its growth in real sense started only about a decade. The country has been experiencing an upsurge in cement consumption for the last five years. Government gave permission for establishing cement industries in Bangladesh in FY1995. Initially the cement industry took place without the proper analysis of the demand and supply of cement in the country. Within the span of the two to three years, industry attained expanded capacity of the product with stable growth rate of consumption. Considering the “Life cycle of the industry‟, currently cement industry of Bangladesh is in the growth stage. Sales of cement are increasing due to an enormous demand for cement in both the local and foreign markets. The industry realized about 30% and 21% growth in 2009 and 2010 respectively after suppressed demand from previous years. Food and Allied Industry: The food processing industry in Bangladesh represents one of the major potential sectors within the industrial segments in terms of contribution to value addition and employment. The sector accounts for over 22% of all manufacturing production and employs about 20% of labor forces. All food processing enterprises account for 2% of the national GDP. The food processing sector
- 12. 12 includes processing of cereals, pulses & oilseeds, bakery & confectionary, fruits and vegetables, dairy, carbonated beverages and various other food items. Food industry is a rapidly growing sector in Bangladesh, employing a significant portion of the labor force in the country. Between 2004 and 2010, the food processing industry in Bangladesh grew at an average 7.7 percent per annum. Bangladesh Bureau of Statistics, in its 25006 Economic Census, reported that there were approximately 246 medium sized food processing industries employing 19 percent of the industrial manufacturing workforce in Bangladesh or 8 percent of the total manufacturing labor force. The industry employs 2.45 percent of the country's total labor force and its share in the GDP was 2.01 percent in 2010. There are also numerous small scale factories and domestic units engaged in food processing throughout the country. According to some industry analysts, the food processing sector in Bangladesh is a 4.5 Billion US Dollar industry. In 2010, Bangladesh exported over $700 million worth of processed food and beverages, over 60 percent of them were shrimp and fish products. Fuel and power industry: Electricity is a key ingredient for the socio-economic development of the country. The government has given top priority to development of the sector considering its importance in the overall development of the country. The government has set the goal of providing electricity to all citizens by 2021. Adequate and reliable supply of electricity is an important pre-requisite for attracting both domestic and foreign investment. As the power sector is a capital-intensive industry, huge investments are required in order to generate addition to the capacity. Competing demands on the government resources and declining levels of external assistance from multilateral and bilateral donor agencies constrained the potential for public investment in the power sector. Recognizing these trends, the government of Bangladesh amended its industrial policies to enable private investment in the power sector. Fuel & power industry are oligopolistic in nature. These two industries have been making a lot of profit. The current state of our power sector is very poor. So it has huge scope of growth. That’s why I included companies from this industry.
- 13. 13 Tannery industries: In Bangladesh the leather industry is well established and ranked fourth in terms of earning foreign exchange. In consideration of being a value added sector the (Government of Bangladesh (GoB), Ministry of Industry (MoI) has declared it as a priority sector. The leather products sector have huge opportunities in generating employment , entrepreneurship and investment by increasing export of higher value added products rather than finished leather and by utilizing locally made raw material (finished leather) to convert into more value added leather products (including footwear and other leather goods). Statistics prepared by Export Promotion Bureau of Bangladesh for the Financial Year 2011-12, the leather sector grew by 17.5 percent and earned $765 million in revenue. Of this $434.8 million was attributed from leather products, accounting for approximately 57 percent of the total revenue. The leather sector includes 220 tanneries, 3,500 MSMEs and 110 large firms2 of leather products controlling more than 90% of the export market. Most of the enterprise enterprises are located in Dhaka, followed by two big clusters at Bhairab and Chittagong . The sector generates direct and indirect employment for about 850,000 3 people, including a significant number of women particularly in the leather products industries. Banking industry: Banking sector of Bangladesh is one of the major sectors, which contributes significantly to the national economy. The sector comprises a number of banks in various categories such as: Nationalized Commercial Banks, Specialized Banks, Private Commercial Banks and Trans- National Banks. The Banking Industry of Bangladesh at present is in the growth stage. Almost every year new private banks are coming up, new branches are opening within two to three months, and new customers are coming to open an account in different banks. As a result, according to July 30, 2016 there are 6 nationalized commercial banks, 2 specialized banks, 40 local private commercial banks and 9 foreign commercial banks operating in this country. Moreover, as on July 30, 2016 there are 60,881,322 numbers of deposit accounts and 10,462,785 numbers of advance accounts in the banks.
- 14. 14 Nonbanking Financial Institution: Financial sector is the most important sector of any economy. Currently, 44 life and general insurance companies and 21 NBFIs listed in DSE. These two industries are the most consistent performer since many years. These are also in the growth stage, so they have very high future profit potentiality. Therefore investment in these industries will generate a good return for the investors and for this reason I have selected companies from these industries in the portfolio. Engineering Industry: The light engineering industry in Bangladesh continues to grow each year. This labor-intensive sector produces a diverse range of items, including import substitute machinery spares, plant machineries, small tools, toys, consumer items and paper products for the domestic market. Most of these enterprises are located in and around Dhaka metropolis. In the Export policy 2003-2006, the Government of Bangladesh had identified the following five sectors to have the High Priority: Light Engineering Products (including auto-parts and bi-cycles), Software & ICT products, Agro- products & Agro-processing products, Leather goods and High value-added readymade garments. Insurance Industry: However, though the global insurance market declined but Bangladesh has seen a significant growth over last year. Growth in the industrialized countries was -- 2.8% for life and -- 0.6% for non-life insurance, however, emerging markets grew at a rate of 4.2% for life and 2.9% for non- life insurance. Company Analysis: I have chosen 10 companies from those 10 industries. I tried to diversify as much as possible. As banking sector’s contribution was 7.4% and 4.49% according to February 12 and 11 of the total capital market I have taken two dominant and growing companies Islami Bank for portfolio construction. Textile industry comprises about 8.64% and 7.08% of capital market so I chose Square Textile which market share is almost 30% and making continuous profit and listed as A category share in DSE. Pharmaceutical also comprises 13.84% and 13.24% of overall market so I choose Square Pharma which is a growing multinational company operated in Bangladesh. From Tannery industries I choose Bata Shoe which is a market leader and growing firm. As both insurance and nonbanking finance institution comprises 4.77% and 3.72% of capital market I
- 15. 15 choose Prime insurance and Lanka Bangla Finance two renowned companies within their sector. From food and allied sector I choose Bangas for its growth opportunities and positive profit making and choose Padma oil from fuel and power sector which also comprises 16.25% of overall capital market. From engineering sector I have chosen Singer BD Limited. From Cement Industry I have chosen Heidelberg Cement which is a market leader in the cement industry and performing well. From insurance industry which comprises a good amount in market composition I have selected Prime Insurance. Table 1: Sector wise P/E ratio Sector name P/E Ratio Sector Cap Sector Earning Bank 11.03 411,798,451,840 40,197,073,552 Cement 38.83 53,862,493,722 2,487,445,101 Ceramics Sector 20.37 21,975,535,682 606,053,639 Engineering 15.85 116,693,607,327 5,152,146,890 Financial Institutions 25.36 90,953,609,789 8,074,706,542 Food & Allied 15.66 225,704,358,664 7,189,690,168 Fuel & Power 12.93 269,910,804,296 21,394,730,606 Insurance 16 90,235,000,147 4,491,202,611 IT Sector 17.41 3,610,643,261 207,435,341 Jute 2086.88 646,592,400 3,449,280 Miscellaneous 23.92 69,909,936,693 2,131,790,043 Paper & Printing 20.5 2,076,476,000 151,138,400 Pharmaceuticals & Chemicals 18.74 329,740,523,223 14,478,007,073 Services & Real Estate 18.38 20,058,576,564 547,189,254 Tannery Industries 25.70 25,934,584,533 1,009,161,308 Telecommunication 16.41 490,099,553,921 19,922,836,039 Textile 15.78 82,521,354,118 6,897,400,867 Travel & Leisure 20.29 27,130,328,960 1,601,240,261 We calculate P/E excluding : Z category. Shares of OTC. Shares which are not traded for a long time.
- 16. 16 Asset class selection Industries selected to make this portfolio: Bank NBFI Textile Food and allied Cement Fuel and power Telecommunication General Insurance Engineering Pharmaceuticals and Chemical I have selected these industries because of the growth rate of industries & diversification of risk. Selection Criteria of Assets: Criteria are followed to select individual security. These are: Listed in Dhaka Stock Exchange Listed before January 01, 2006 ‘A’ category share. Growth firm. Having significant market share on underlying sector.
- 17. 17 Selection of Individual Asset: The securities selected are as follows: Sector Company Bank AB Bank Textile APEX SPINNING & KNITTING MILLS LIMITED Engineering Aftab Automobiles Pharmaceuticals IBNSINA Pharmaceuticals Telecom GP NBFI Lankabangla Cement Lafarge Surma Cement Fuel and power Jamuna oil Ceramic RAK Ceramics Food & Allied BATBC Risk free asset selection: There may be 100% risk free asset or some combination of risky and risk free asset in the portfolio that’s why risk free asset should be determined. I have taken 91-day T-bill as the risk free asset for constructing new portfolio. The rate in each quarter has been used to calculate the growth of risk free asset. Data collection: Data have been collected from DSE stock and Bangladesh bank. The opening, closing .highest and lowest price of the shares has been taken from the daily share price statement. Dividend information also has taken from the exchanges. Risk free rate has been determined in quarter basis. Portfolio construction: Now after getting all the required information I have determined dividend adjusted price in each quarter. Then with considering the investment and situation I have determined the value of risky
- 18. 18 and risk free investment. In this case initial, higher, lower and closing values are multiplied by the respective number of shares. Then the total closing values have been distributed among the 10 companies equally. Again by following this strategy I have got the total closing values at the end of second quarter. After following this strategy, I have got all quarter’s total closing values. These values have been used as strike price. Put option values have been determined by considering either option will be exercised or not. If it will be exercised, then value of the put option will be zero otherwise the difference between stock price and strike price. With the help of stock price and put option value the call option delta has been calculated. Continuous compounding has been used in the growth of risk free asset. After determining cal option delta dynamic asset allocation has been formed for the equal weight of the both risky and risk free asset. So with the changes of the delta new portfolio has been formed by buying or selling risky or risk free asset. Through this I have got the insured portfolio value in each of the quarter end.
- 19. 19 Dynamic asset allocation strategy At first some assumption has been taken before constructing dynamic asset allocation. These are given below- Investment amount is 1000000 Tk. Initial distribution of total fund between Risky securities and T-bills is considered to be 50:50 The amount of investment in shares will be distributed among the 10 securities equally Continuous compounded risk free rate is assumed. Call and Put option strike prices are assumed 1080000 Tk. Now step by step dynamic asset allocation strategy is given below: Standard deviation determination All the closing prices of the company have been taken in daily basis. After this dividend also been adjusted after the record that. Return has been calculated through the log normal basis. And by giving the equal weight portfolio standard deviation for daily basis for every quarter have been calculated. In this case daily portfolio standard deviation has been converted into quarter through the following formula- Quarter portfolio standard deviation = daily standard deviation × √ number of days Based on this formula the following portfolio standard deviation has been gotten.
- 20. 20 Quarter 4 (2017) Quarter 1 (2018) Company ABBank Apex Spinning Aftab IBNSINA GP LankabanglaLafarge Jamunaoil RAK BATBC Weight 0.10 0.10 0.10 0.10 0.10 0.10 0.10 0.10 0.10 0.10 Sector Company Covariance Covariance Covariance Covariance Covariance Covariance Covariance Covariance Covariance Covariance Weight Bank ABBank 0.0005783 -0.0001137 -0.0000242 0.0000221 0.0004962 0.0007327 -0.0000373 -0.0001009 -0.0000189 0.0001501 0.10 Textile Apex Spinning -0.0001137 0.0005620 -0.0000498 0.0001084 -0.0001432 0.0002103 -0.0000131 0.0000061 -0.0000051 -0.0000877 0.10 Engineering Aftab -0.0000242 -0.0000498 0.0003267 -0.0000668 0.0000647 -0.0016628 0.0000043 0.0000198 0.0000007 0.0000518 0.10 Pharmaceuticals IBNSINA 0.0000221 0.0001084 -0.0000668 0.0002429 -0.0000495 0.0002729 0.0000352 -0.0000289 -0.0000149 0.0000189 0.10 Telecom GP 0.0004962 -0.0001432 0.0000647 -0.0000495 0.0095434 0.0001546 -0.0001200 -0.0023467 -0.0001845 0.0000576 0.10 NBFI Lankabangla 0.0007327 0.0002103 -0.0016628 0.0002729 0.0001546 0.0195649 0.0001645 -0.0001188 0.0000464 -0.0000141 0.10 Cement Lafarge -0.0000373 -0.0000131 0.0000043 0.0000352 -0.0001200 0.0001645 0.0005075 0.0000543 0.0000228 0.0000246 0.10 Fuel and power Jamunaoil -0.0001009 0.0000061 0.0000198 -0.0000289 -0.0023467 -0.0001188 0.0000543 0.0007092 0.0000536 0.0000311 0.10 Ceramic RAK -0.0000189 -0.0000051 0.0000007 -0.0000149 -0.0001845 0.0000464 0.0000228 0.0000536 0.0000905 -0.0000482 0.10 Food &Allied BATBC 0.0001501 -0.0000877 0.0000518 0.0000189 0.0000576 -0.0000141 0.0000246 0.0000311 -0.0000482 0.0008377 0.10 Portfolio Return -0.000122488 Portfolio Variance 0.0002807 Portfolio Standard Deviation 0.016754948 0.1297833 Company AB Bank Apex Spinning Aftab IBNSINA GP LankabanglaLafarge Jamunaoil RAK BATBC Weight 0.10 0.10 0.10 0.10 0.10 0.10 0.10 0.10 0.10 0.10 Sector Company Covariance Covariance Covariance Covariance Covariance Covariance Covariance Covariance Covariance Covariance Weight Bank AB Bank 0.0008691 0.0000163 0.0001508 0.0000806 0.0001136 0.0003419 0.0001140 0.0000231 0.0004974 -0.0000260 0.10 Textile Apex Spinning 0.0000163 0.0007210 0.0000647 0.0001096 -0.0000151 0.0002680 -0.0000238 0.0000692 -0.0001519 -0.0000716 0.10 Engineering Aftab 0.0001508 0.0000647 0.0003592 0.0000362 0.0001247 0.0001696 0.0005290 0.0003934 0.0001065 -0.0000558 0.10 Pharmaceuticals IBNSINA 0.0000806 0.0001096 0.0000362 0.0001318 0.0000278 0.0001317 0.0000058 0.0000219 0.0001621 -0.0000226 0.10 Telecom GP 0.0001136 -0.0000151 0.0001247 0.0000278 0.0023079 0.0000809 0.0000690 0.0000694 0.0000820 -0.0002120 0.10 NBFI Lankabangla 0.0003419 0.0002680 0.0001696 0.0001317 0.0000809 0.0116248 0.0001458 0.0000743 0.0040828 -0.0042552 0.10 Cement Lafarge 0.0001140 -0.0000238 0.0005290 0.0000058 0.0000690 0.0001458 0.0010664 0.0006830 0.0001978 -0.0000726 0.10 Fuel and power Jamunaoil 0.0000231 0.0000692 0.0003934 0.0000219 0.0000694 0.0000743 0.0006830 0.0005690 0.0001806 -0.0000313 0.10 Ceramic RAK 0.0004974 -0.0001519 0.0001065 0.0001621 0.0000820 0.0040828 0.0001978 0.0001806 0.0099927 -0.0015072 0.10 Food & Allied BATBC -0.0000260 -0.0000716 -0.0000558 -0.0000226 -0.0002120 -0.0042552 -0.0000726 -0.0000313 -0.0015072 0.0019094 0.10 Portfolio Return -0.00095636 Portfolio Variance 0.0003511 Portfolio Standard Deviation 0.018737118 0.1475362
- 21. 21 Quarter 2 (2018) Quarter 3 (2018) Company ABBank Apex Spinning Aftab IBNSINA GP LankabanglaLafarge Jamunaoil RAK BATBC Weight 0.10 0.10 0.10 0.10 0.10 0.10 0.10 0.10 0.10 0.10 Sector Company Covariance Covariance Covariance Covariance Covariance Covariance Covariance Covariance Covariance Covariance Weight Bank ABBank 0.0005644 0.0000511 0.0000942 0.0000133 -0.0000003 0.0001405 0.0000156 0.0000310 0.0000066 0.0000020 0.10 Textile Apex Spinning 0.0000511 0.0001109 0.0000320 0.0000224 -0.0000061 -0.0000035 -0.0000053 0.0000171 0.0000102 0.0000014 0.10 Engineering Aftab 0.0000942 0.0000320 0.0001611 0.0000224 0.0000157 0.0001354 0.0000188 0.0000477 0.0000382 0.0000151 0.10 Pharmaceuticals IBNSINA 0.0000133 0.0000224 0.0000224 0.0001895 0.0000281 0.0000556 0.0000633 -0.0000113 0.0000475 0.0000178 0.10 Telecom GP -0.0000003 -0.0000061 0.0000157 0.0000281 0.0000416 0.0000223 0.0000340 0.0000023 0.0000256 0.0000034 0.10 NBFI Lankabangla 0.0001405 -0.0000035 0.0001354 0.0000556 0.0000223 0.0008332 -0.0000377 0.0000221 0.0000800 0.0000176 0.10 Cement Lafarge 0.0000156 -0.0000053 0.0000188 0.0000633 0.0000340 -0.0000377 0.0002924 0.0000137 0.0000522 0.0000135 0.10 Fuel and power Jamunaoil 0.0000310 0.0000171 0.0000477 -0.0000113 0.0000023 0.0000221 0.0000137 0.0000557 0.0000102 0.0000042 0.10 Ceramic RAK 0.0000066 0.0000102 0.0000382 0.0000475 0.0000256 0.0000800 0.0000522 0.0000102 0.0001141 0.0000288 0.10 Food &Allied BATBC 0.0000020 0.0000014 0.0000151 0.0000178 0.0000034 0.0000176 0.0000135 0.0000042 0.0000288 0.0001901 0.10 PortfolioReturn -0.000641803 PortfolioVariance 0.0000497 PortfolioStandardDeviation 0.007050716 0.0541576 Company ABBank Apex Spinning Aftab IBNSINA GP LankabanglaLafarge Jamunaoil RAK BATBC Weight 0.10 0.10 0.10 0.10 0.10 0.10 0.10 0.10 0.10 0.10 Sector Company Covariance Covariance Covariance Covariance Covariance Covariance Covariance Covariance Covariance Covariance Weight Bank ABBank 0.0001859 0.0000030 -0.0000495 -0.0000264 -0.0000340 0.0001004 -0.0000239 0.0000083 -0.0000034 0.0000121 0.10 Textile Apex Spinning 0.0000030 0.0005497 0.0000515 0.0001768 0.0000270 -0.0000748 0.0000467 -0.0000184 0.0000236 -0.0000246 0.10 Engineering Aftab -0.0000495 0.0000515 0.0004928 0.0002682 -0.0000072 0.0000869 0.0000903 0.0000043 0.0001448 -0.0000653 0.10 Pharmaceuticals IBNSINA -0.0000264 0.0001768 0.0002682 0.0008971 -0.0000215 -0.0000774 -0.0000115 -0.0000399 0.0000112 -0.0000785 0.10 Telecom GP -0.0000340 0.0000270 -0.0000072 -0.0000215 0.0001622 -0.0000033 0.0000182 0.0000030 -0.0000408 -0.0000215 0.10 NBFI Lankabangla 0.0001004 -0.0000748 0.0000869 -0.0000774 -0.0000033 0.0004021 0.0000577 0.0000759 0.0000922 0.0000135 0.10 Cement Lafarge -0.0000239 0.0000467 0.0000903 -0.0000115 0.0000182 0.0000577 0.0005498 0.0003295 0.0008815 -0.0000046 0.10 Fuel and power Jamunaoil 0.0000083 -0.0000184 0.0000043 -0.0000399 0.0000030 0.0000759 0.0003295 0.0004412 0.0007291 0.0000134 0.10 Ceramic RAK -0.0000034 0.0000236 0.0001448 0.0000112 -0.0000408 0.0000922 0.0008815 0.0007291 0.0023376 -0.0000073 0.10 Food &Allied BATBC 0.0000121 -0.0000246 -0.0000653 -0.0000785 -0.0000215 0.0000135 -0.0000046 0.0000134 -0.0000073 0.0000850 0.10 PortfolioReturn 0.000740908 PortfolioVariance 0.0001137 PortfolioStandardDeviation 0.010665142 0.0832974
- 22. 22 Up factor and down factor determination: After getting all the quarterly standard deviation we can calculate the up and down factor for all the quarter by following the below formula: U= 𝒆^𝝏√𝒕 d= 𝟏/𝒖 Finally, the up factor and down factor has been calculated for every period which has been given below- u d Q4(2016) 1.13858149 0.878286 Q1(2017) 1.158975145 0.862831 Q2(2017) 1.055650897 0.947283 Q3(2017) 1.086864958 0.920078 Portfolio value and option price determination As the initial investment is Tk 1000000 so multiplying by the up factor value of up can be made and multiplying by the down factor value of portfolio down can be determined. This strategy has been followed for every node of every quarter according their up and down factor. Now the value of portfolio and option price are given below- Portfolio value for each quarter
- 23. 23 Q4(2017) 1.13858149 0.878286 1514029 Q1(2018) 1.158975145 0.862831 1393024 Q2(2018) 1.055650897 0.947283 1281690 Q3(2018) 1.086864958 0.920078 1319588 1358606 1250023 1150118 1138581 1127161 1037075 954189.7 982403.7 1011452 930614.2 856237.2 1000000 1167901 1074559 988677.7 1017911 1048010 964250.1 887184.8 878285.8 869476.1 799985.4 736048.6 757812.5 780219.9 717862.8 660489.4 Node Time Q0 Q4 (2017) Q1 (2018) Q2 (2018) Q3 (2018)
- 24. 24 Delta calculation Through the call option value and portfolio value call delta can be calculated. Here it has been assumed that closing price equal to strike price. Subtracting the K from portfolio value we get option price. And after that probability and present value factor has been calculated to find out the up and value of call option. Now for probability calculation the following formula has been used. P = (𝒂−𝒅)/(𝒖−𝒅) Here, a=𝒆^𝒓Δ𝒕 u= up factor d= down factor So probability for down factor will be = 1- P Finally value of call option has been calculated through the following formula Value of call option = 𝑒^(−𝑟𝑡)(portfolio up ×p +portfolio down×1-p) After finding out the value of call option delta value has been calculated through the following formula- Delta = (𝑓𝑢−𝑓𝑑)/(𝑆0𝑢−𝑆0𝑑) Now the delta for each quarter is given below:
- 25. 25 N/A 1 N/A 1.031449 N/A 1 N/A 0.898707 N/A 0.272652 N/A 0.320895 N/A 0 N/A 0.647382 N/A 0.490454 N/A 0.577237 N/A 0 N/A 0.181739 N/A 0 N/A 0 N/A 0 N/A Node Time Q0 Q4 (2017) Q1 (2018) Q2 (2018) Q3 (2018)
- 26. 26 Insured Portfolio 1514029 1393024 1281690 1319588 1358606 1250023 1150118 1161105 1127161 1070458 1080000 1034517 1080000 1039643 1080000 1067368 1167901 1098791 1080000 1054534 1080000 1038585 1080000 1012610 1080000 1043751 1080000 1021118 1080000 1046334 1080000 Node Time Q0 Q4 (2017) Q1 (2018) Q2 (2018) Q3 (2018)
- 27. 27 Put Option Dynamics Put option Strike price (1000000*1.08) tk.= 1080000 u d a p (1-p) T-bill rate C.C Rate PVF Q4(2016) 1.13858149 0.878286 1.032898 0.593988 0.406012 Q4(03/10/2017) 3.25% 0.032369 0.99194 Q1(2018) 1.158975145 0.862831 1.030032 0.564594 0.435406 Q1(02/01/2018) 2.97% 0.02959 0.99263 Q2(2018) 1.055650897 0.947283 1.028295 0.747568 0.252432 Q2(10/04/2018) 2.80% 0.027902 0.993049 Q3(2018) 1.086864958 0.920078 1.042150 0.731906 0.268094 Q3(03/07/2018) 4% 0.04 0.989732 1514029 0 1393023.884 0 1281690 0 1319587.647 0 1358606 0 1250022.759 0 1150118 0 1138581 22523.22 1127161 0 1037075.365 33382.60027 954189.7 125810.3 982403.7166 52113.35669 1011452 68548.03 930614.2011 109028.9625 856237.2 223762.8 1000000 67368.47349 1167901 0 1074559.145 24231.5318 988677.7 91322.3 1017911.458 36622.95017 1048010 31990.38 964250.0763 74335.27202 887184.8 192815.2 878285.8 134324.3 869476.1 210523.9 799985.4345 243765.8754 736048.6 343951.4 757812.4894 263305.0627 780219.9 299780.1 717862.7813 328471.2053 660489.4 419510.6 Q0 Q4 (2016) Q1 (2018) Q2 (2018) Q3 (2018)
- 28. 28 Call Option 91day u d a p (1-p) T-bill rate C.CRate PVF Q4(2016) 1.13858149 0.878286 1.032898221 0.593988 0.406012 Q4(03/10/2016) 3.25% 0.03236868 0.991940489 Q1(2017) 1.158975145 0.862831 1.030032404 0.564594261 0.435406 Q1(02/01/2017) 2.97% 0.029590282 0.992629729 Q2(2017) 1.055650897 0.947283 1.028295355 0.74756817 0.252432 Q2(10/04/2017) 2.80% 0.027902455 0.993048664 Q3(2017) 1.086864958 0.920078 1.042150 0.731906302 0.268094 Q3(03/07/2017) 4% 0.04 0.989731542 1514029 434028.8461 1393023.884 367923.0507 1281690 201689.9407 1319587.647 328391.0315 1358606 278605.934 1250022.759 220424.6806 1150118 70117.8221 1138581.49 195002.3717 1127161 47160.87365 1037075.365 34162.90078 954189.7 0 982403.7166 25361.56636 1011452 0 930614.2011 0 856237.2 0 1000000 125564.7413 1167901 87900.68019 1074559.145 63674.43991 988677.7 0 1017911.458 47270.09406 1048010 0 964250.0763 0 887184.8 0 878285.8398 26491.72291 869476.1 0 799985.4345 0 736048.6 0 757812.4894 0 780219.9 0 717862.7813 0 660489.4 0 Q0 Q4 (2017) Q1 (2018) Q2 (2018) Q3 (2018)
- 29. 29 Dynamic asset allocation Each and every time new portfolio is formed according to delta. Over the period investment pattern will not be same. If market goes up then investment will be made in new shares. On the other hand if market goes down then investment will be made in risk free asset. Now according to our delta dynamic asset allocation has been given below: Quarter 0 Quarter 0 100% Equity portfolio 1000000 Insured portfolio 1067368 Initial Delta 0.647382 New Portfolio Shares (0.843127*1000000) 647381.7 T-bill 419986.7 Total 1067368 Quarter 4(2017) 100% Equity portfolio 1138581 Insured portfolio 1161105 Shares (0.84313*1061250) 737096.9 T-bill 424007.9 Total 1161105 New Delta 0.898707 Sell (.097526102*1061250) Shares 286154 Buy T-bill 286154 New Portfolio Shares (.94065*1061250) 1023251 T-bill 710161.8 Total 1733413
- 30. 30 Quarter 4b (2017) 100% Equity portfolio 878285.8 Insured portfolio 1012610 Shares (0.84313*942285) 568586.2 T-bill 444023.9 Total 1012610 New Delta 0.181739 Sell (0.3693*942285) Shares 408967.5 Buy T-bill 408967.5 New Portfolio Shares (0.47383*942285) 159618.7 T-bill 852991.4 Total 1012610 Quarter 1a (2018) 100% Equity portfolio 1319588 Insured portfolio 1319588 Shares (0.84313*1155791) 1185922 T-bill 133665.4 Total 1319588 New Delta 1.031449 Buy (0.18832*1155791) Shares 175165.1 Sell T-bill 175165.1 New Portfolio Shares (1.03145*1155791) 1361087 T-bill -41499.7 Total 1319588 Quarter 1b (2018) 100% Equity portfolio 982403.7 Insured portfolio 1034517 Shares (0.84313*974442) 882892.8 T-bill 151624.2 Total 1034517 New Delta 0.320895 Sell (0.33858*974442) Shares 567644 Buy T-bill 567644 New Portfolio Shares (0..50455*974442) 315248.9 T-bill 719268.2 Total 1034517
- 31. 31 Quarter 1c (2018) 100% Equity portfolio 1017911 Insured portfolio 1054534 Shares (0.84313*1026229) 184994.1 T-bill 869540.3 Total 1054534 New Delta 0.577237 Sell (0..08601*1026229) Shares -402582 Buy T-bill -402582 New Portfolio Shares (0.92914*1026229) 587575.8 T-bill 466958.6 Total 1054534 Quarter 1d (2018) 100% Equity portfolio 757812.5 Insured portfolio 1021118 Shares (0.84313*865209) 137724 T-bill 883393.6 Total 1021118 New Delta 0 Sell (0.84313*865209) Shares 137724 Buy T-bill 137724 New Portfolio Shares 0 T-bill 1021118 Total 1021118 Quarter 2a (2018) 100% Equity portfolio 1393024 Insured portfolio 1393024 Shares (0.84313*1219549) 1436833 T-bill -43809.2 Total 1393024 New Delta 1 Buy Shares 218523.7 Sell T-bill 218523.7 New Portfolio Shares (1*1219549) 1393024 T-bill 0
- 32. 32 Total 1393024 Quarter 2b (2018) 100% Equity portfolio 1250023 Insured portfolio 1250023 Shares (.84313*1095365) 1289335 T-bill -39312 Total 1250023 New Delta 1 Buy Shares 196091.1 Sell T-bill 196091.1 New Portfolio Shares (1*1095365) 1250023 T-bill 0 Total 1250023 Quarter 2c (2018) 100% Equity portfolio 1037075 Insured portfolio 1070458 Shares (0.50455*1028196) 332792.7 T-bill 737665.2 Total 1070458 New Delta 0.272652 Buy Shares -50032.4 Sell T-bill -50032.4 New Portfolio Shares (0.54196*1028196) 282760.3 T-bill 787697.6 Total 1070458 Quarter 2d (2018) 100% Equity portfolio 930614.2 Insured portfolio 1039643 Shares 298629.8 T-bill 741013.3 Total 1039643 New Delta 0 Sell Shares 298629.8 Buy T-bill 298629.8 New Portfolio Shares 0
- 33. 33 T-bill 1039643 Total 1039643 Quarter 2e (2018) 100% Equity portfolio 1074559 Insured portfolio 1098791 Shares 620274.9 T-bill 478515.7 Total 1098791 New Delta 0.490454 Buy Shares -93252.8 Sell T-bill -93252.8 New Portfolio Shares (2.519892*1620038) 527022.1 T-bill 571768.5 Total 1098791 Quarter 2f (2018) 100% Equity portfolio 964250.1 Insured portfolio 1038585 Shares 556600.5 T-bill 481984.8 Total 1038585 New Delta 0 Sell (0.512999*687346.8) Shares 556600.5 Buy T-bill 556600.5 New Portfolio Shares 0 T-bill 1038585 Total 1038585 Quarter 2g (2018) 100% Equity portfolio 799985.4 Insured portfolio 1043751 Shares 0 T-bill 1043751 Total 1043751 New Delta 0
- 34. 34 New Portfolio Shares 0 T-bill 1043751 Total 1043751 Quarter 2h (2018) 100% Equity portfolio 717862.8 Insured portfolio 1046334 Shares 0 T-bill 1046334 Total 1046334 New Delta 0 New Portfolio Shares 0 T-bill 1046334 Total 1046334 Quarter 3a (2018) 100% Equity portfolio 1514028.846 Insured portfolio 1514028.846 1 shares * 1288663.896 1514028.846 0 T-Bill 0 Total 1514028.846 Quarter 3b (2018) 100% Equity portfolio 1281689.941 Insured portfolio 1281689.941 1 shares * 1154141.364 1281689.941 0 T-Bill 0 Total 1281689.941 Quarter 3c (2018) 100% Equity portfolio 1358605.934
- 35. 35 Insured portfolio 1358605.934 1 shares * 1157442.358 1358605.934 T-Bill 0 Total 1358605.934 Quarter 3d (2018) 100% Equity portfolio 1150117.822 Insured portfolio 1150117.822 1 shares*1036617.931 1150117.822 T-Bill 0 Total 1150117.822 Quarter 3e (2018) 100% Equity portfolio 1127160.874 Insured portfolio 1127160.874 0.64196 shares * 1086466.539 307322.2843 T-bill 819838.5894 Total 1127160.874 Quarter 3f (2018) 100% Equity portfolio 954189.7151 Insured portfolio 1080000 0.54196 shares * 973051.218 260161.4106 T-Bill 819838.5894 Total 1080000 Quarter 3g (2018) 100% Equity portfolio 1011451.965 Insured portfolio 1080000 0 shares*975834.2708 0 T-Bill 1080000 Total 1080000 Quarter 3h (2018) 100% Equity portfolio 856237.1929
- 36. 36 Insured portfolio 1080000 0 Shares * 873967.7582 0 T-Bill 1080000 Total 1080000 Quarter 3i (2018) 100% Equity portfolio 1167900.68 Insured portfolio 1167900.68 0.99803 shares* 1144206.969 572801.8956 T-Bill 595098.7846 Total 1167900.68 Quarter 3j (2018) 100% Equity portfolio 988677.6976 Insured portfolio 1080000 0.99803 shares*1024764.174 484901.2154 T-Bill 595098.7846 Total 1080000 Quarter 3 k(2018) 100% Equity portfolio 1048009.619 Insured portfolio 1080000 0 shares*1027695.132 0 T-Bill 1080000 Total 1080000 Quarter 3L (2018) 100% Equity portfolio 887184.8051 Insured portfolio 1080000 0 shares*920414.9082 0 T-Bill 1080000 Total 1080000 Quarter 3m (2018) 100% Equity portfolio 869476.1361
- 37. 37 Insured portfolio 1080000 0 shares * 964675.5761 0 T-Bill 1080000 Total 1080000 Quarter 3n (2018) 100% Equity portfolio 736048.6032 Insured portfolio 1080000 0 shares * 863973.9102 0 T-Bill 1080000 Total 1080000 Quarter 3p (2018) 100% Equity portfolio 780219.902 Insured portfolio 1080000 0 shares*866444.9878 0 T-Bill 1080000 Total 1080000 Quarter 3q(2018) 100% Equity portfolio 660489.3973 Insured portfolio 1080000 0 shares * 775997.5298 0 T-Bill 1080000 Total= 1080000
- 38. 38 Comparison of portfolios I have done the comparison in terms of absolute portfolio value, return on investment and Q2Q return. And I have calculated all these values in all the following four portfolios and then compare the result between those and try to find out which provide the best result. 1) Static Portfolio 2) 100 % T-bill Portfolio 3) Dynamic Portfolio 4) 100% equity portfolio 1. Static Portfolio 2. 100% T-Bill Portfolio Q4 (2017) Q1 (2018) Q2 (2018) Q3 (2018) Stock 711394 878600 826439 893342 T-Bill 355483.2917 358122.7552 360629.6145 364371.1467 Total 1066877 1236722 1187069 1257713 ROI 6.69% 23.67% 18.71% 25.77% Q2Q Return 6.69% 15.92% -4.01% 5.95% Static Portfolio Value Q4 (2017) Q1 (2018) Q2 (2018) Q3 (2018) Stock 0 0 0 0 T-Bill 1008125 1015610.328 1022719.6 1033330.316 Total 1008125 1015610 1022720 1033330 ROI 0.81% 1.56% 2.27% 3.33% Q2Q Return 0.81% 0.74% 0.70% 1.04% 100% T-bill Portfolio Value
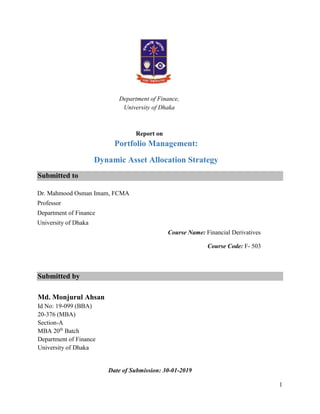
- 39. 39 3. 100% Equity Portfolio 4. Dynamic Portfolio Comparison Comparison in terms of absolute portfolio Value Q4 (2017) Q1 (2018) Q2 (2018) Q3 (2018) Static Portfolio 1066877 1236722 1187069 1257713 100% T-Bill portfolio 1008125 1015610 1022720 1033330 100% equity Portfolio 1098879 1357158 1276587 1379931 Dynamic Portfolio 852991 1021118 1046334 1080000 Q4 (2017) Q1 (2018) Q2 (2018) Q3 (2018) Stock 1098879 1357158 1276587 1379931 T-Bill 0 0 0 0 Total 1098879 1357158 1276587 1379931 ROI 9.89% 35.72% 27.66% 37.99% Q2Q Return 9.89% 23.50% -5.94% 8.10% 100 % equity Portfolio Value Q4 (2017) Q1 (2018) Q2 (2018) Q3 (2018) Stock 0 0 0 0 T-Bill 852991.4449 1021117.552 1046333.987 1080000 Total 852991 1021118 1046334 1080000 ROI -14.70% 2.11% 4.63% 8.00% Q2Q Return -14.70% 19.71% 2.47% 3.22% Dynamic Portfolio Value
- 40. 40 In case of absolute portfolio value, dynamic portfolio keeps increasing in each quarter and it has the highest value in each quarter. So dynamic provides the best solution in each quarter. And 100% equity portfolio provides lowest performance amongst the four in every quarter. Comparison in terms of absolute return Q4 (2017) Q1 (2018) Q2 (2018) Q3 (2018) Static Portfolio 6.69% 23.67% 18.71% 25.77% 100% T-Bill portfolio 0.81% 1.56% 2.27% 3.33% 100% equity Portfolio 9.89% 35.72% 27.66% 37.99% Dynamic Portfolio -14.70% 2.11% 4.63% 8.00% 0 200000 400000 600000 800000 1000000 1200000 1400000 1600000 Q4 (2017) Q1 (2018) Q2 (2018) Q3 (2018) Absolute portfolio Value Static Portfolio 100% T-Bill portfolio 100% equity Portfolio Dynamic Portfolio
- 41. 41 While I compared the among the four options, then I found out that 100% equity provides negative return in each and every quarter. And static portfolio return was negative in the first two quarters but it improves a little bit over the next two quarter. Both 100% T-bill and dynamic portfolio provides positive return. 100% T-bill portfolio performs better than dynamic portfolio in the first quarter but in the remaining three quarter dynamic portfolio provides more return. Comparison in terms of Q2Q return Q4 (2017) Q1 (2018) Q2 (2018) Q3 (2018) Static Portfolio 6.69% 15.92% -4.01% 5.95% 100% T-Bill portfolio 0.81% 0.74% 0.70% 1.04% 100% equity Portfolio 9.89% 23.50% -5.94% 8.10% Dynamic Portfolio -14.70% 19.71% 2.47% 3.22% -20.00% -10.00% 0.00% 10.00% 20.00% 30.00% 40.00% 50.00% Q4 (2017) Q1 (2018) Q2 (2018) Q3 (2018) Return on investment Static Portfolio 100% T-Bill portfolio 100% equity Portfolio Dynamic Portfolio
- 42. 42 In the first quarter both static and 100% equity portfolio provides negative result and 100% T-bill and dynamic provides positive value. Here 100% T-bill is better than dynamic portfolio. In the second quarter, all portfolios provide positive return and among those dynamic portfolio provides more return. In the third quarter all the portfolios provide positive return but here 100% equity provides the best result. In the fourth quarter dynamic portfolio provides the best result. -20.00% -15.00% -10.00% -5.00% 0.00% 5.00% 10.00% 15.00% 20.00% 25.00% 30.00% Q4 (2017) Q1 (2018) Q2 (2018) Q3 (2018) Q2Q Return Static Portfolio 100% T-Bill portfolio 100% equity Portfolio Dynamic Portfolio
- 43. 43 Conclusion Dynamic asset allocation strategy is the better model of portfolio investment in comparison with the static asset allocation strategy. This method provides the basis for adjustment in asset proportion in the portfolio in terms of the changes in prices of the underlying securities. This is a continuous process of changing the portfolio combination and structure which provides better insurance of the portfolio value indicating the supremacy above all other methods of portfolio construction. Dynamic asset allocation is essential to construct new portfolio with the risky and risk free asset. That means with the changes in delta either securities sell or buy to construct new portfolio. If delta increases then new risky securities will be bought and if delta decreases then some securities will be sold and risk free asset with the same amount will be bought to make new portfolio. So in the above case by the shares of 10 companies and Treasury bill it can be possible to construct portfolio with quarterly that’s why dynamic asset allocation strategy is used. Through this approach investment can be hedge out as it is constructed by considering the delta of call option. As every period portfolio construction can be changed that’s why it is dynamic asset allocation strategy not static asset allocation strategy. The basic dynamic trading approach involves replicating the insured portfolio’s price action with an ever-changing combination of positions in the underlying portfolio and the risk less asset. The proportions allocated to the underlying portfolio and the risk less asset change every period. The dynamic insurance strategy requires a significant amount of trading. By dynamic asset allocation it can be shown that how the same replication is accomplished (approximately) with either a stock portfolio and short futures positions or the risk less futures.
- 44. 44 References 1. Options, Futures and Other Derivative Securities by John Hull. Prantice-Hall International Inc. 2. Gibson R., Heinz Z. (1996). The Benefits and Risks of Derivative Instruments: An Economic Perspective, Derivatives Use, Trading and Regulation. Geneva Paper. 3. World Federation of Exchanges, 2008c, “Equity derivatives and cash equity trading”, December 2008. 4. The case for Dynamic Asset Allocation by Mellon Capital Management Corporation Research Team. Websites www.dsebd.org www.secbd.org www.bb.org.bd www.mof.gov.bd www.stockbangladesh.com www.langkabanglaportal.com www.encyclopedia.com Primary Data DSE Trade Information Archive DSE Dividend Archive