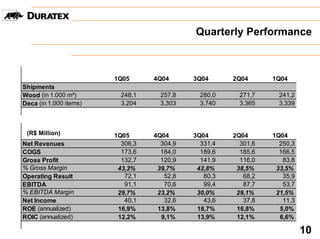
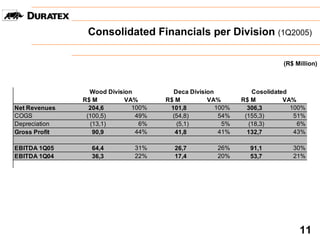
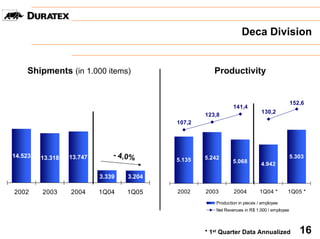
First Quarter 2005
      Results


           www.duratex.com.br
Capital Markets


 Free Float
Number of Outstanding Shares: 11.782.716.987
      Common 37%
      Preferred 63% (80% tag-along Rights)


                                     Preferred Shareholder´s
                                        Structure - Mar/05
                                                        Foreign
                                                       Investors
                                                         26,0%
                                 Pension
                                  Funds
                                                            Treasury
                                  21,7%
                                                              0,2%


                                                           Others
                                                           27,7%
                                     Itausa
                                     24,4%                             1
Corporate Governance


 Level I – documents delivered at BOVESPA and are pending approval


 It was proposed to the Extraordinary General Meeting a “Reverse
Stock Split” operation
         200 shares per 1
         In the future the stock will be negociated under an unitary price

 Theses events targets Improving Transparency, Liquidity and
 Shareholders’ Value


                                                                             2
Perfomance of Duratex Preferred Shares


          Duratex PN x Stock Indexes (100 BASIS as of MAR/04)


160


140                                                                                                         DURATEX (53%)
                                                                                                            IBX (34%)
                                                                                                            FGV 100 (27%)
120
                                                                                                            IBOVESPA (20%)

100


80
                                                                   04
                                                 04


                                                           4
              4


                                        04


                                                                            04


                                                                                              05
     4


              4


                                                                                                        5
                                4
                      04


                                                                                     05
            /0


                                                        t/0
   /0


            r0


                                                                                                      /0
                             l/0


                                                                 v/
                                               p/
                                      g/


                                                                          c/


                                                                                            b/
                    n/


                                                                                   n/
          ay
          ap
 ar


                                                                                                    ar
                           ju


                                                      oc


                                                               no
                                             se
                                    au


                                                                        de


                                                                                          fe
                  ju


                                                                                 ja
m


                                                                                                   m
         m


                                                                                                                       3
Business Segments


       Wood
Hardboard                   Metal Fittings
Particle Board              Vitreous China
MDF/HDF/SDF                 Accessories
Laminate Flooring
Ceiling and Wall Paneling


                                             4
Net Revenues Breakdown (1Q2005)

  Domestic
Revenues 82%                                 MDF/HDF/SDF    InterD+
 R$ 251,3 M                                      22%          1%
                                                                  Flooring 6%


                                  Particle                                  Metal
                                   Board           R$ 306,3 M              Fittings
                                    15%                                      23%
                Revenues
               Abroad 18%
               R$ 55,0 M                                        Vitreous
                                             Hardboard           China
                                                23%               10%


                     Wood Division 67%
                     Deca Division 33%
                                                                               5
Capital Expeditures Plan

                                                 (R$ Million)

                                  311,4


                        224,6
                210,4
199,4
        187,5


                303,0


                        172,8
138,9   139,4                     136,8

                                          29,8

2000    2001    2002    2003      2004    1Q05

                CAPEX    EBITDA                         6
Industrial Capacity & Occupancy Rates


                     JAN – MAR / 2005

   Hardboard               91,9%            360.000 m3/year
                                             360.000 m3/year


Particle Board      76,7%                   500.000 m3/year
                                             500.000 m3/year


MDF/HDF/SDF        72,0%                    640.000 m3/year
                                             640.000 m3/year


                                              14.400 K
 Metal Fittings      79,2%                     14.400 K
                                             pieces/year
                                              pieces/year


Vitreous China    65,3%                        4.200 KK
                                                4.200
                                             pieces/year
                                              pieces/year


                                                               7
Exports

                                              (US$ Million)


              57,5
                                ,1%
       46,5                 + 23
41,5


                     13,0             16,0


2002   2003   2004   1Q04             1Q05

                                                      8
Export Highlights


                                                               MDF/HDF/
                                                                 SDF
Wood                                                             20%
89%                                Hardboard
                                      63%

                                                                 Flooring 2%
                          Deca
                          11%                                  InterD+ 4%
                                                           Vitreous
                                                 Metal      China
Export Markets                                  Fittings
                                                   4%
                                                              7%


United States                    47%
Europe                           27%
Asia / Middle East                9%
South / Central America          15%
Others                            2%
                                                                            9
Quarterly Performance


                        1Q05      4Q04      3Q04      2Q04      1Q04
Shipments
Wood (in 1.000 m³)        248,1     257,8     280,0     271,7     241,2
Deca (in 1.000 items)     3.204     3.303     3.740     3.365     3.339


 (R$ Million)           1Q05      4Q04      3Q04      2Q04      1Q04
Net Revenues              306,3     304,9     331,4     301,6     250,3
COGS                      173,6     184,0     189,6     185,6     166,5
Gross Profit              132,7     120,9     141,9     116,0      83,8
% Gross Margin           43,3%     39,7%     42,8%     38,5%     33,5%
Operating Result           72,1      52,8      80,3      68,2      35,9
EBITDA                     91,1      70,6      99,4      87,7      53,7
% EBITDA Margin          29,7%     23,2%     30,0%     29,1%     21,5%
Net Income                 40,1      32,6      43,6      37,8      11,3
ROE (annualized)         16,9%     13,8%     18,7%     16,8%      5,0%
ROIC (annualized)        12,2%      9,1%     13,9%     12,1%      6,6%

                                                                          10
Consolidated Financials per Division (1Q2005)

                                                                        (R$ Million)


                 Wood Division         Deca Division           Cosolidated
               R$ M         VA%      R$ M         VA%       R$ M         VA%
Net Revenues     204,6        100%    101,8          100%     306,3        100%
COGS            (100,5)        49%     (54,8)         54%    (155,3)        51%
Depreciation     (13,1)         6%      (5,1)          5%     (18,3)         6%
Gross Profit      90,9         44%      41,8          41%     132,7         43%

EBITDA 1Q05      64,4         31%      26,7          26%      91,1         30%
EBITDA 1Q04      36,3         22%      17,4          20%      53,7         21%


                                                                             11
Total Debt & Amortization Schedule (as of Mar/2005)


           507,1                  Amortization Schedule                           (R$ Million)


 Foreign   109,4
Currency              163,3


                                  69,1


           397,7
Domestic                                      226,1
Currency

                                                             48,6

            Debt       2005        2006        2007       2008 & Beyond


     Cash            R$ 84,7 M            Net Debt / Equity               41,6%
     Net Debt        R$ 422,4 M           Net Debt / EBITDA *             1,16
                                          * EBITDA Annualized                          12
Performance per Division


       EBITDA (R$ M) & Margin (%)


                   Wood
         34,9%   36,4%                                                   26,3%
                                 31,5%
                         28,0%           19,9%
22,2%                                            15,4%   15,4%
                                                                 13,5%
                 83,7                                                    26,7
         73,6
                         57,0    64,4
                                         17,4            15,7
36,3                                             14,1            13,6


1Q04     2Q04    3Q04    4Q04    1Q05    1Q04    2Q04    3Q04    4Q04    1Q05

                                                                           13
Consolidated Cash Flow Statement

                                                                  (R$ Million)


                                                    1Q05        1Q04
NET INCOME                                              40,1        11,3
Depreciation/Amortization/Depletion                     19,0        17,8
Interests/FX Variation                                  24,9        11,7
Provisions                                               4,0         3,4
SUB-TOTAL                                                87,9        44,3
Investments in Working Capital                           5,3        11,7
OPERATING CASH FLOW                                     93,3        56,0


                                                                       14
Wood Division


        Shipments (in 1.000 m³)                       Productivity


                                                               272,0                         276,8
                                                   230,1                     229,0
                                           212,1


         905,6
                 1.050,7     + 2,8%                351,4       376,8         382,1           397,5
881,2                                      331,5


                           241,2   248,1

2002      2003    2004     1Q04    1Q05    2002    2003        2004         1Q04 *       1Q05 *
                                                       Production in m³ / employee
                                                       Net Revenues in R$ 1.000 / employee


                                                   * 1st Quarter Data Annualized                15
Deca Division


    Shipments (in 1.000 items)                        Productivity


                                                                                             152,6
                                                               141,4
                                                                             130,2
                                                   123,8
                                           107,2


14.523   13.318   13.747       - 4,0%              5.242                                     5.303
                                           5.135               5.068         4.942

                           3.339   3.204

2002     2003     2004     1Q04    1Q05    2002    2003        2004         1Q04 *       1Q05 *
                                                       Production in pieces / employee
                                                       Net Revenues in R$ 1.000 / employee


                                                   * 1st Quarter Data Annualized                16
Dividends

                                                      (R$ Million)
Pay-Out 2004: 46,4%


                                   2%
                              + 28,
                          R
                       CAG


                                               58,1


                23,6      24,6          25,7
     21,5


     2000       2001      2002          2003   2004
                                                           17
First Quarter 2005
      Results


           www.duratex.com.br

Duratex - 1st Quarter 2005

  • 1.
    First Quarter 2005 Results www.duratex.com.br
  • 2.
    Capital Markets FreeFloat Number of Outstanding Shares: 11.782.716.987 Common 37% Preferred 63% (80% tag-along Rights) Preferred Shareholder´s Structure - Mar/05 Foreign Investors 26,0% Pension Funds Treasury 21,7% 0,2% Others 27,7% Itausa 24,4% 1
  • 3.
    Corporate Governance LevelI – documents delivered at BOVESPA and are pending approval It was proposed to the Extraordinary General Meeting a “Reverse Stock Split” operation 200 shares per 1 In the future the stock will be negociated under an unitary price Theses events targets Improving Transparency, Liquidity and Shareholders’ Value 2
  • 4.
    Perfomance of DuratexPreferred Shares Duratex PN x Stock Indexes (100 BASIS as of MAR/04) 160 140 DURATEX (53%) IBX (34%) FGV 100 (27%) 120 IBOVESPA (20%) 100 80 04 04 4 4 04 04 05 4 4 5 4 04 05 /0 t/0 /0 r0 /0 l/0 v/ p/ g/ c/ b/ n/ n/ ay ap ar ar ju oc no se au de fe ju ja m m m 3
  • 5.
    Business Segments Wood Hardboard Metal Fittings Particle Board Vitreous China MDF/HDF/SDF Accessories Laminate Flooring Ceiling and Wall Paneling 4
  • 6.
    Net Revenues Breakdown(1Q2005) Domestic Revenues 82% MDF/HDF/SDF InterD+ R$ 251,3 M 22% 1% Flooring 6% Particle Metal Board R$ 306,3 M Fittings 15% 23% Revenues Abroad 18% R$ 55,0 M Vitreous Hardboard China 23% 10% Wood Division 67% Deca Division 33% 5
  • 7.
    Capital Expeditures Plan (R$ Million) 311,4 224,6 210,4 199,4 187,5 303,0 172,8 138,9 139,4 136,8 29,8 2000 2001 2002 2003 2004 1Q05 CAPEX EBITDA 6
  • 8.
    Industrial Capacity &Occupancy Rates JAN – MAR / 2005 Hardboard 91,9% 360.000 m3/year 360.000 m3/year Particle Board 76,7% 500.000 m3/year 500.000 m3/year MDF/HDF/SDF 72,0% 640.000 m3/year 640.000 m3/year 14.400 K Metal Fittings 79,2% 14.400 K pieces/year pieces/year Vitreous China 65,3% 4.200 KK 4.200 pieces/year pieces/year 7
  • 9.
    Exports (US$ Million) 57,5 ,1% 46,5 + 23 41,5 13,0 16,0 2002 2003 2004 1Q04 1Q05 8
  • 10.
    Export Highlights MDF/HDF/ SDF Wood 20% 89% Hardboard 63% Flooring 2% Deca 11% InterD+ 4% Vitreous Metal China Export Markets Fittings 4% 7% United States 47% Europe 27% Asia / Middle East 9% South / Central America 15% Others 2% 9
  • 11.
    Quarterly Performance 1Q05 4Q04 3Q04 2Q04 1Q04 Shipments Wood (in 1.000 m³) 248,1 257,8 280,0 271,7 241,2 Deca (in 1.000 items) 3.204 3.303 3.740 3.365 3.339 (R$ Million) 1Q05 4Q04 3Q04 2Q04 1Q04 Net Revenues 306,3 304,9 331,4 301,6 250,3 COGS 173,6 184,0 189,6 185,6 166,5 Gross Profit 132,7 120,9 141,9 116,0 83,8 % Gross Margin 43,3% 39,7% 42,8% 38,5% 33,5% Operating Result 72,1 52,8 80,3 68,2 35,9 EBITDA 91,1 70,6 99,4 87,7 53,7 % EBITDA Margin 29,7% 23,2% 30,0% 29,1% 21,5% Net Income 40,1 32,6 43,6 37,8 11,3 ROE (annualized) 16,9% 13,8% 18,7% 16,8% 5,0% ROIC (annualized) 12,2% 9,1% 13,9% 12,1% 6,6% 10
  • 12.
    Consolidated Financials perDivision (1Q2005) (R$ Million) Wood Division Deca Division Cosolidated R$ M VA% R$ M VA% R$ M VA% Net Revenues 204,6 100% 101,8 100% 306,3 100% COGS (100,5) 49% (54,8) 54% (155,3) 51% Depreciation (13,1) 6% (5,1) 5% (18,3) 6% Gross Profit 90,9 44% 41,8 41% 132,7 43% EBITDA 1Q05 64,4 31% 26,7 26% 91,1 30% EBITDA 1Q04 36,3 22% 17,4 20% 53,7 21% 11
  • 13.
    Total Debt &Amortization Schedule (as of Mar/2005) 507,1 Amortization Schedule (R$ Million) Foreign 109,4 Currency 163,3 69,1 397,7 Domestic 226,1 Currency 48,6 Debt 2005 2006 2007 2008 & Beyond Cash R$ 84,7 M Net Debt / Equity 41,6% Net Debt R$ 422,4 M Net Debt / EBITDA * 1,16 * EBITDA Annualized 12
  • 14.
    Performance per Division EBITDA (R$ M) & Margin (%) Wood 34,9% 36,4% 26,3% 31,5% 28,0% 19,9% 22,2% 15,4% 15,4% 13,5% 83,7 26,7 73,6 57,0 64,4 17,4 15,7 36,3 14,1 13,6 1Q04 2Q04 3Q04 4Q04 1Q05 1Q04 2Q04 3Q04 4Q04 1Q05 13
  • 15.
    Consolidated Cash FlowStatement (R$ Million) 1Q05 1Q04 NET INCOME 40,1 11,3 Depreciation/Amortization/Depletion 19,0 17,8 Interests/FX Variation 24,9 11,7 Provisions 4,0 3,4 SUB-TOTAL 87,9 44,3 Investments in Working Capital 5,3 11,7 OPERATING CASH FLOW 93,3 56,0 14
  • 16.
    Wood Division Shipments (in 1.000 m³) Productivity 272,0 276,8 230,1 229,0 212,1 905,6 1.050,7 + 2,8% 351,4 376,8 382,1 397,5 881,2 331,5 241,2 248,1 2002 2003 2004 1Q04 1Q05 2002 2003 2004 1Q04 * 1Q05 * Production in m³ / employee Net Revenues in R$ 1.000 / employee * 1st Quarter Data Annualized 15
  • 17.
    Deca Division Shipments (in 1.000 items) Productivity 152,6 141,4 130,2 123,8 107,2 14.523 13.318 13.747 - 4,0% 5.242 5.303 5.135 5.068 4.942 3.339 3.204 2002 2003 2004 1Q04 1Q05 2002 2003 2004 1Q04 * 1Q05 * Production in pieces / employee Net Revenues in R$ 1.000 / employee * 1st Quarter Data Annualized 16
  • 18.
    Dividends (R$ Million) Pay-Out 2004: 46,4% 2% + 28, R CAG 58,1 23,6 24,6 25,7 21,5 2000 2001 2002 2003 2004 17
  • 19.
    First Quarter 2005 Results www.duratex.com.br