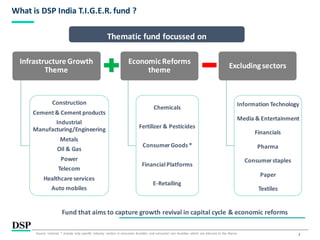
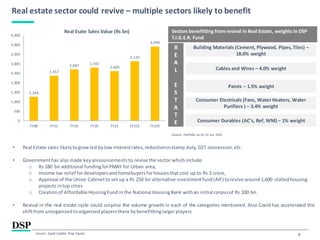
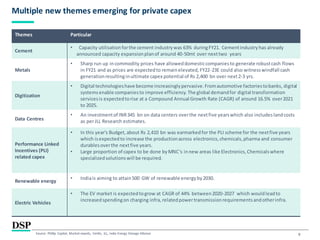
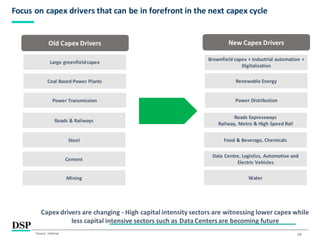
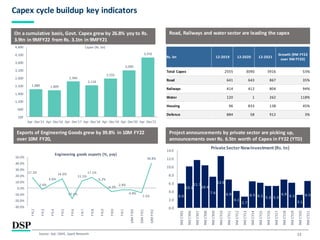
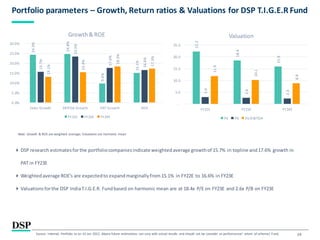
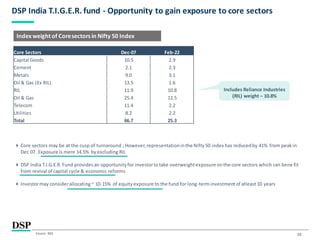
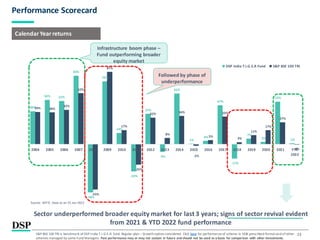
This document discusses the DSP India T.I.G.E.R. Fund, which aims to capture growth from India's investment cycle revival and economic reforms. It focuses on sectors related to infrastructure growth and economic reforms like construction, cement, manufacturing, and autos. The document outlines reasons for recommending the fund, such as signs the investment cycle has bottomed out and capacity utilization rising. It also discusses the government's push for capex spending and various reforms that have been implemented in India to support the investment theme. Key data points are presented to track the building capex cycle in India.
![[Title to come]
[Sub-Title to come]
Strictly for IntendedRecipients Only
Date
* DSP India Fund is the Company incorporated in Mauritius,under which ILSF is the corresponding share class
March 2022
| People | Processes | Performance |
DSP India T.I.G.E.R. Fund
(The Infrastructure Growth and Economic Reforms
Fund)
#INVESTFORGOOD](https://image.slidesharecdn.com/dsptigerfundmarch2022final-220314071907/85/DSP-India-T-I-G-E-R-Fund-1-320.jpg)
![[Title to come]
[Sub-Title to come]
Strictly for IntendedRecipients Only
Date
* DSP India Fund is the Company incorporated in Mauritius,under which ILSF is the corresponding share class
March 2022
| People | Processes | Performance |
DSP India T.I.G.E.R. Fund
(The Infrastructure Growth and Economic Reforms
Fund)
#INVESTFORGOOD](https://image.slidesharecdn.com/dsptigerfundmarch2022final-220314071907/75/DSP-India-T-I-G-E-R-Fund-1-2048.jpg)
![[Title to come]
[Sub-Title to come]
Strictly for IntendedRecipients Only
Date
* DSP India Fund is the Company incorporated in Mauritius,under which ILSF is the corresponding share class
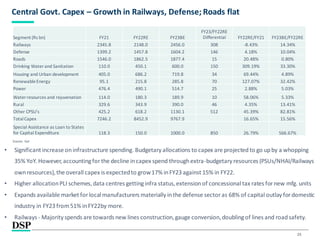
Why are we recommending DSP India T.I.G.E.R.
Fund?](https://image.slidesharecdn.com/dsptigerfundmarch2022final-220314071907/85/DSP-India-T-I-G-E-R-Fund-3-320.jpg)
![[Title to come]
[Sub-Title to come]
Strictly for IntendedRecipients Only
Date
* DSP India Fund is the Company incorporated in Mauritius,under which ILSF is the corresponding share class
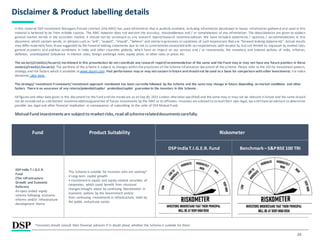
Tracking key data points as investment cycle
builds-up](https://image.slidesharecdn.com/dsptigerfundmarch2022final-220314071907/85/DSP-India-T-I-G-E-R-Fund-11-320.jpg)
![[Title to come]
[Sub-Title to come]
Strictly for IntendedRecipients Only
Date
* DSP India Fund is the Company incorporated in Mauritius,under which ILSF is the corresponding share class
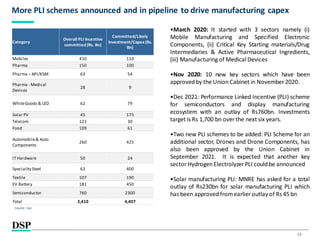
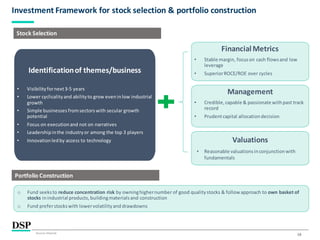
Investment team & Investment Framework](https://image.slidesharecdn.com/dsptigerfundmarch2022final-220314071907/85/DSP-India-T-I-G-E-R-Fund-14-320.jpg)
![[Title to come]
[Sub-Title to come]
Strictly for IntendedRecipients Only
Date
* DSP India Fund is the Company incorporated in Mauritius,under which ILSF is the corresponding share class
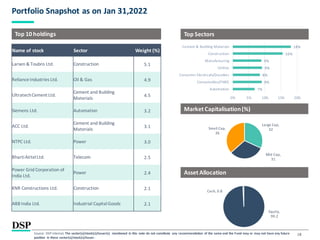
Portfolio Positioning](https://image.slidesharecdn.com/dsptigerfundmarch2022final-220314071907/85/DSP-India-T-I-G-E-R-Fund-17-320.jpg)
![[Title to come]
[Sub-Title to come]
Strictly for IntendedRecipients Only
Date
* DSP India Fund is the Company incorporated in Mauritius,under which ILSF is the corresponding share class
Performance](https://image.slidesharecdn.com/dsptigerfundmarch2022final-220314071907/85/DSP-India-T-I-G-E-R-Fund-22-320.jpg)
![[Title to come]
[Sub-Title to come]
Strictly for IntendedRecipients Only
Date
* DSP India Fund is the Company incorporated in Mauritius,under which ILSF is the corresponding share class
Appendix](https://image.slidesharecdn.com/dsptigerfundmarch2022final-220314071907/85/DSP-India-T-I-G-E-R-Fund-24-320.jpg)