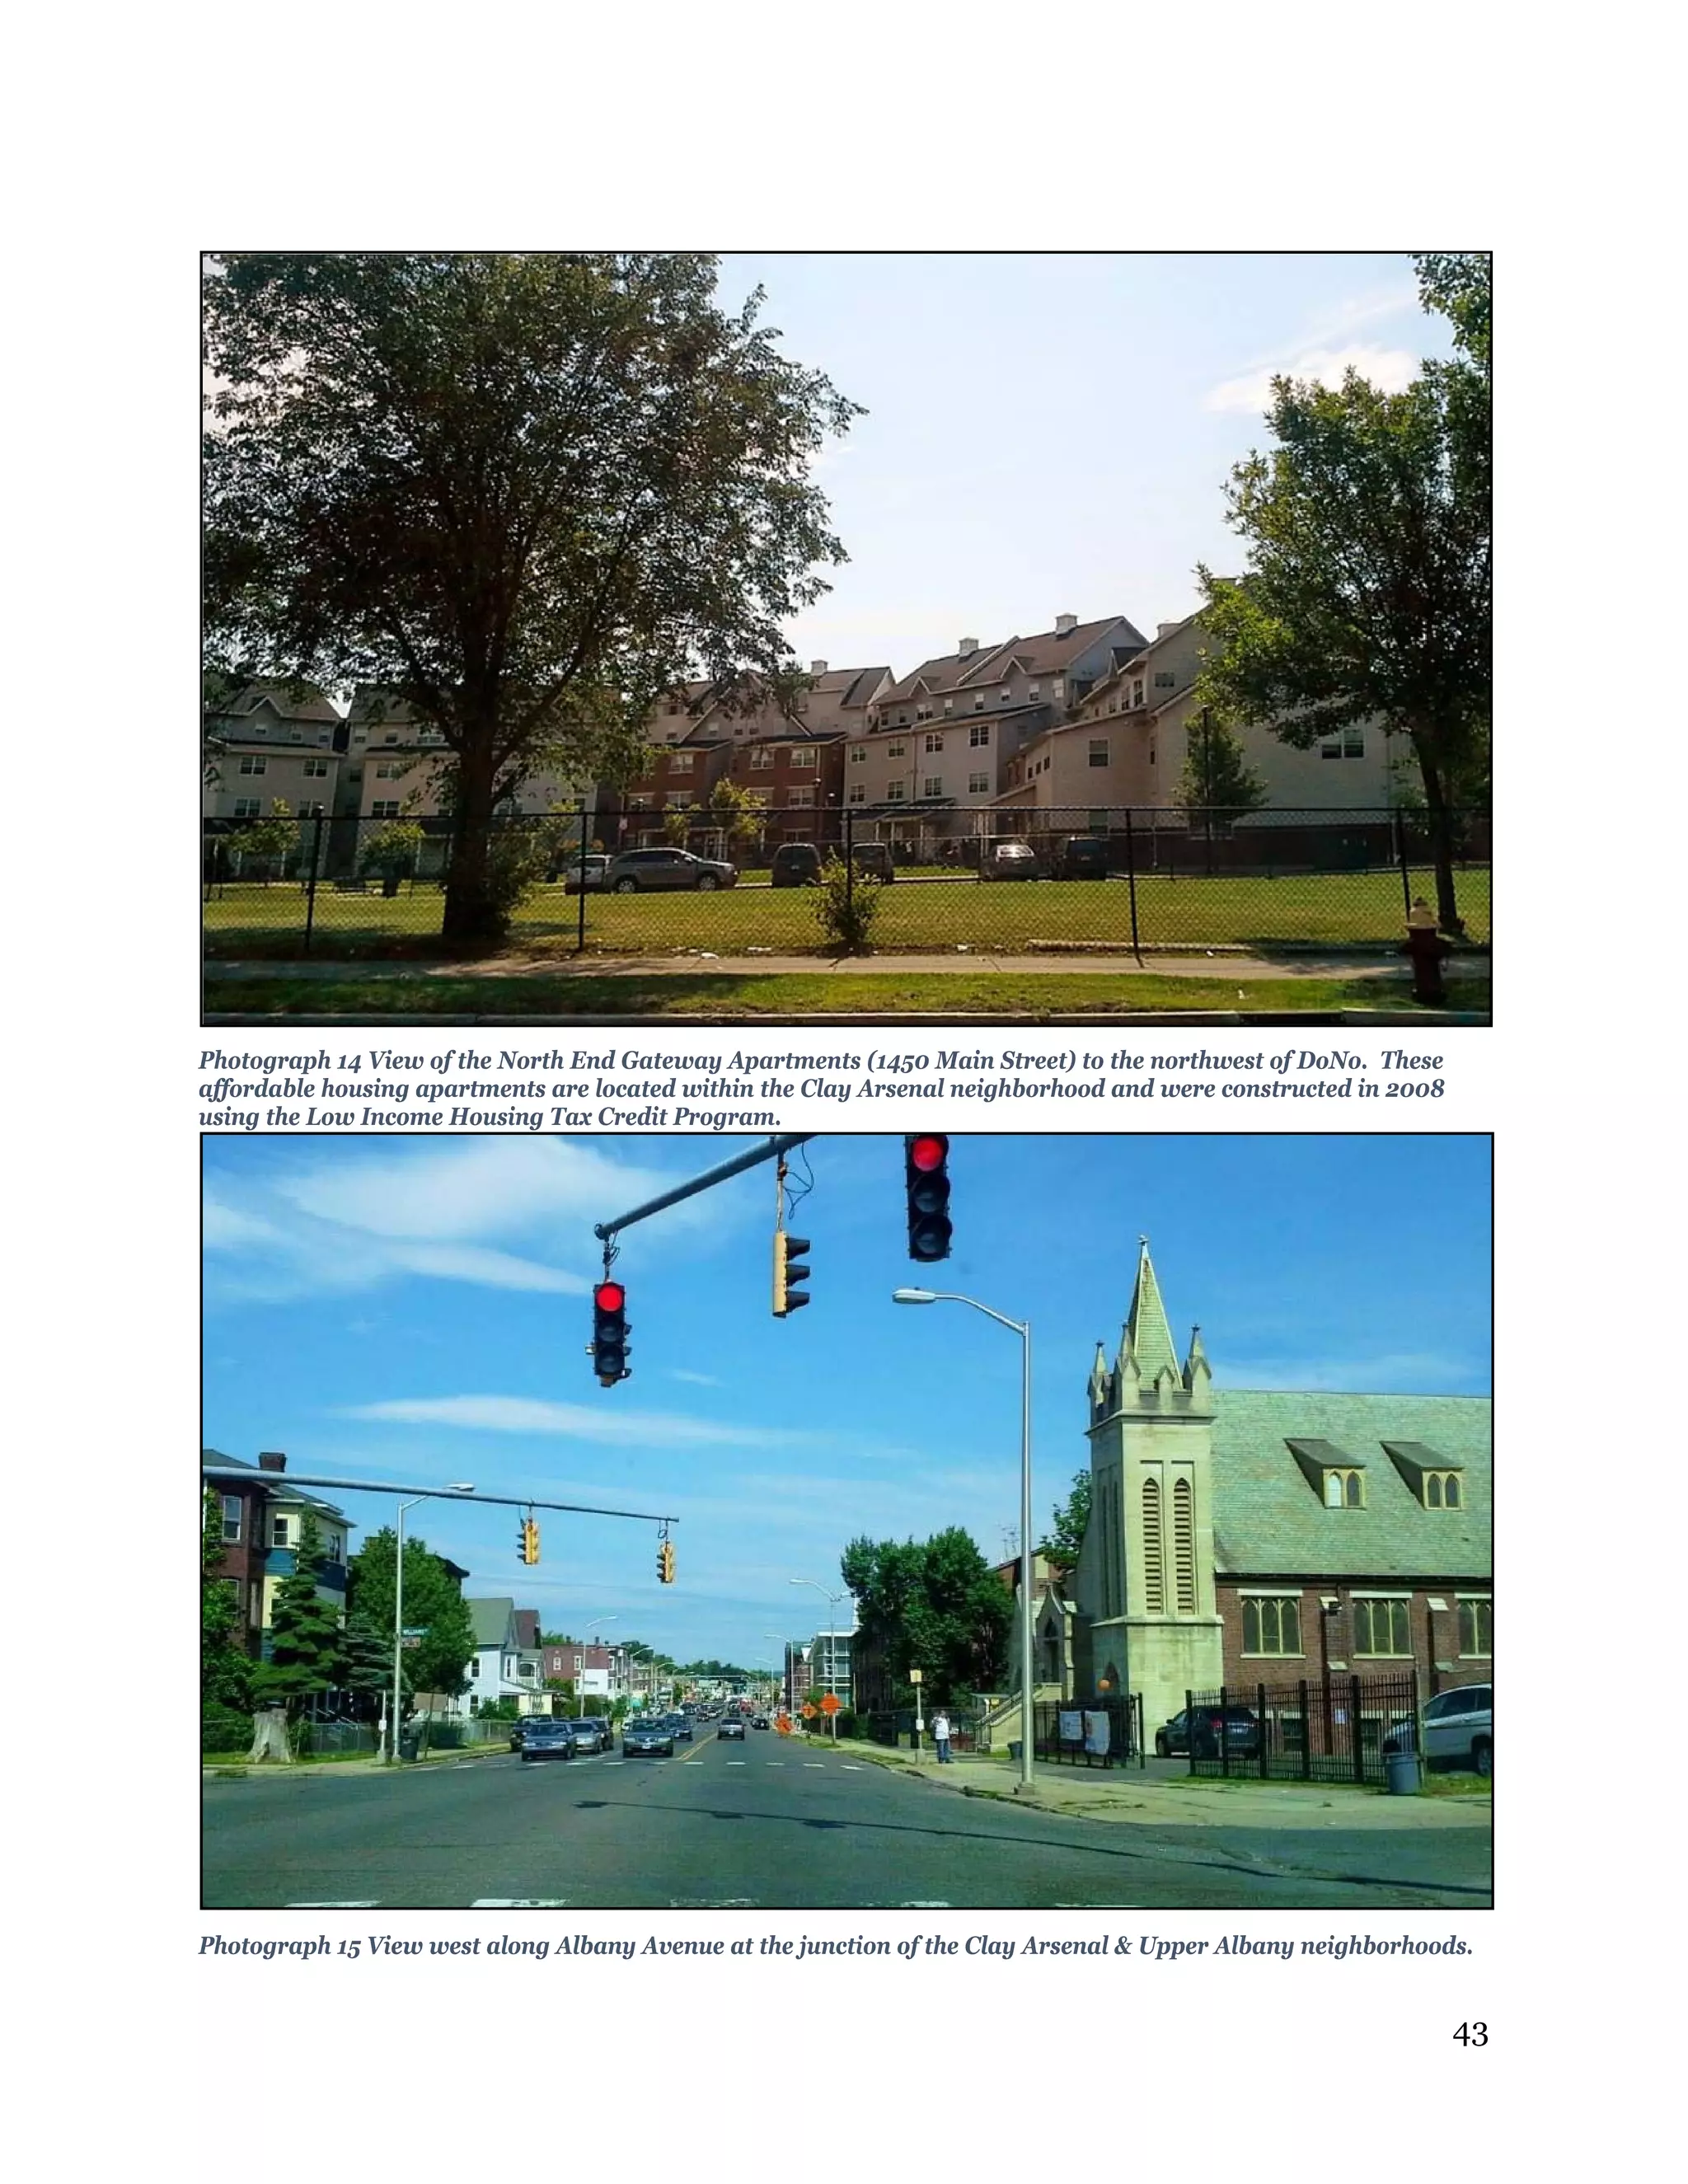
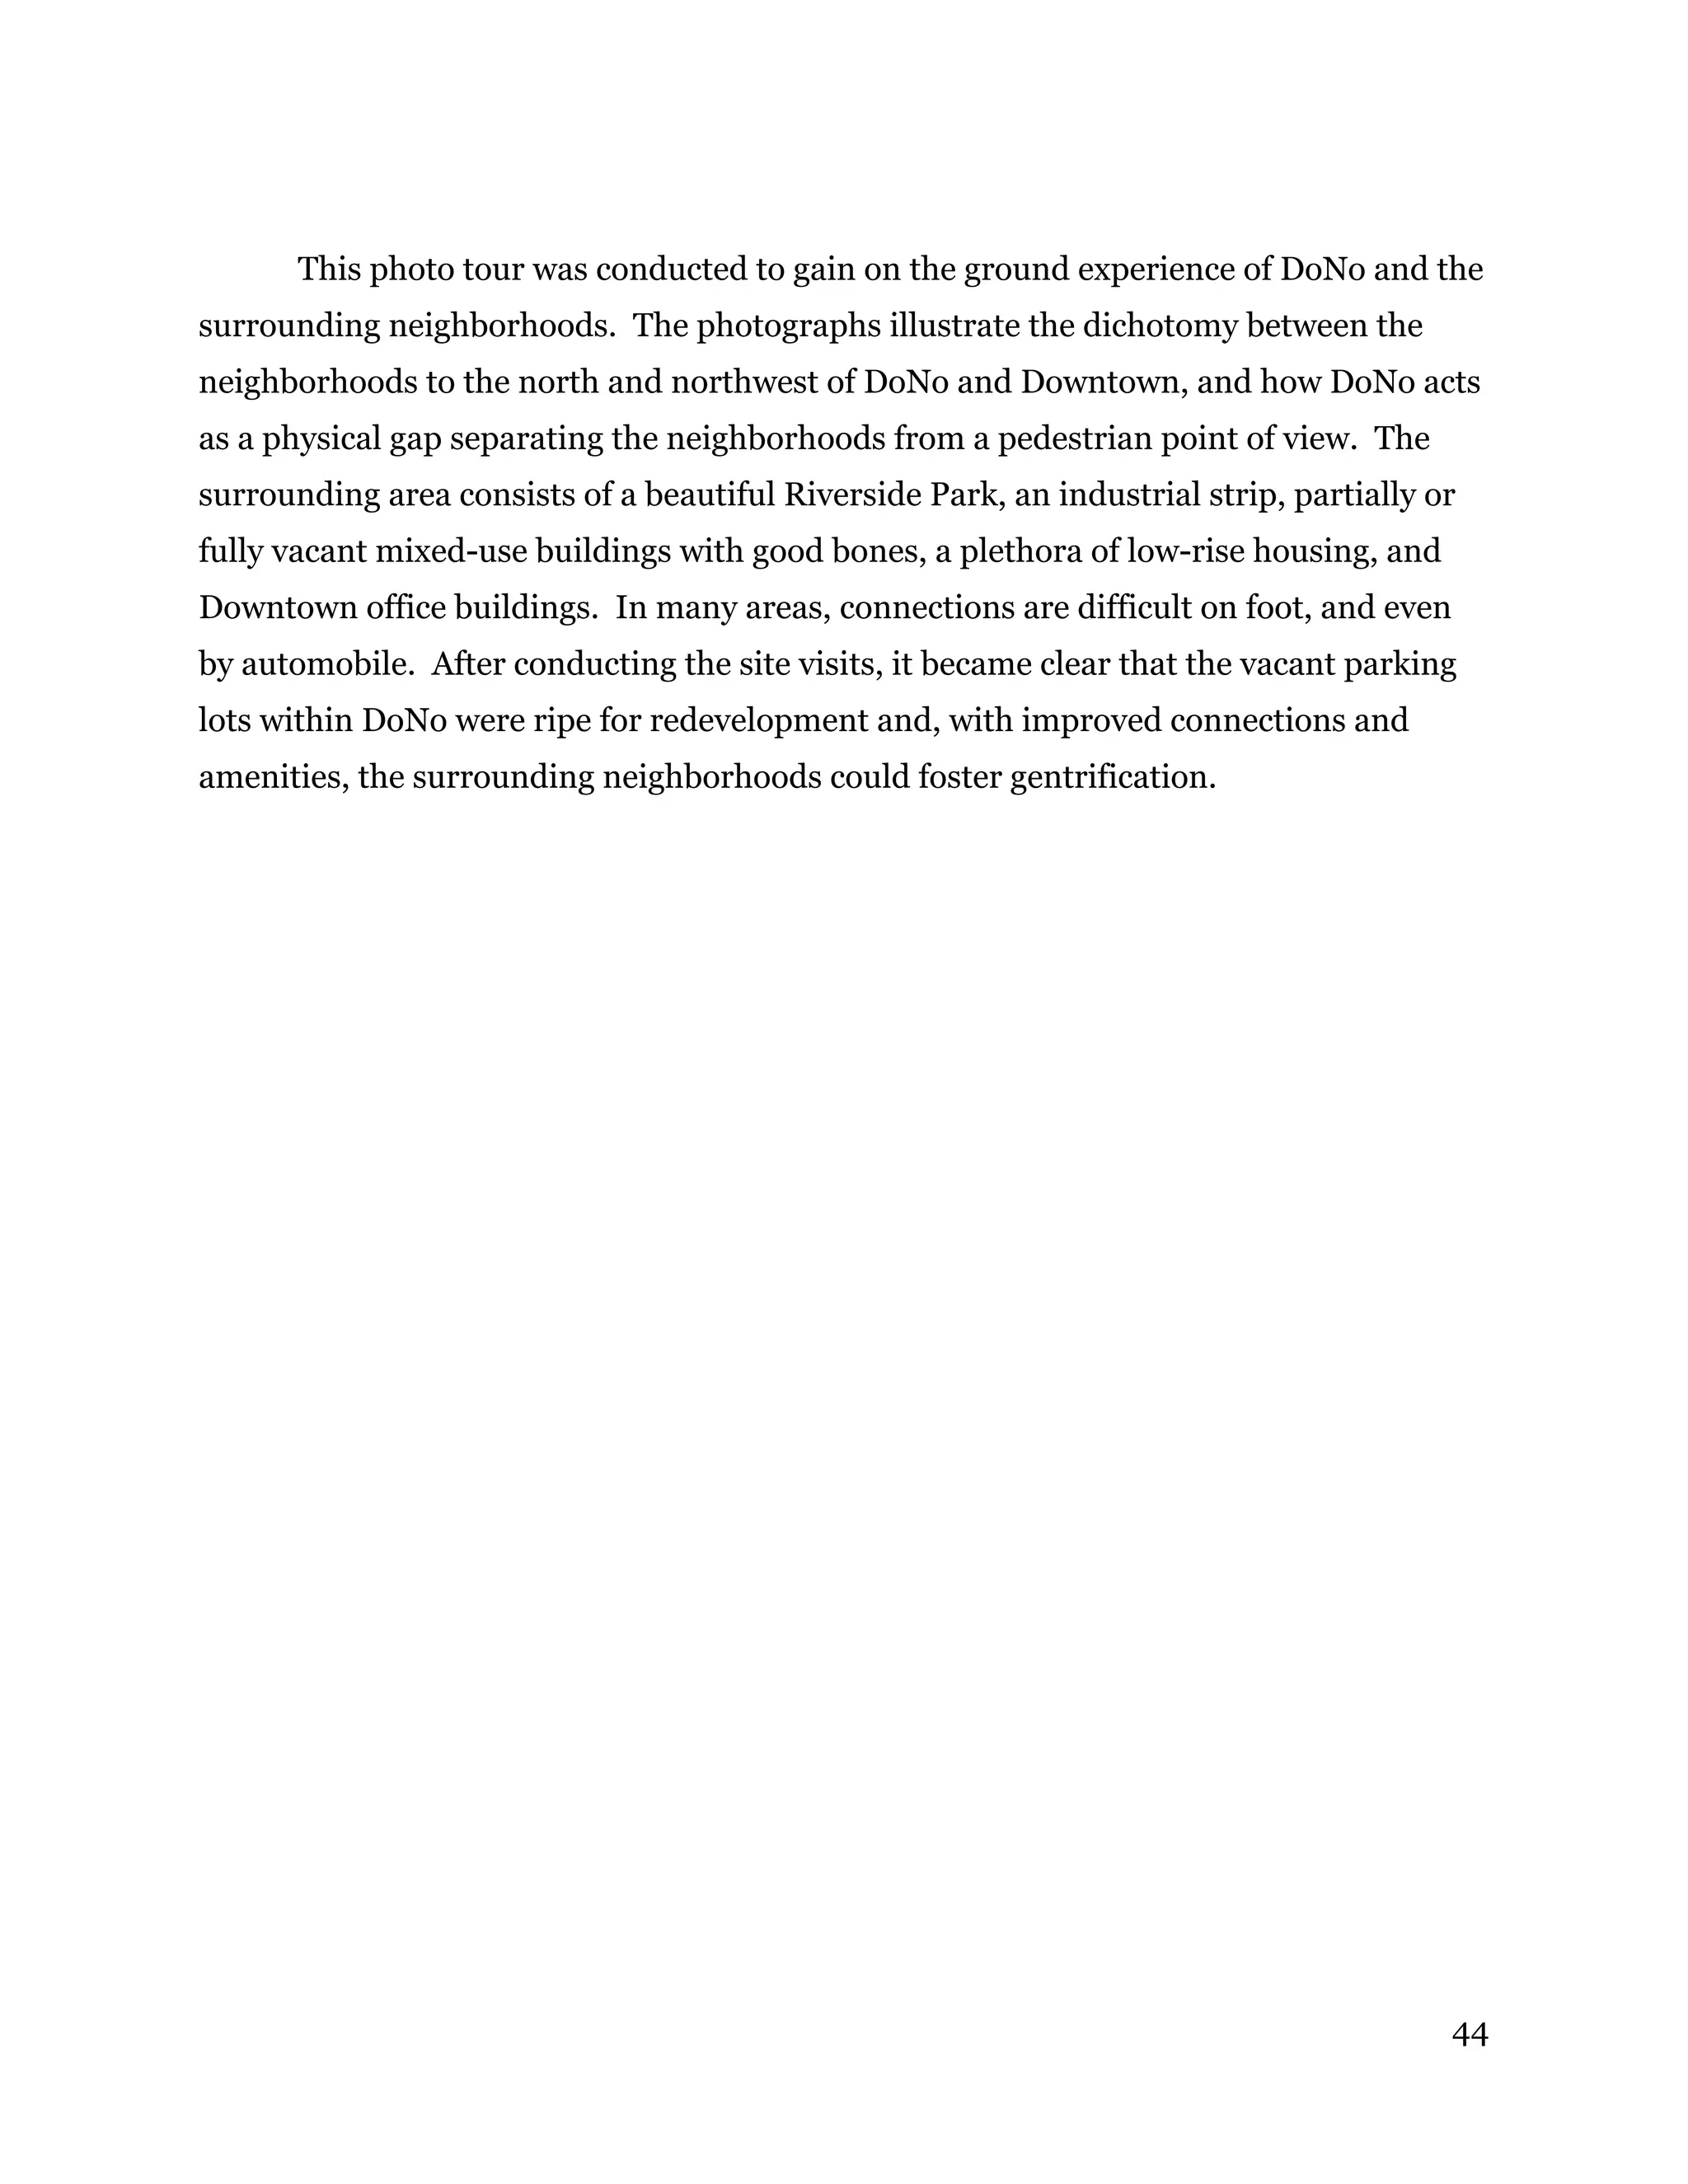
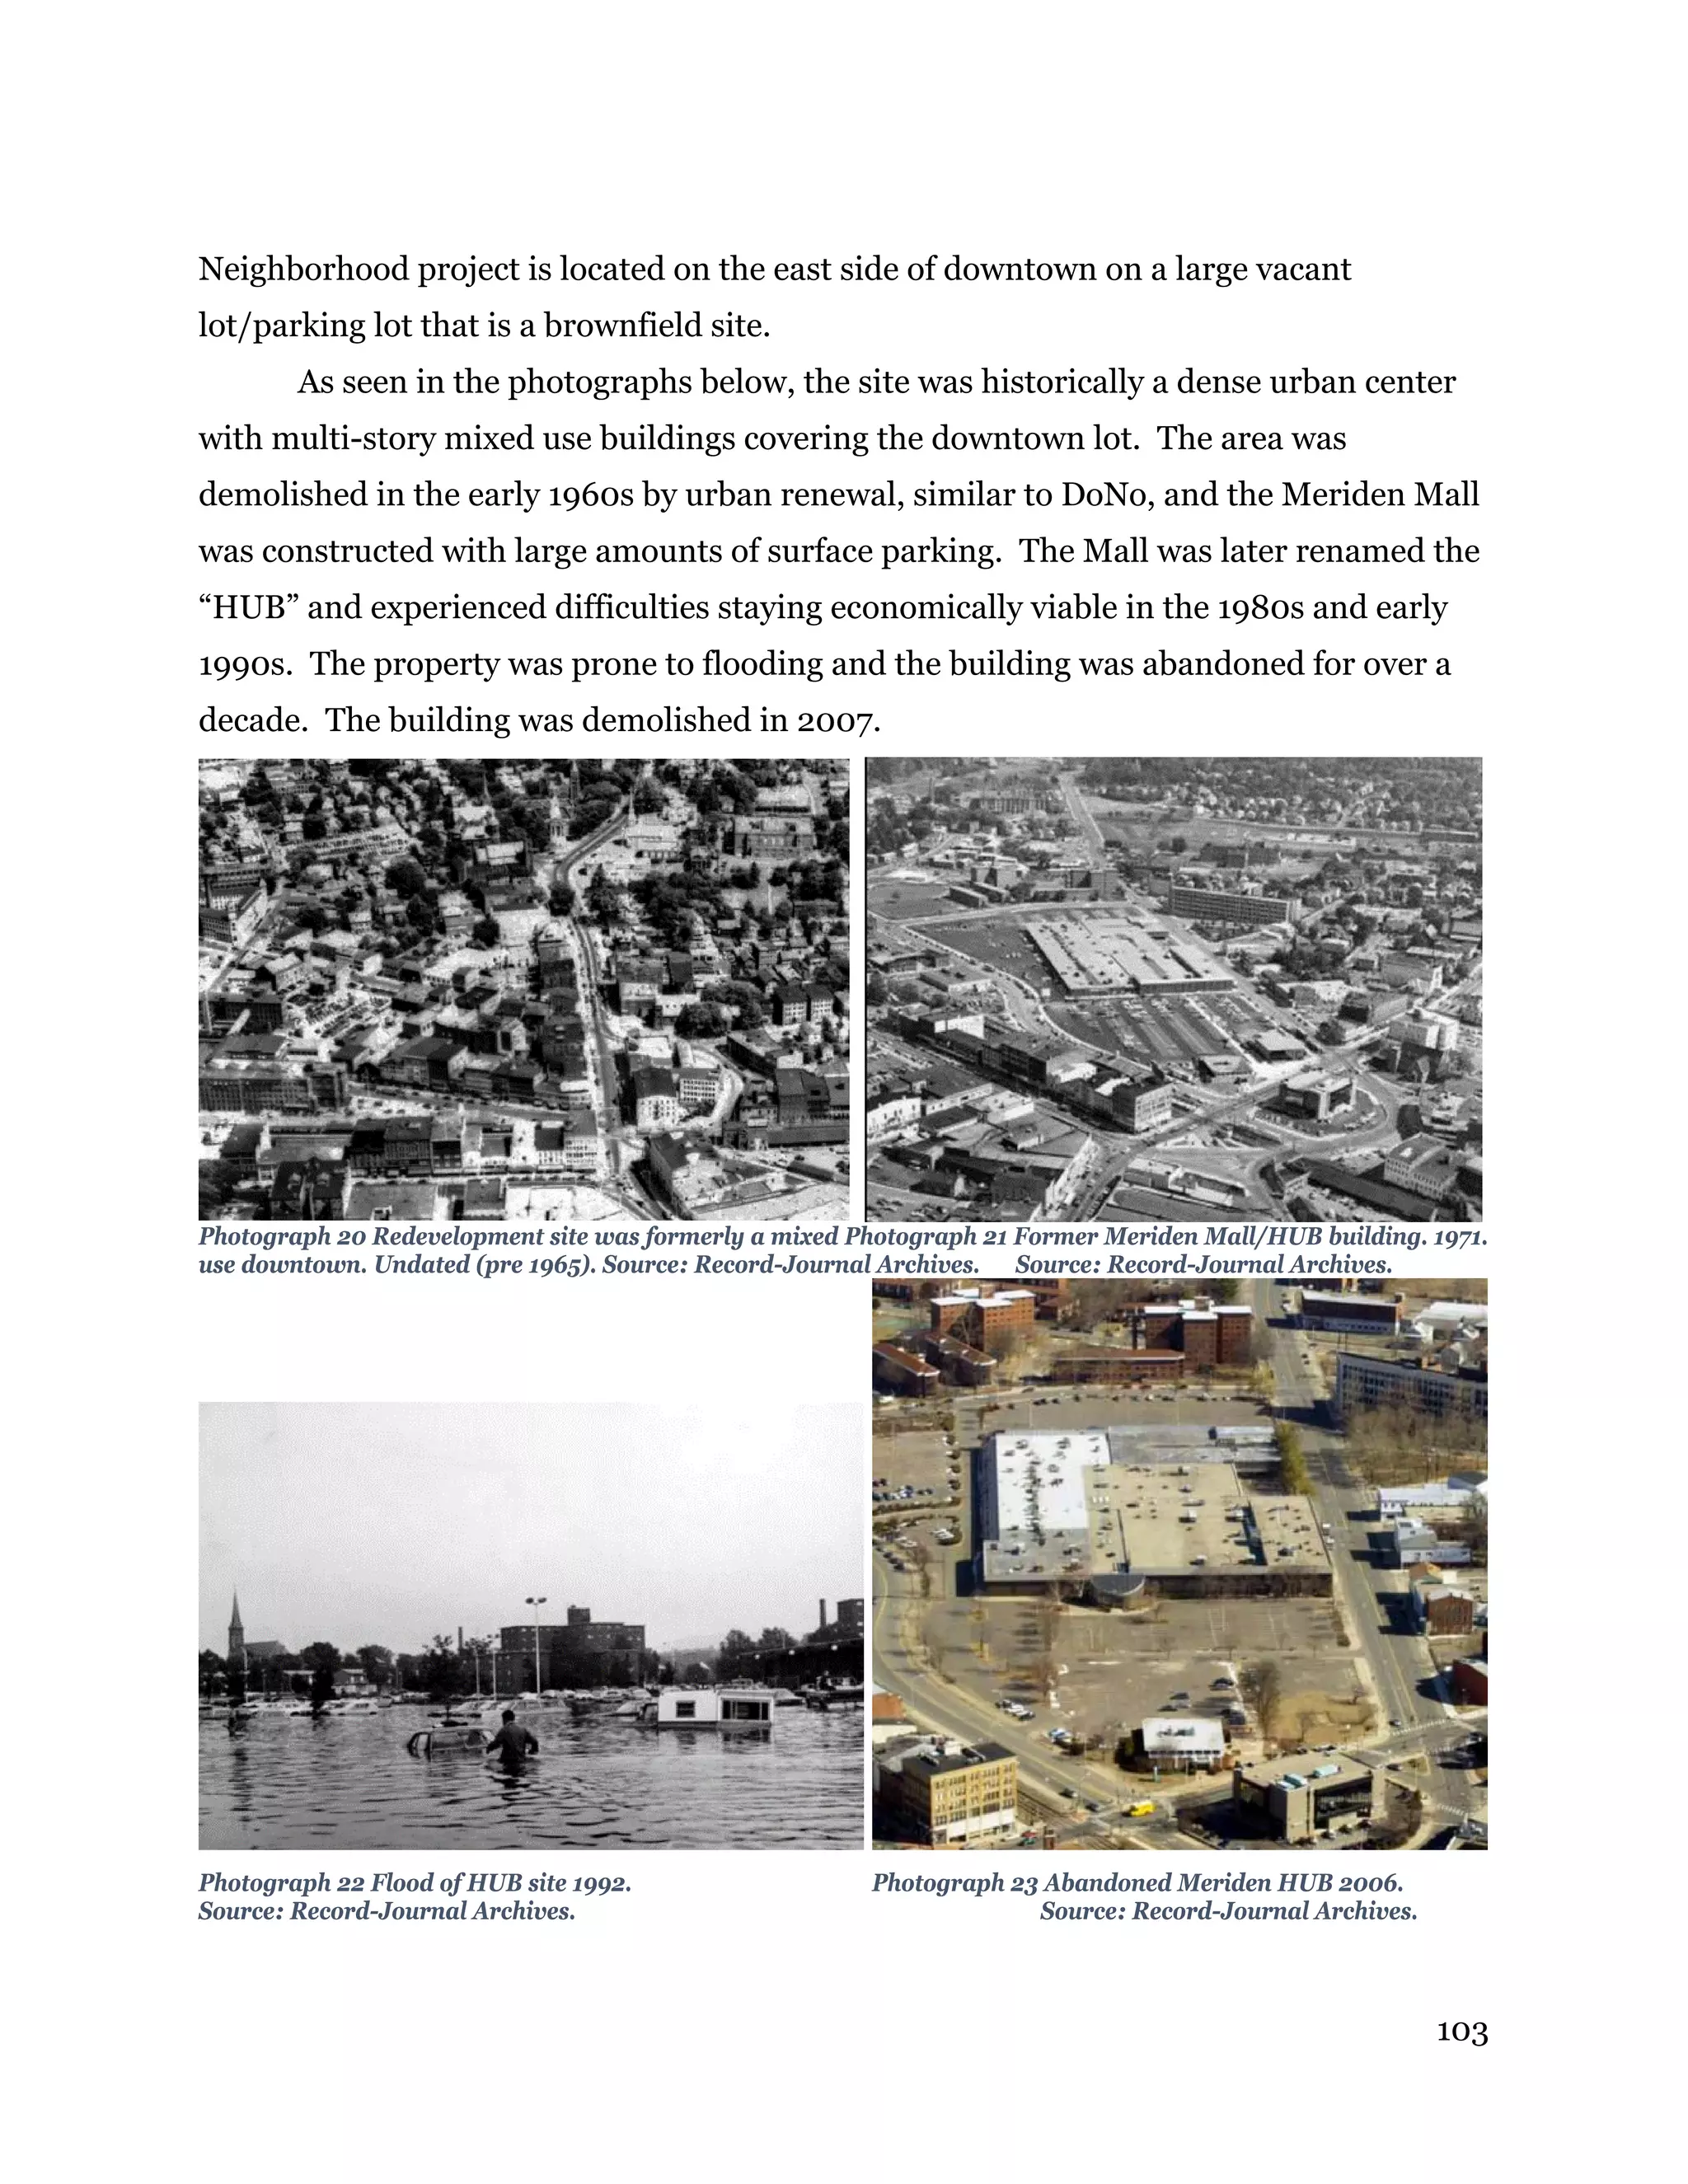
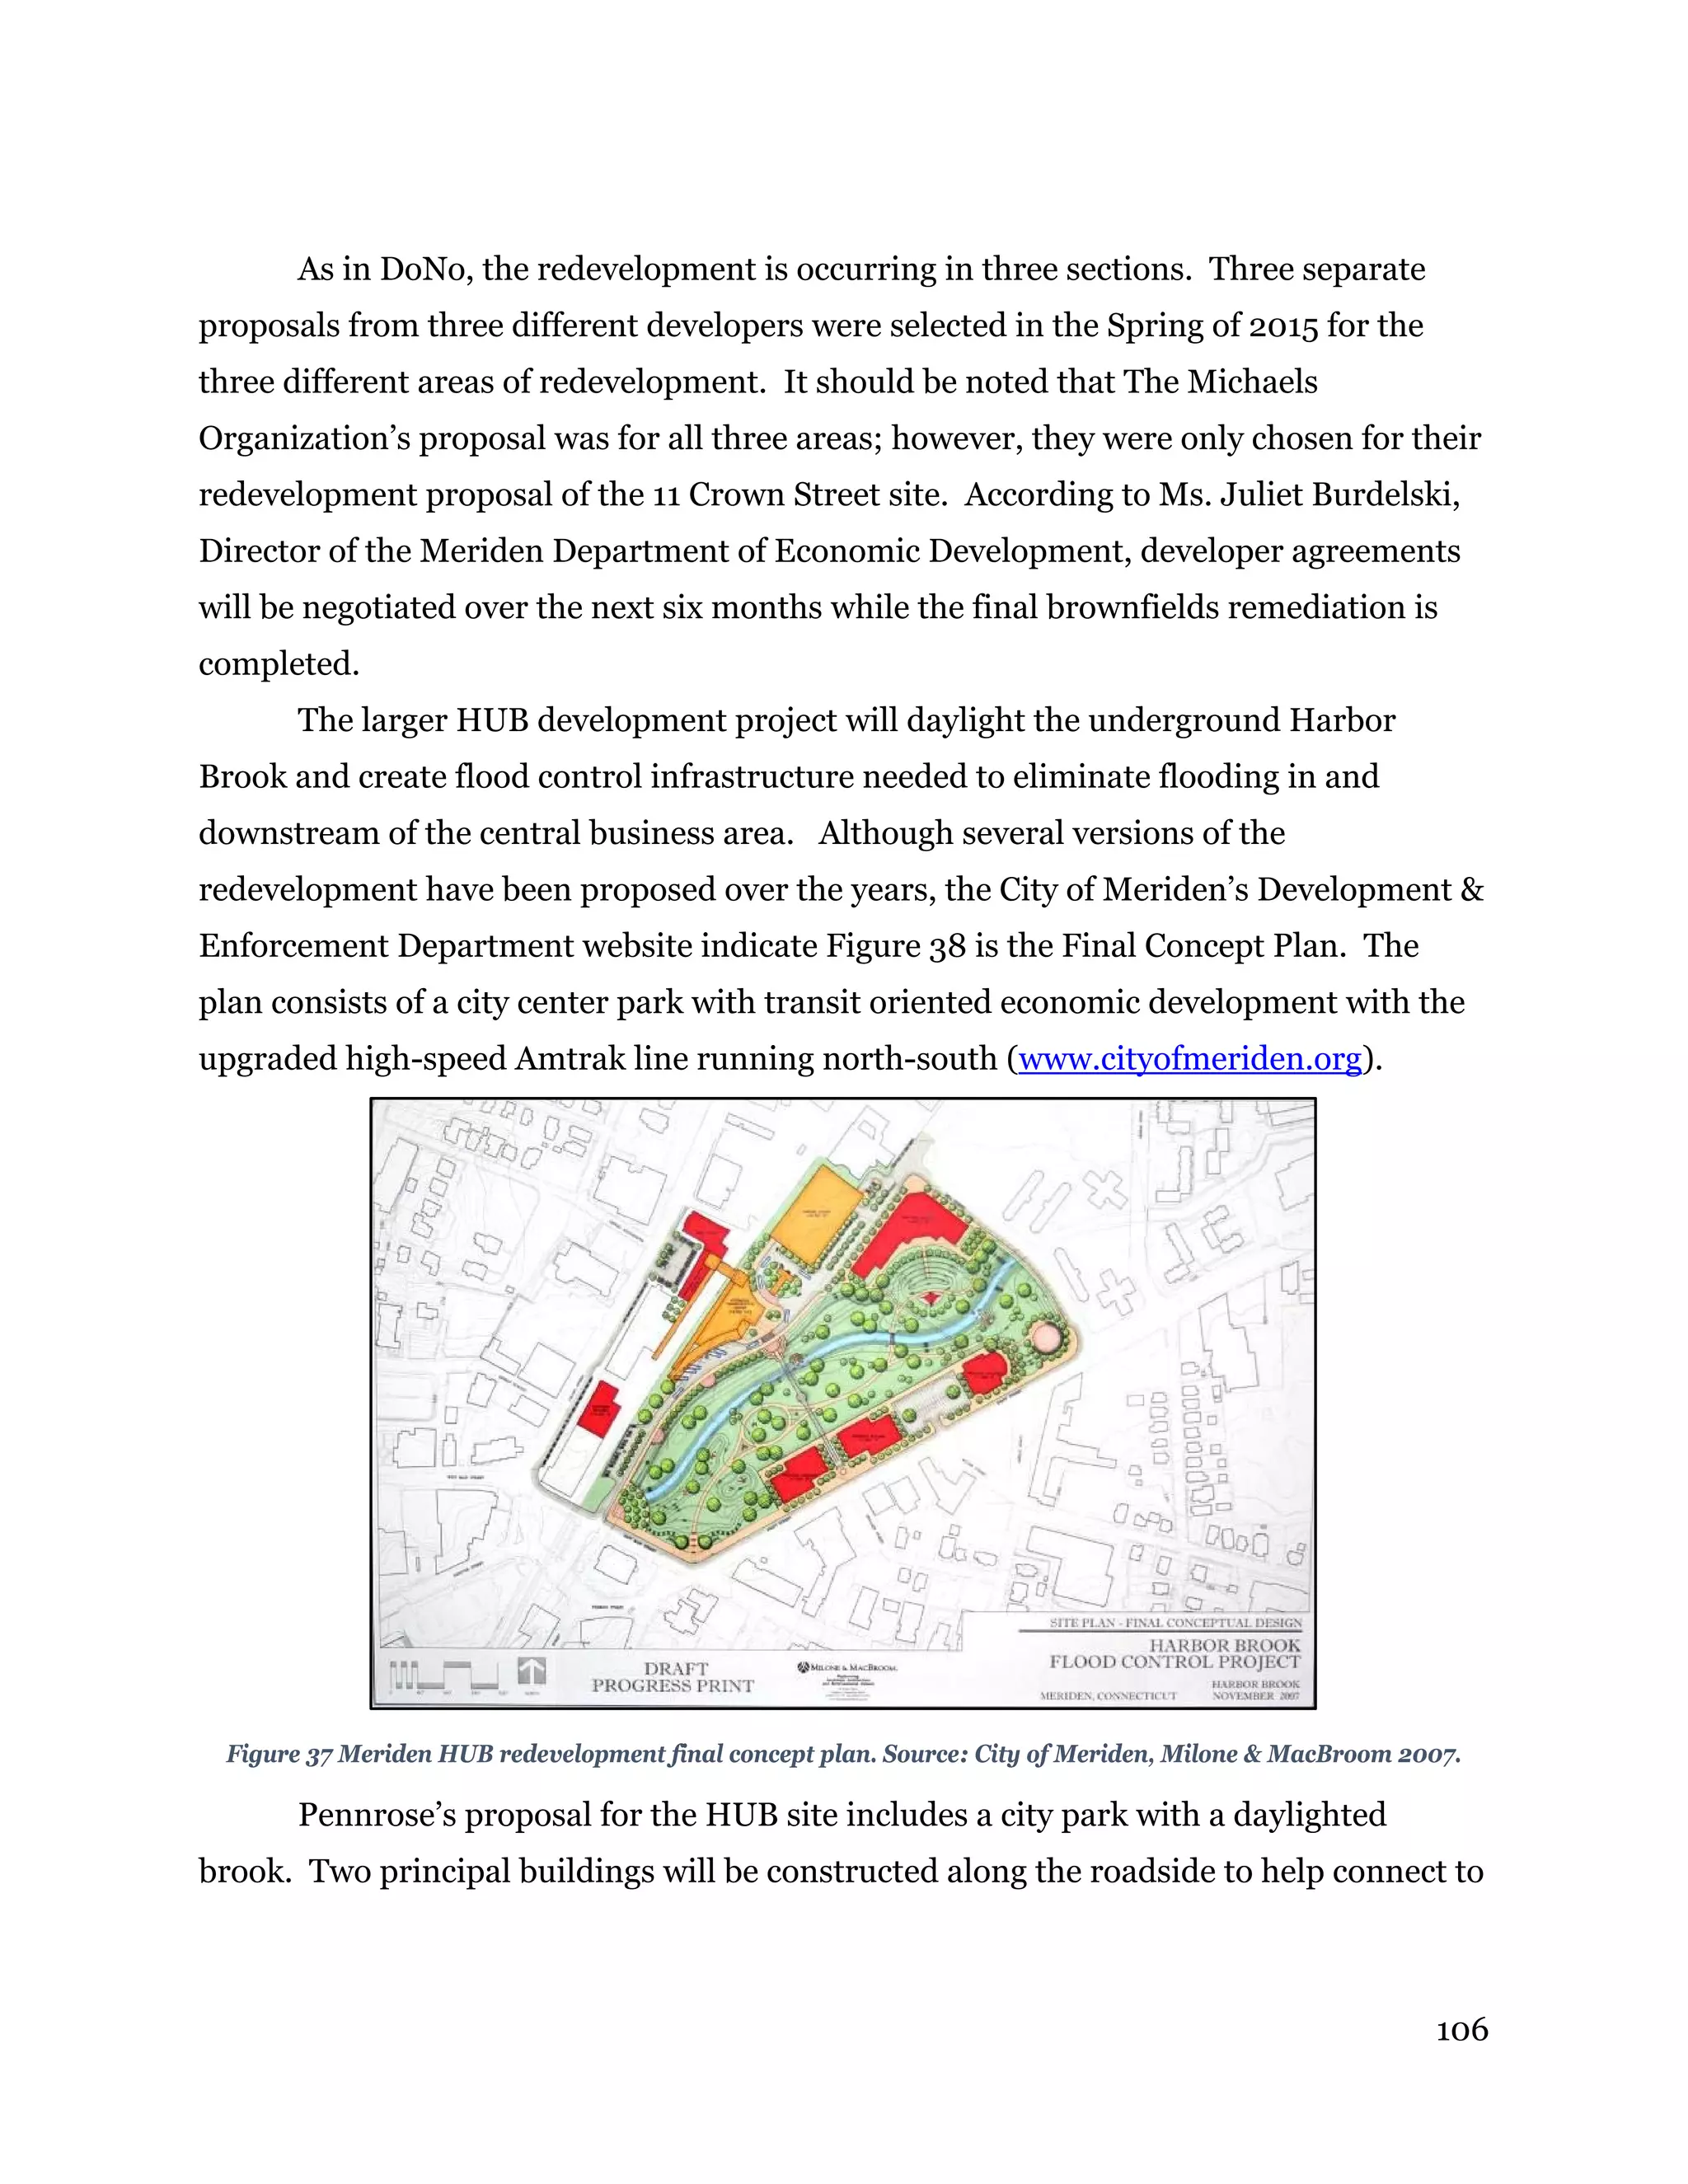
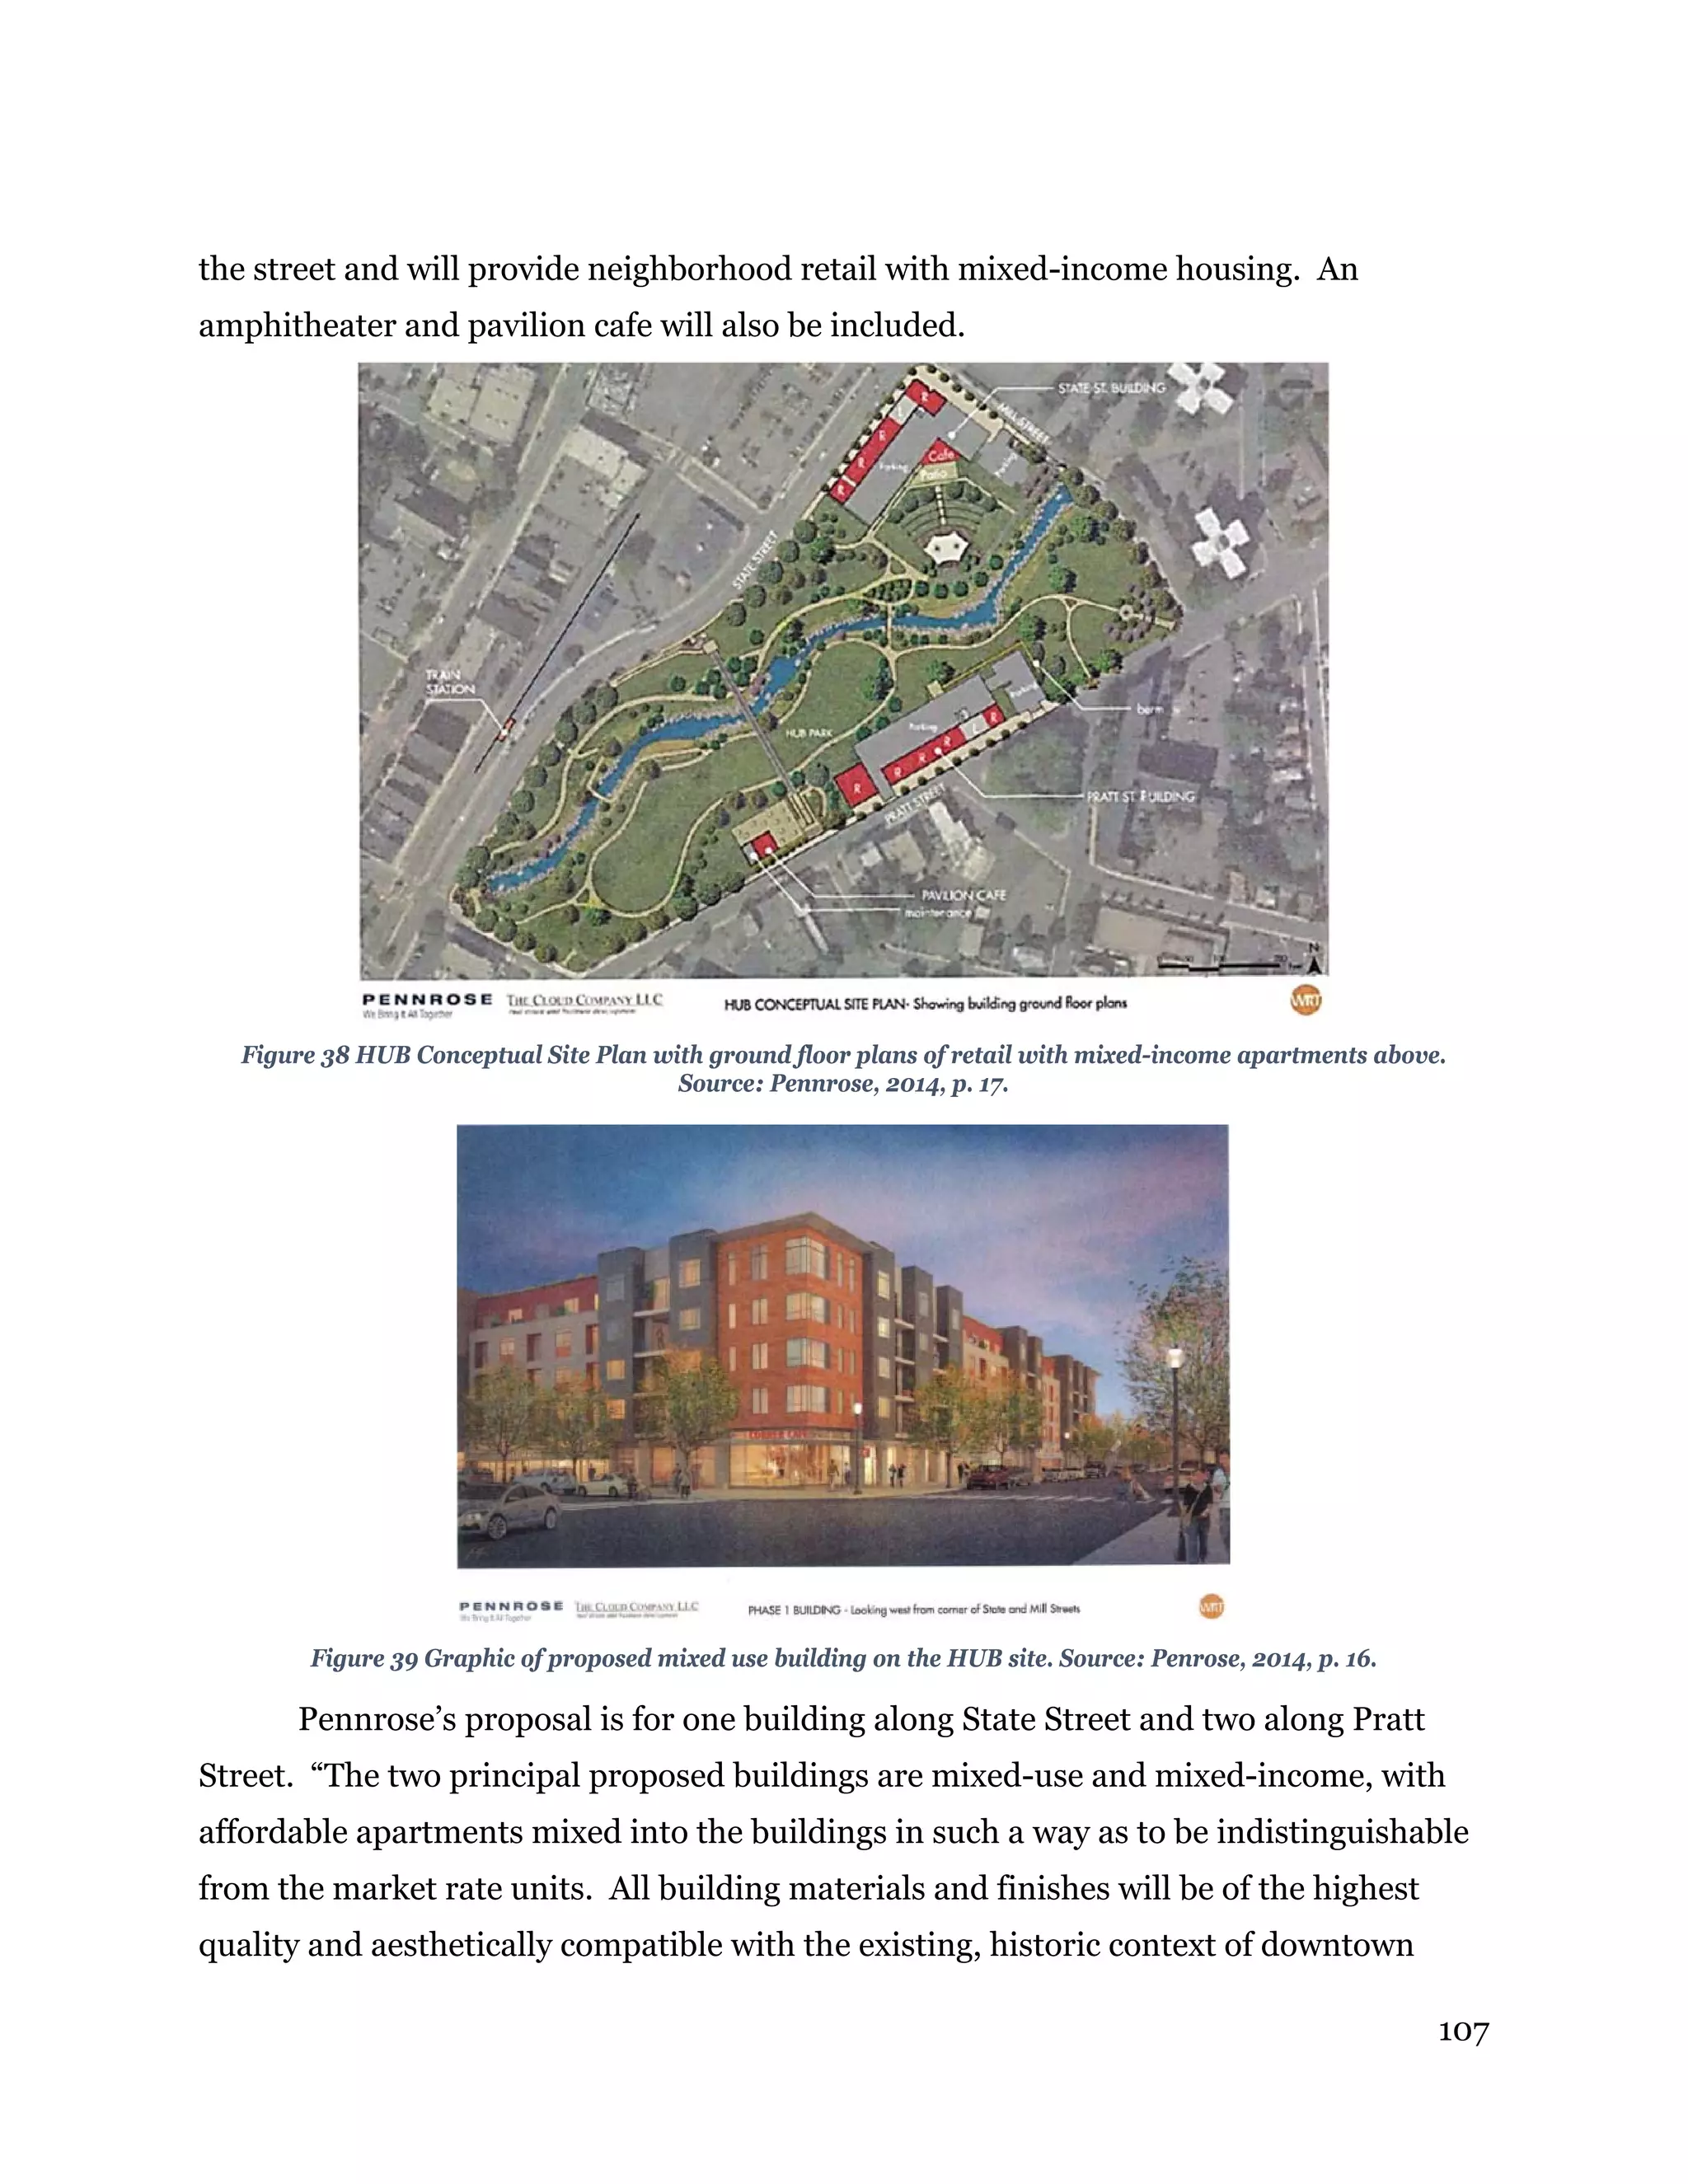
This document summarizes a master's project analyzing how Hartford, Connecticut's Downtown North/Downtown West Master Plan may affect surrounding neighborhoods. It includes an analysis of existing socioeconomic conditions in the neighborhoods, a review of literature on gentrification and housing policy, a summary of the master plan, analysis of redevelopment proposals for two areas prioritized in the plan, and rubrics comparing Hartford to case studies of redevelopment in Waterbury and Meriden, Connecticut. Recommendations are provided to address potential gentrification impacts.

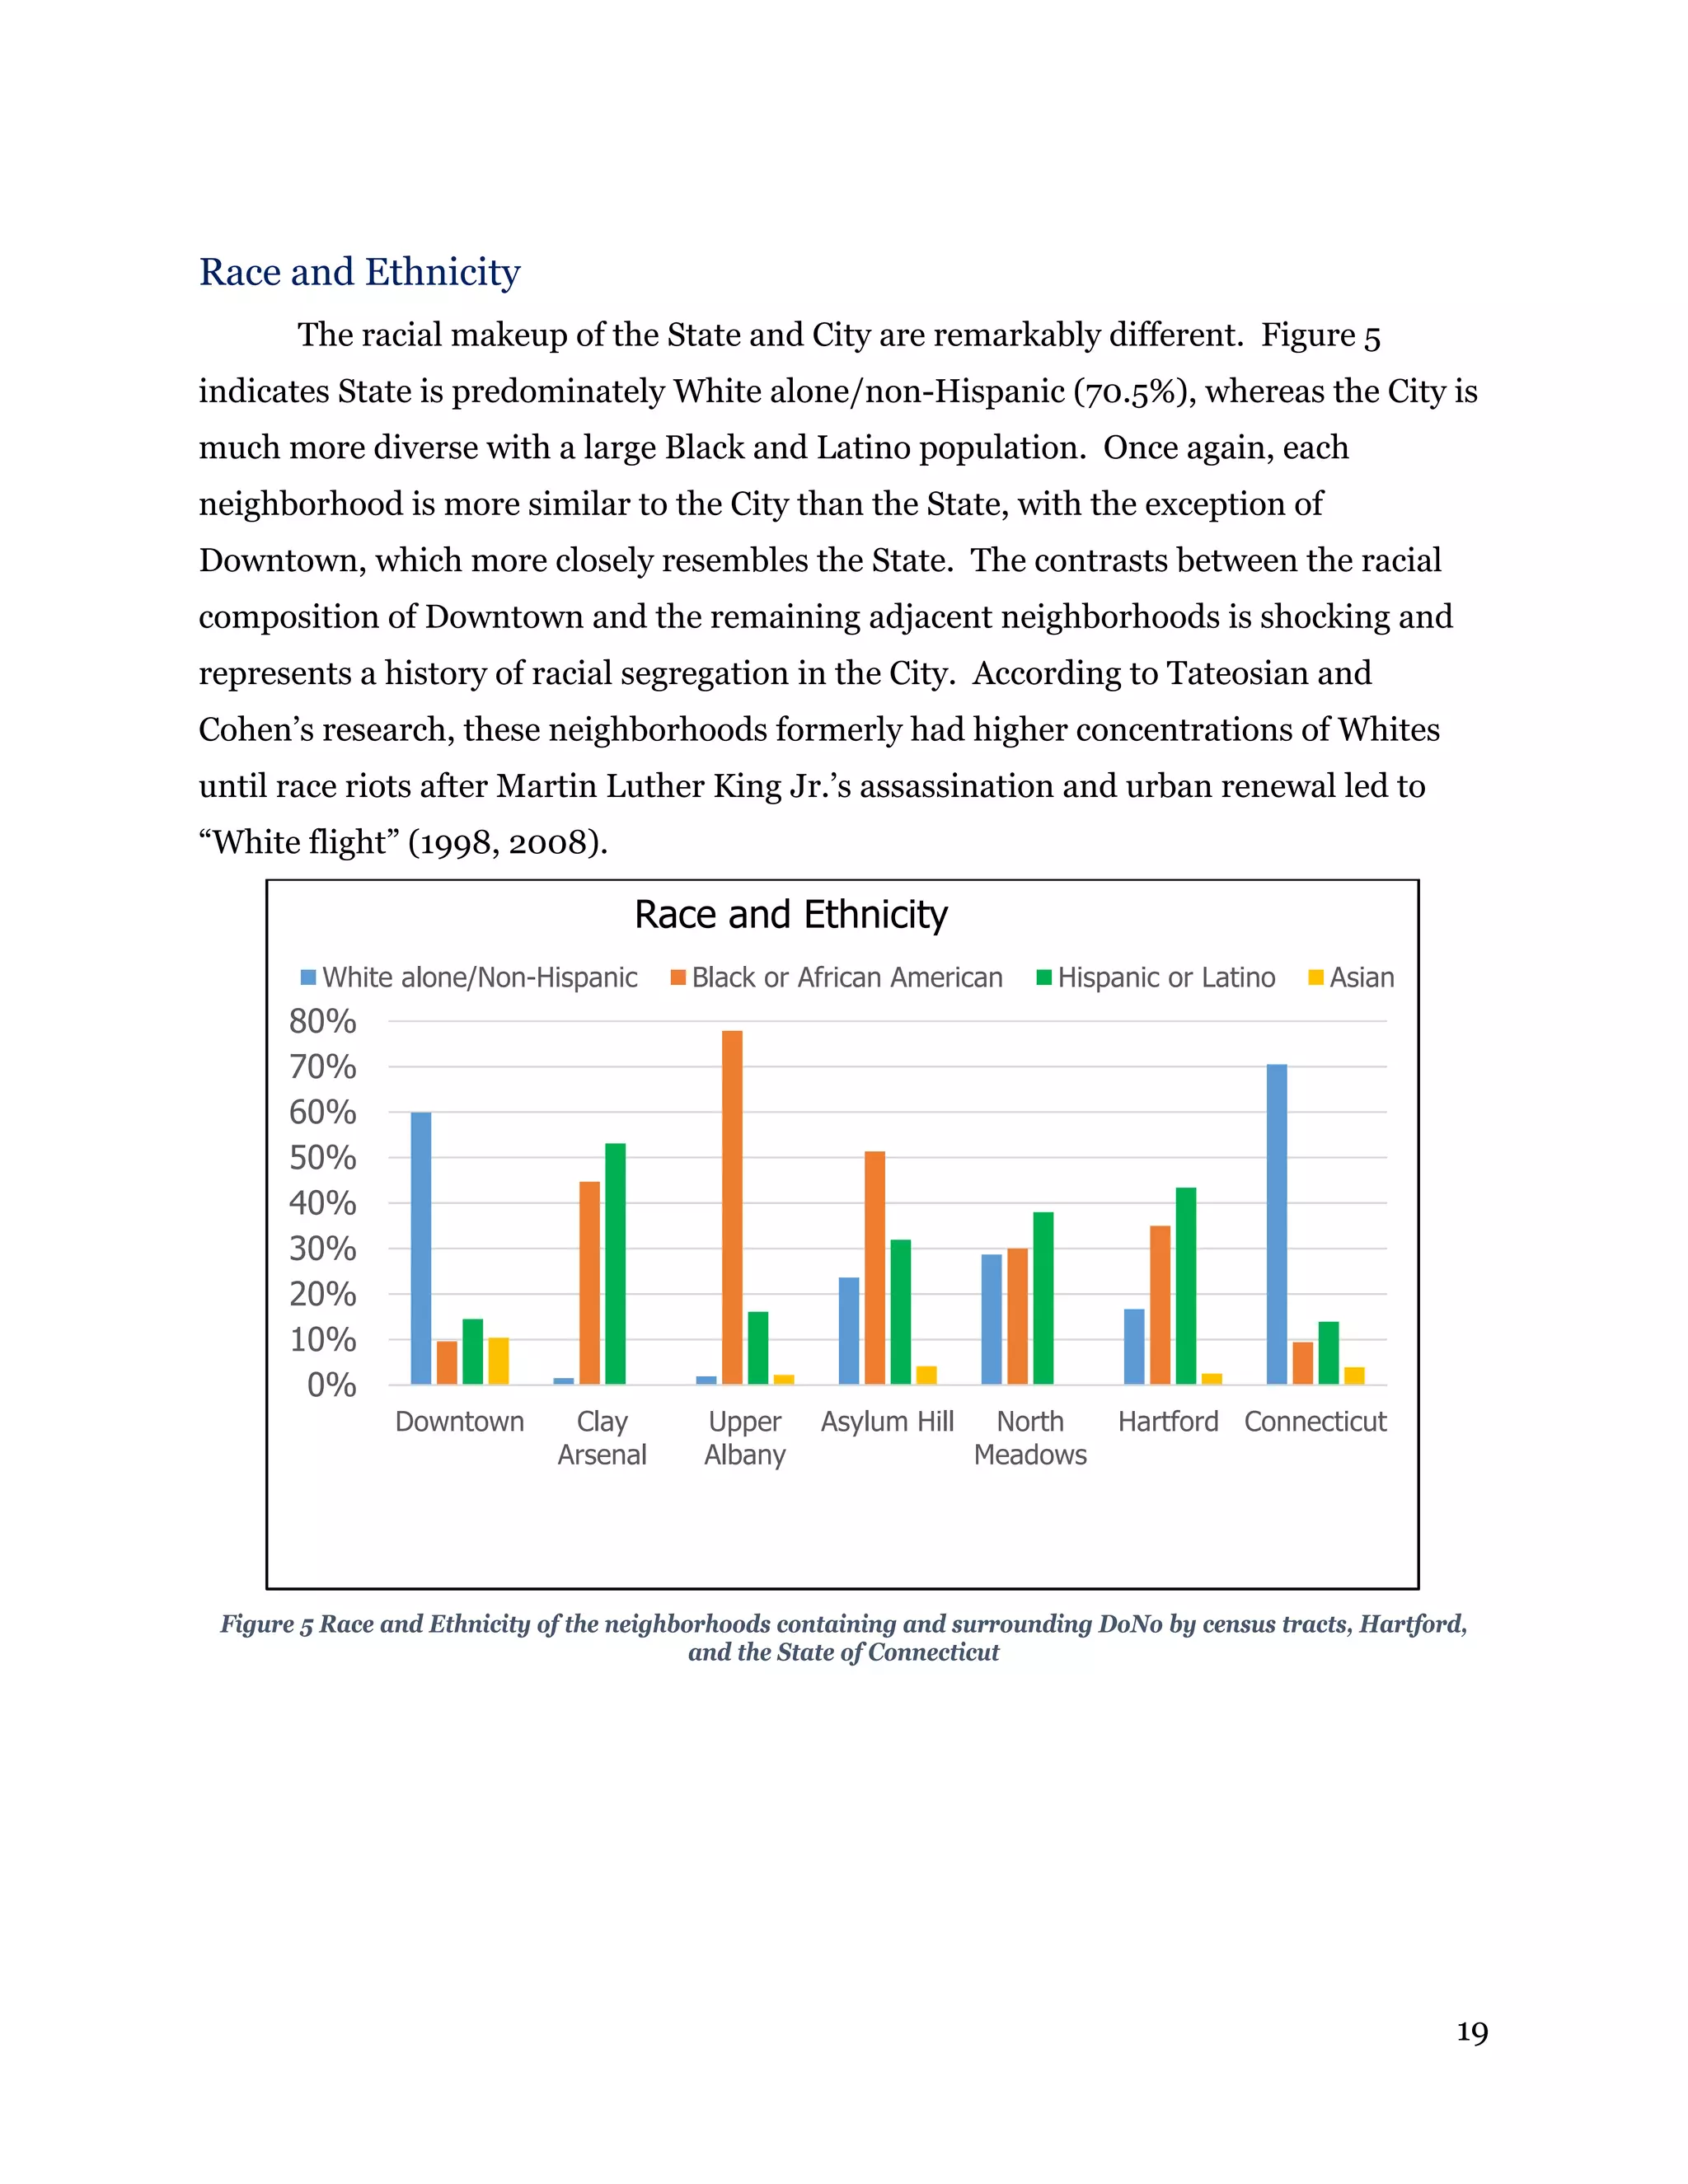
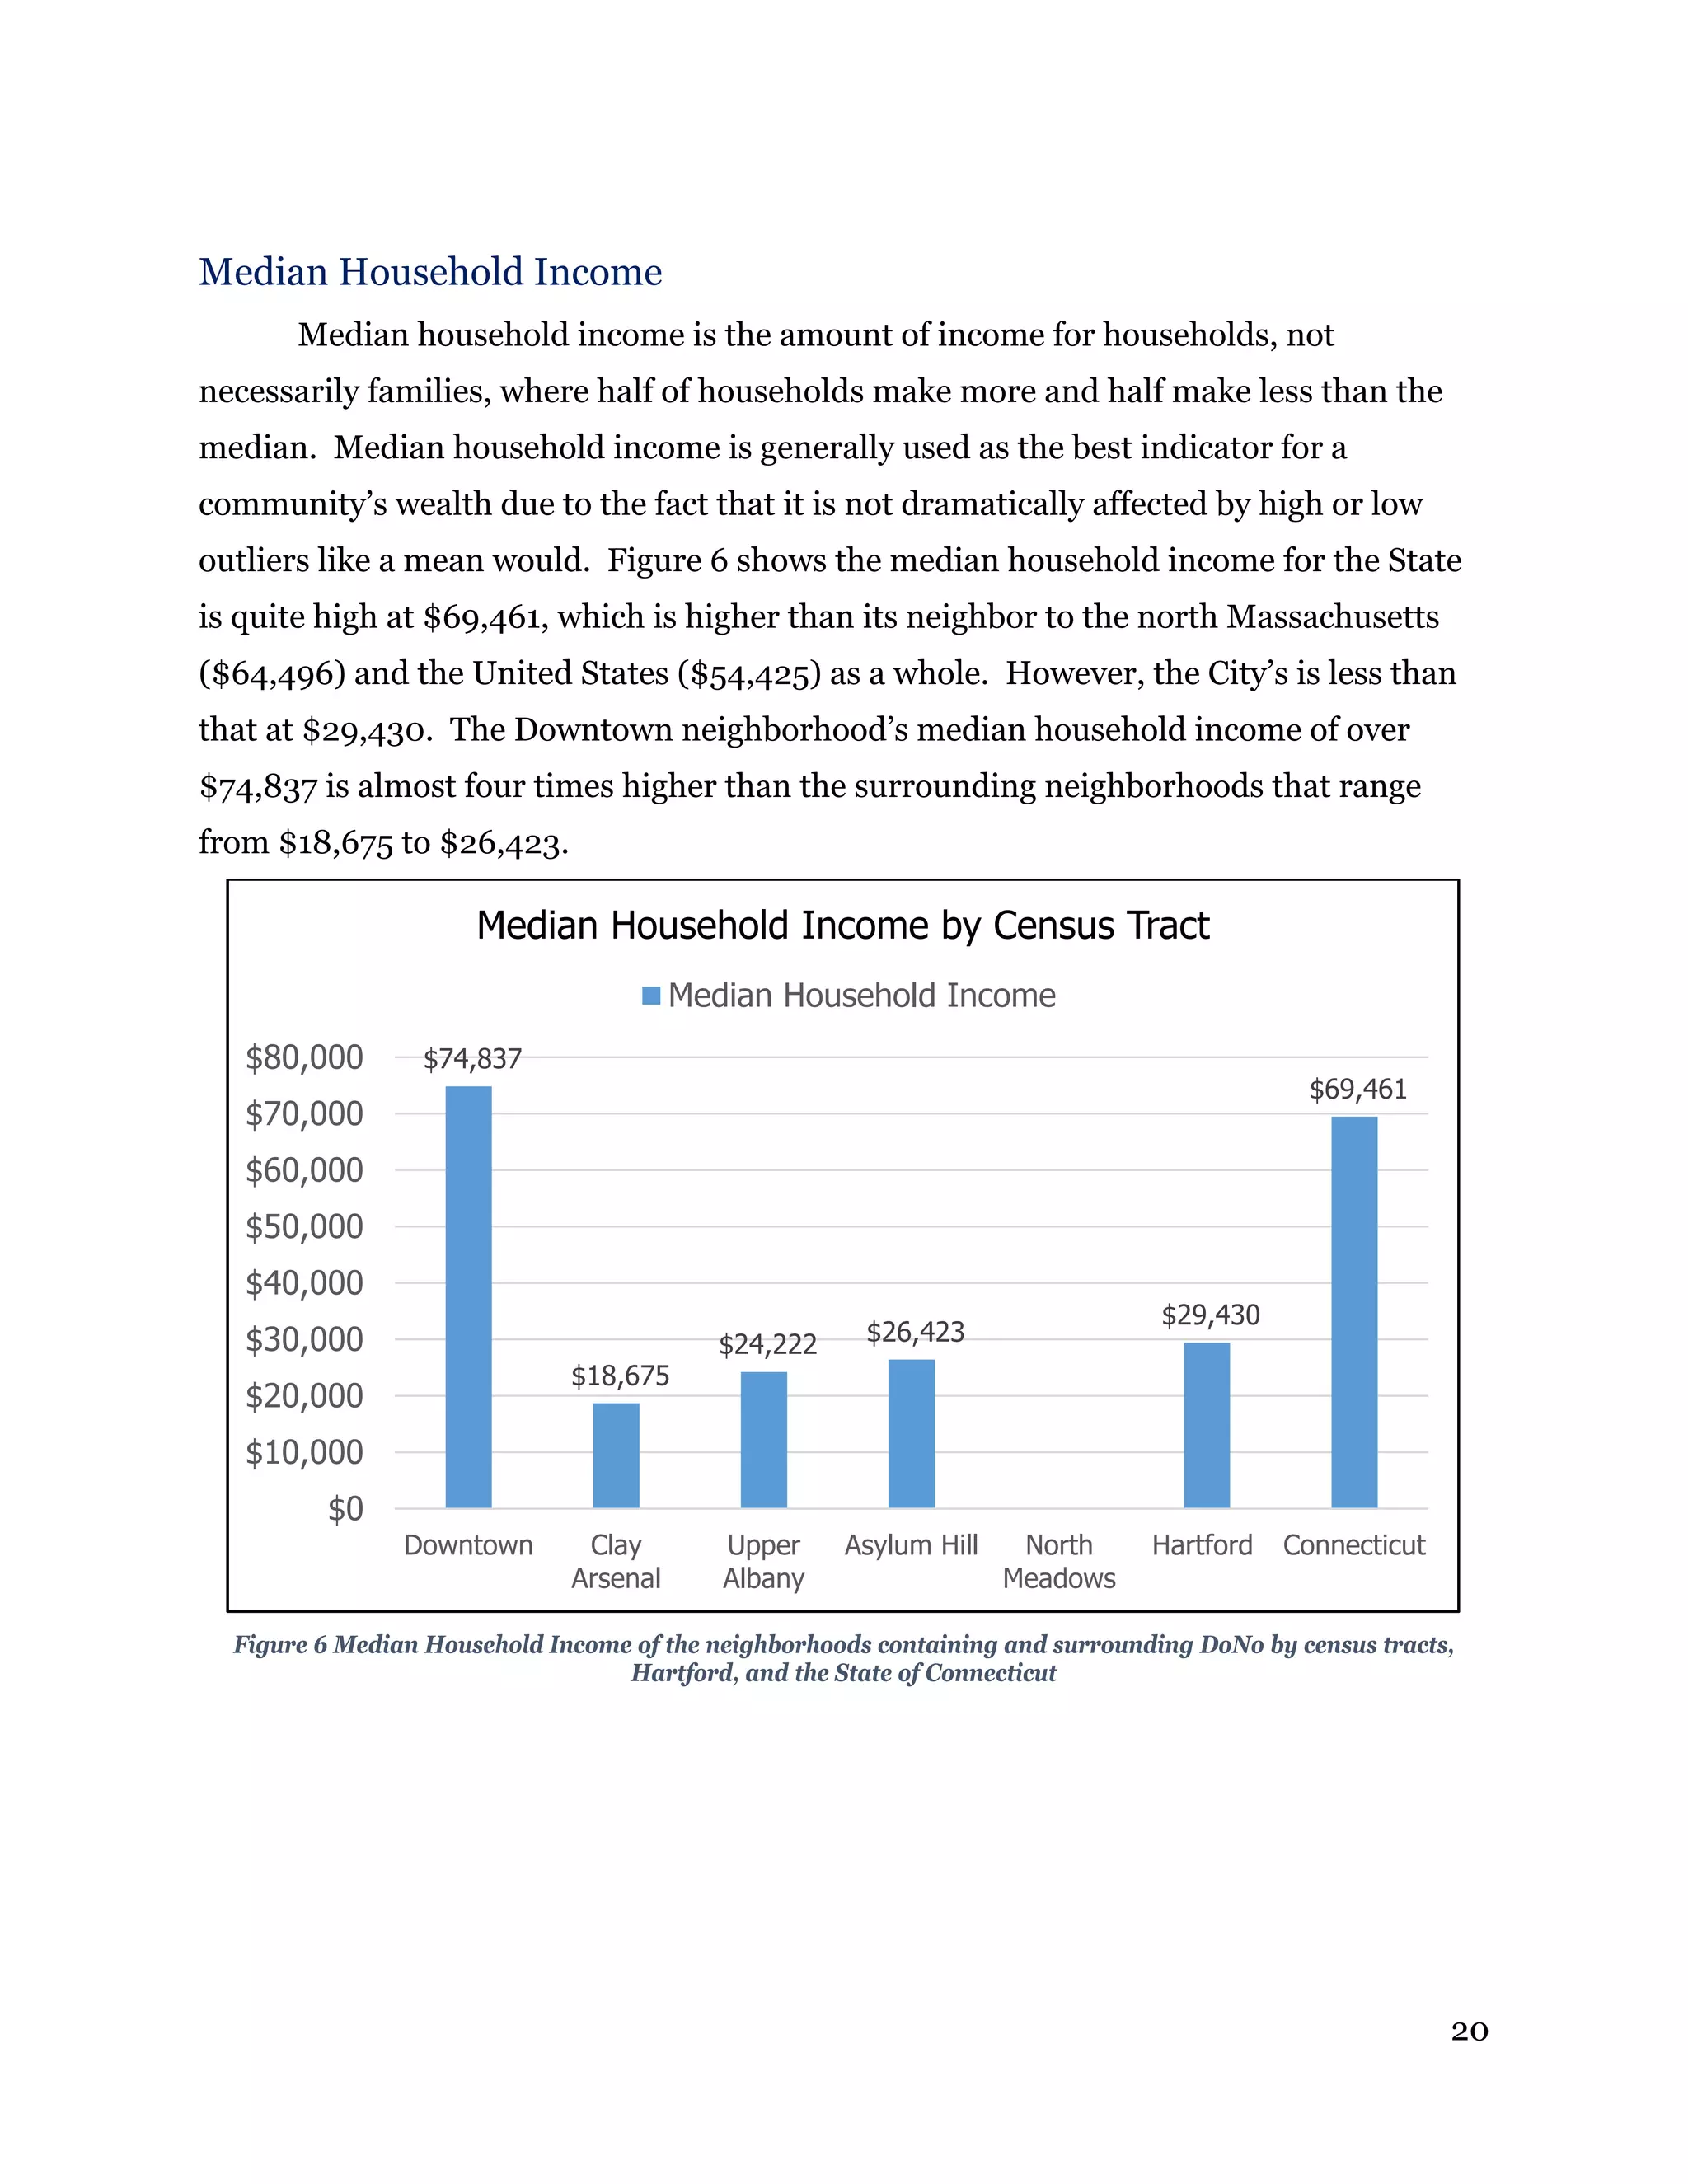
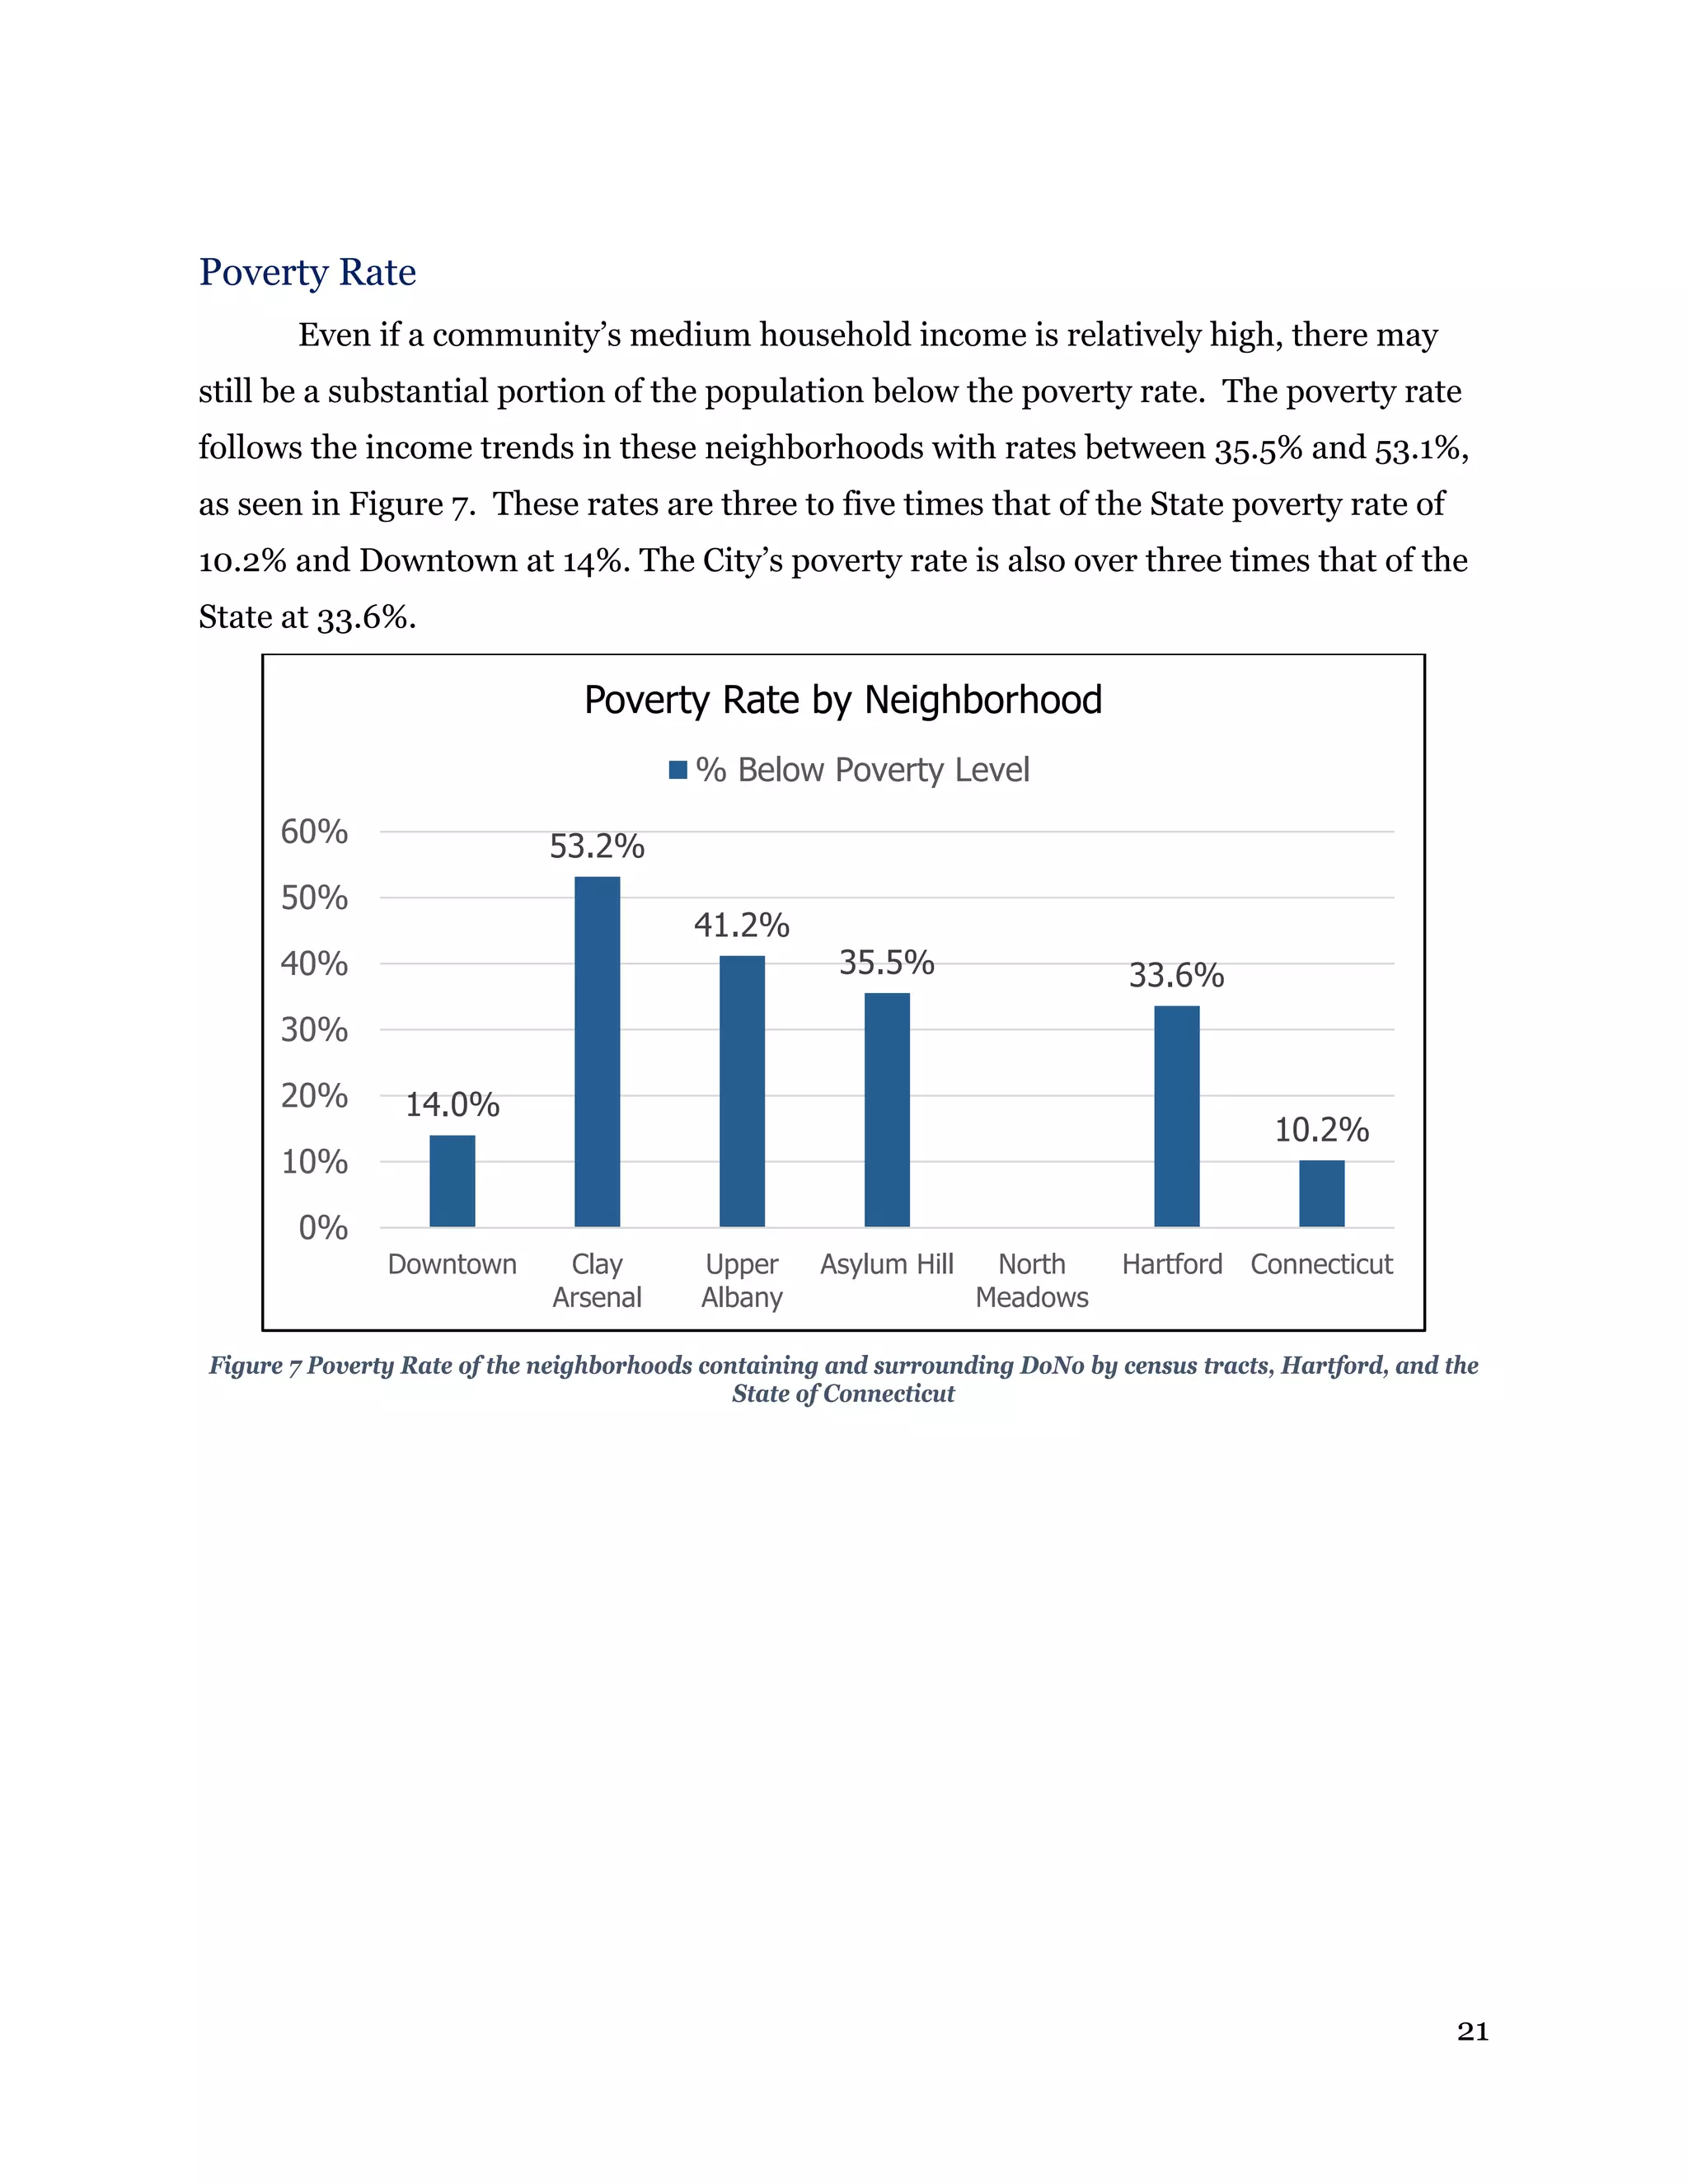
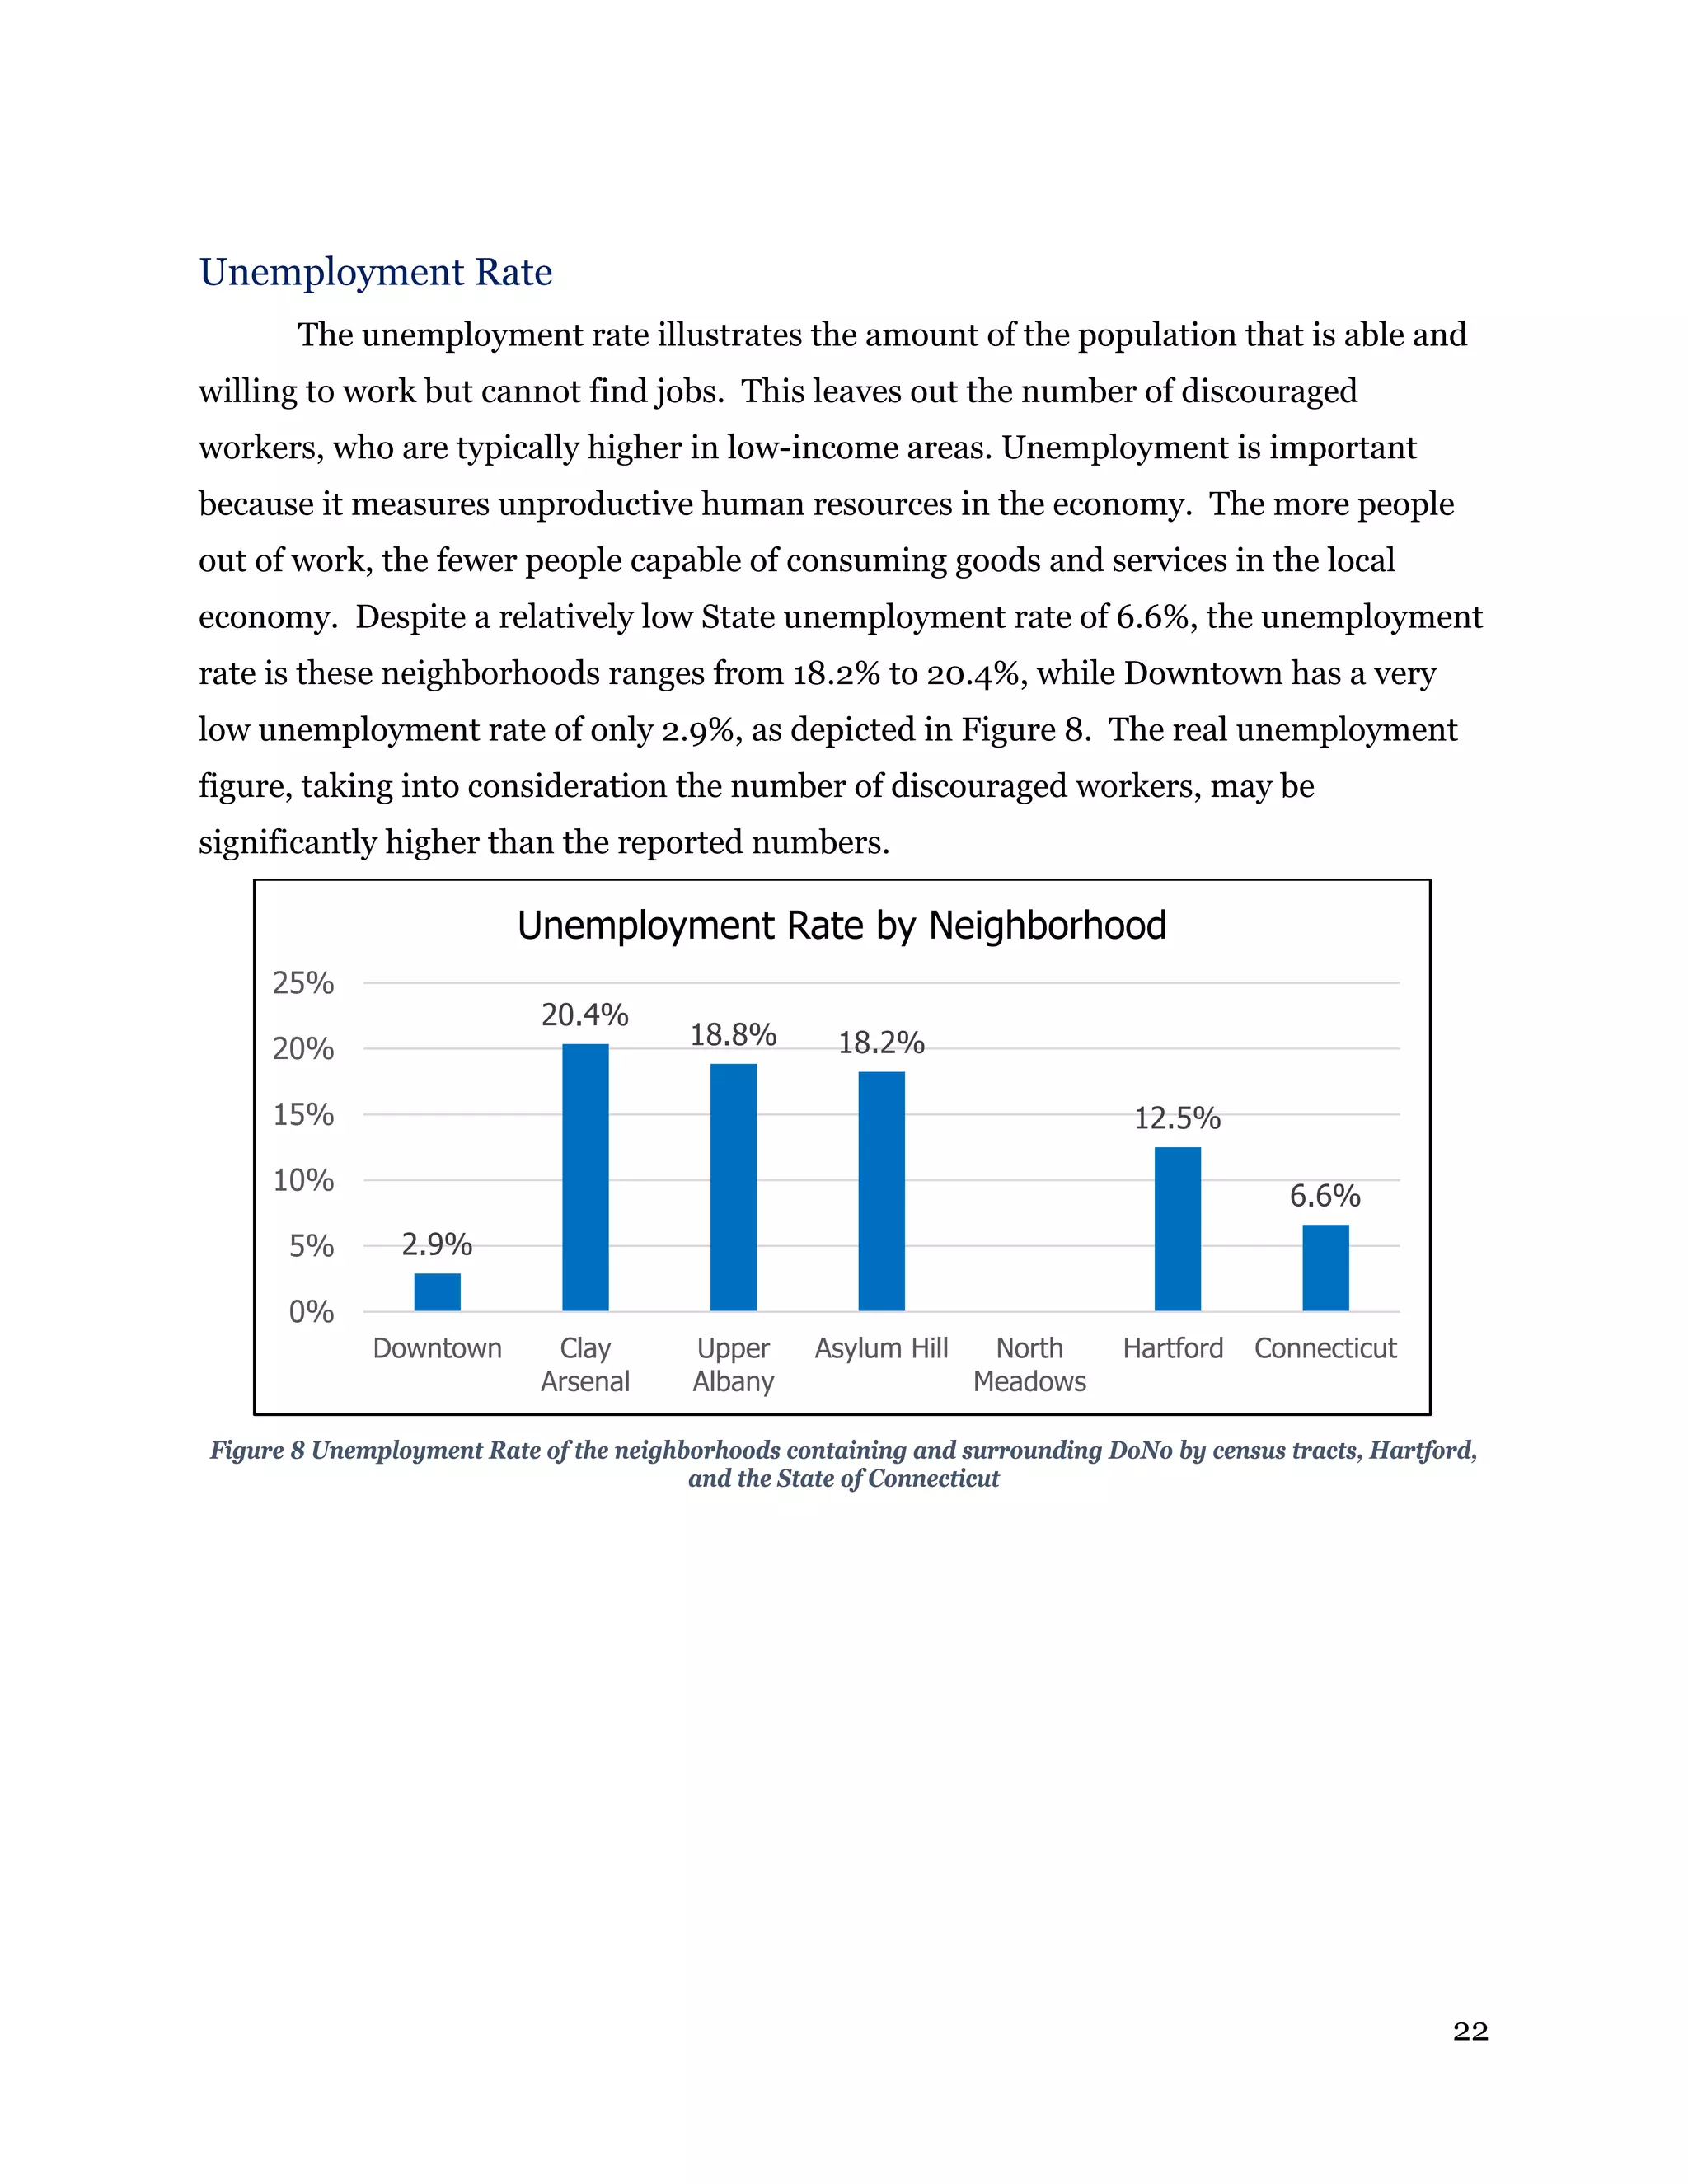
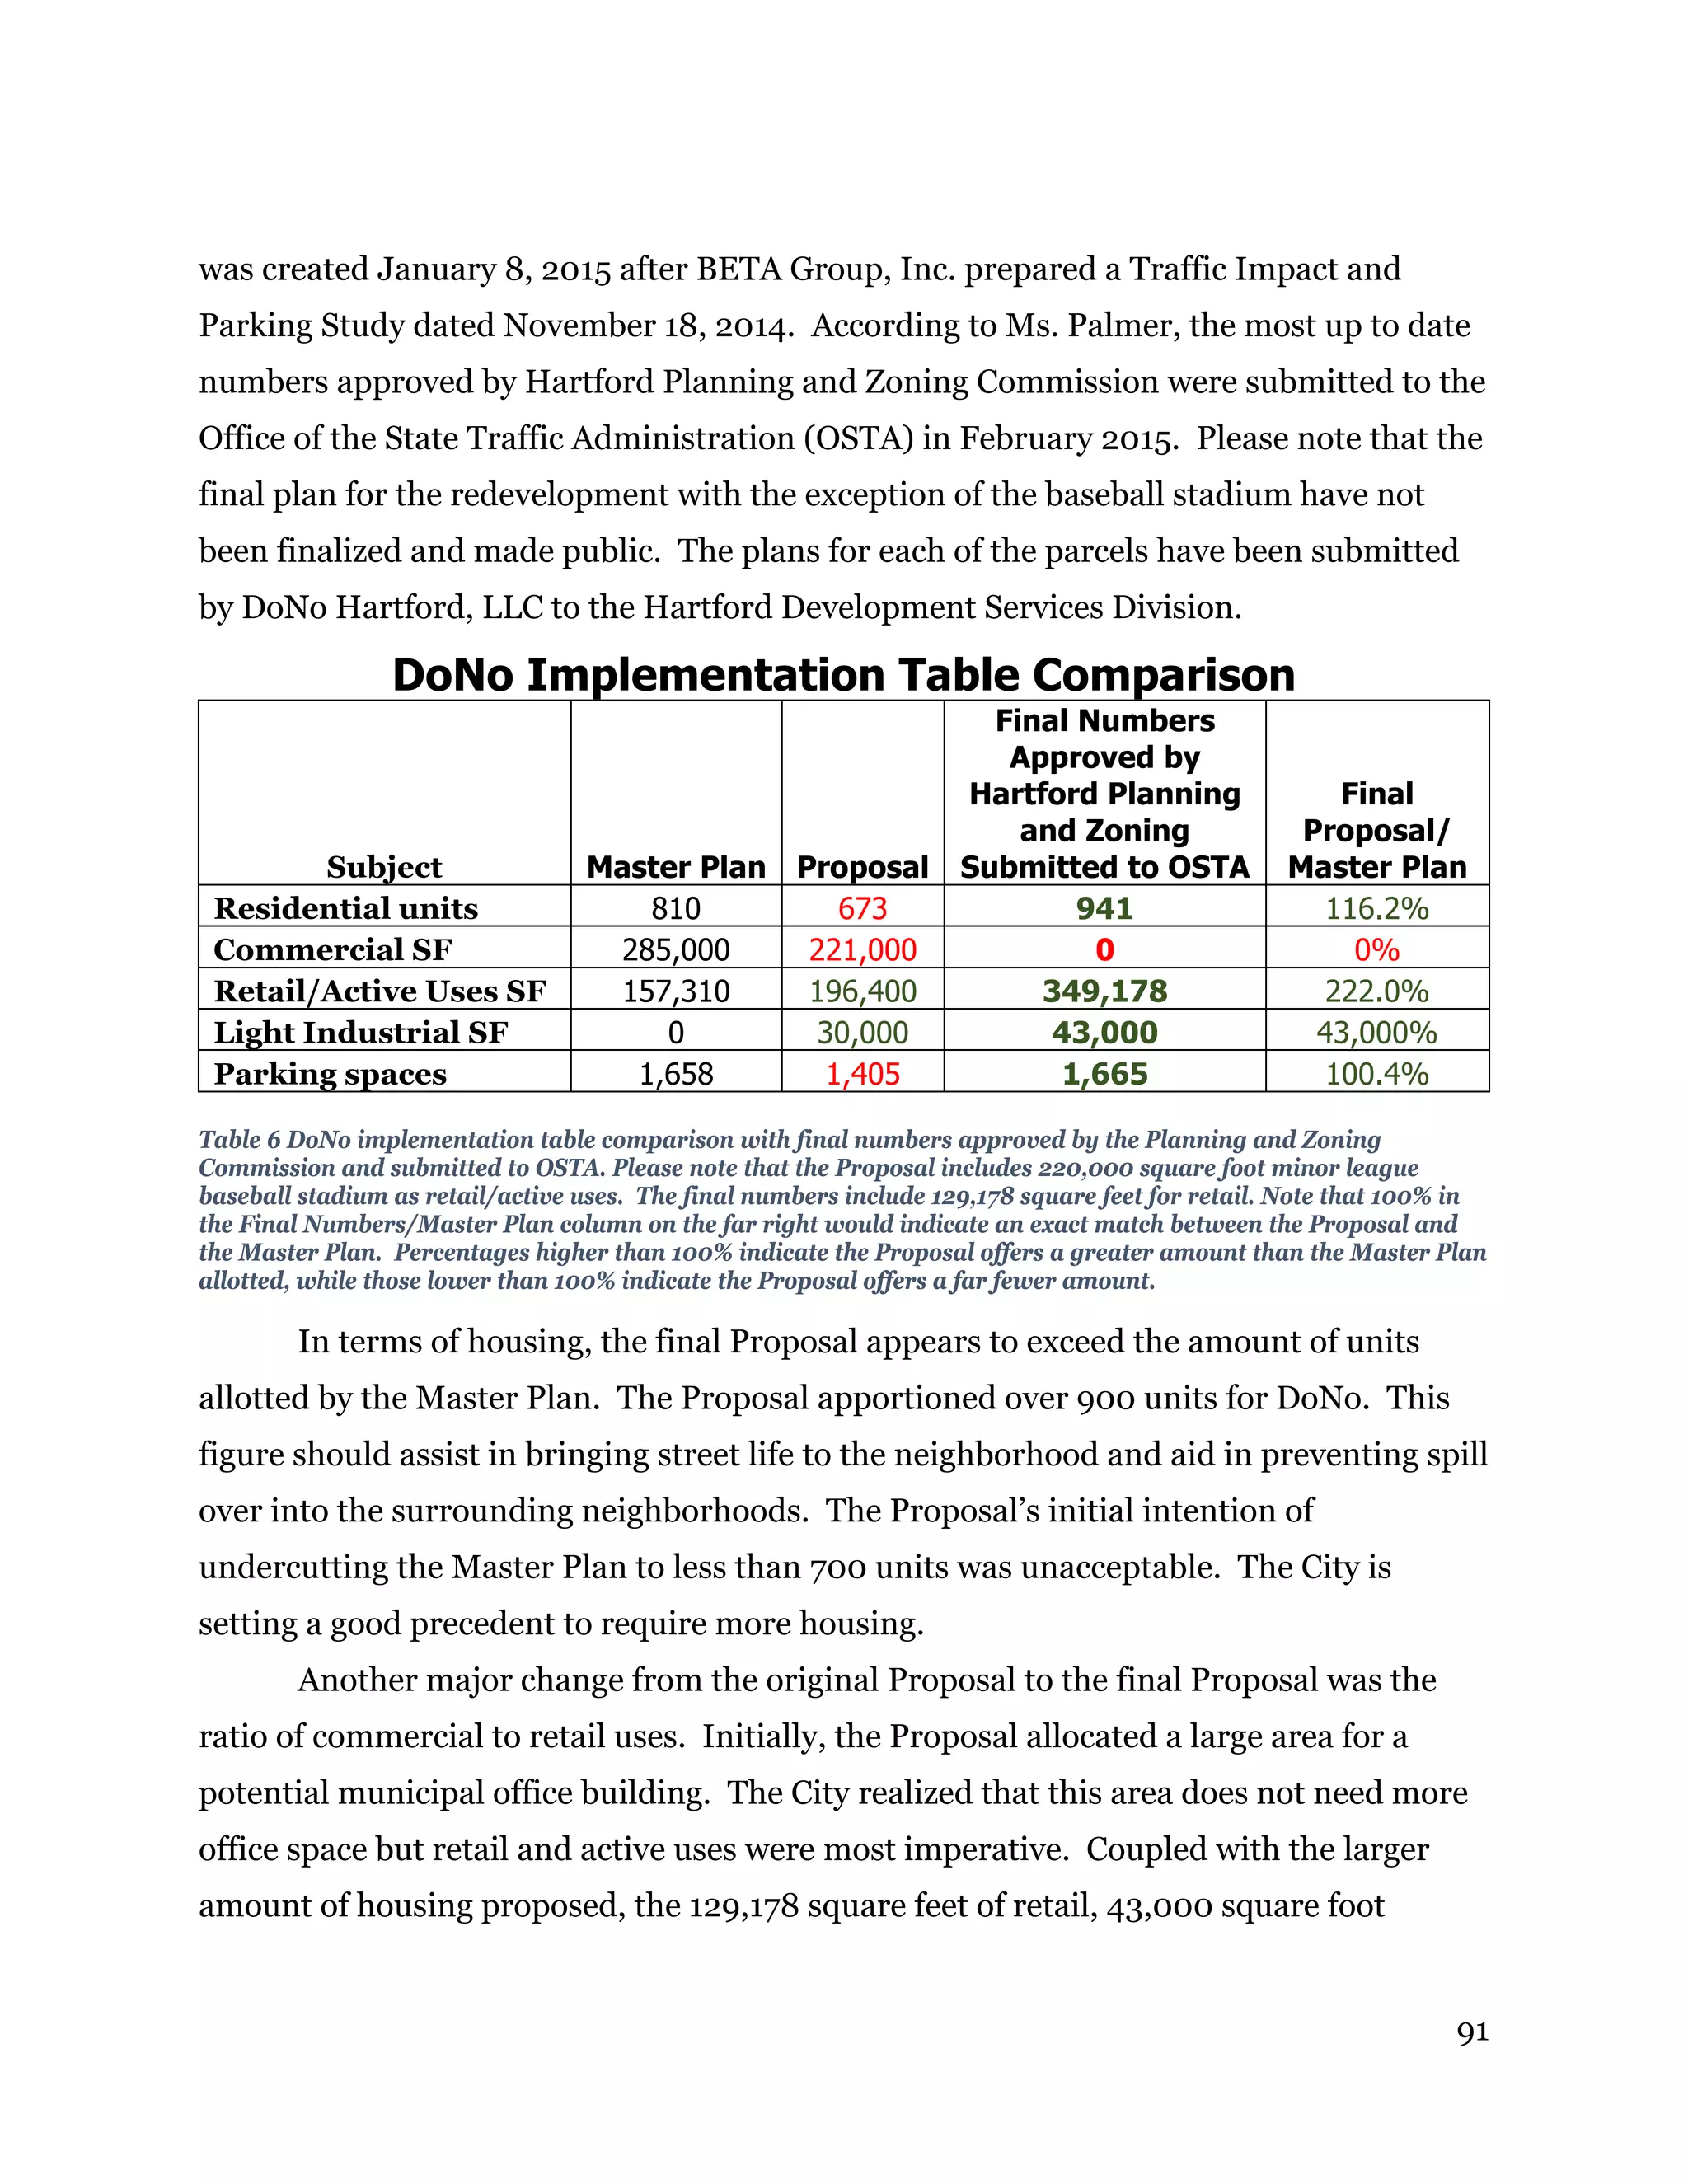
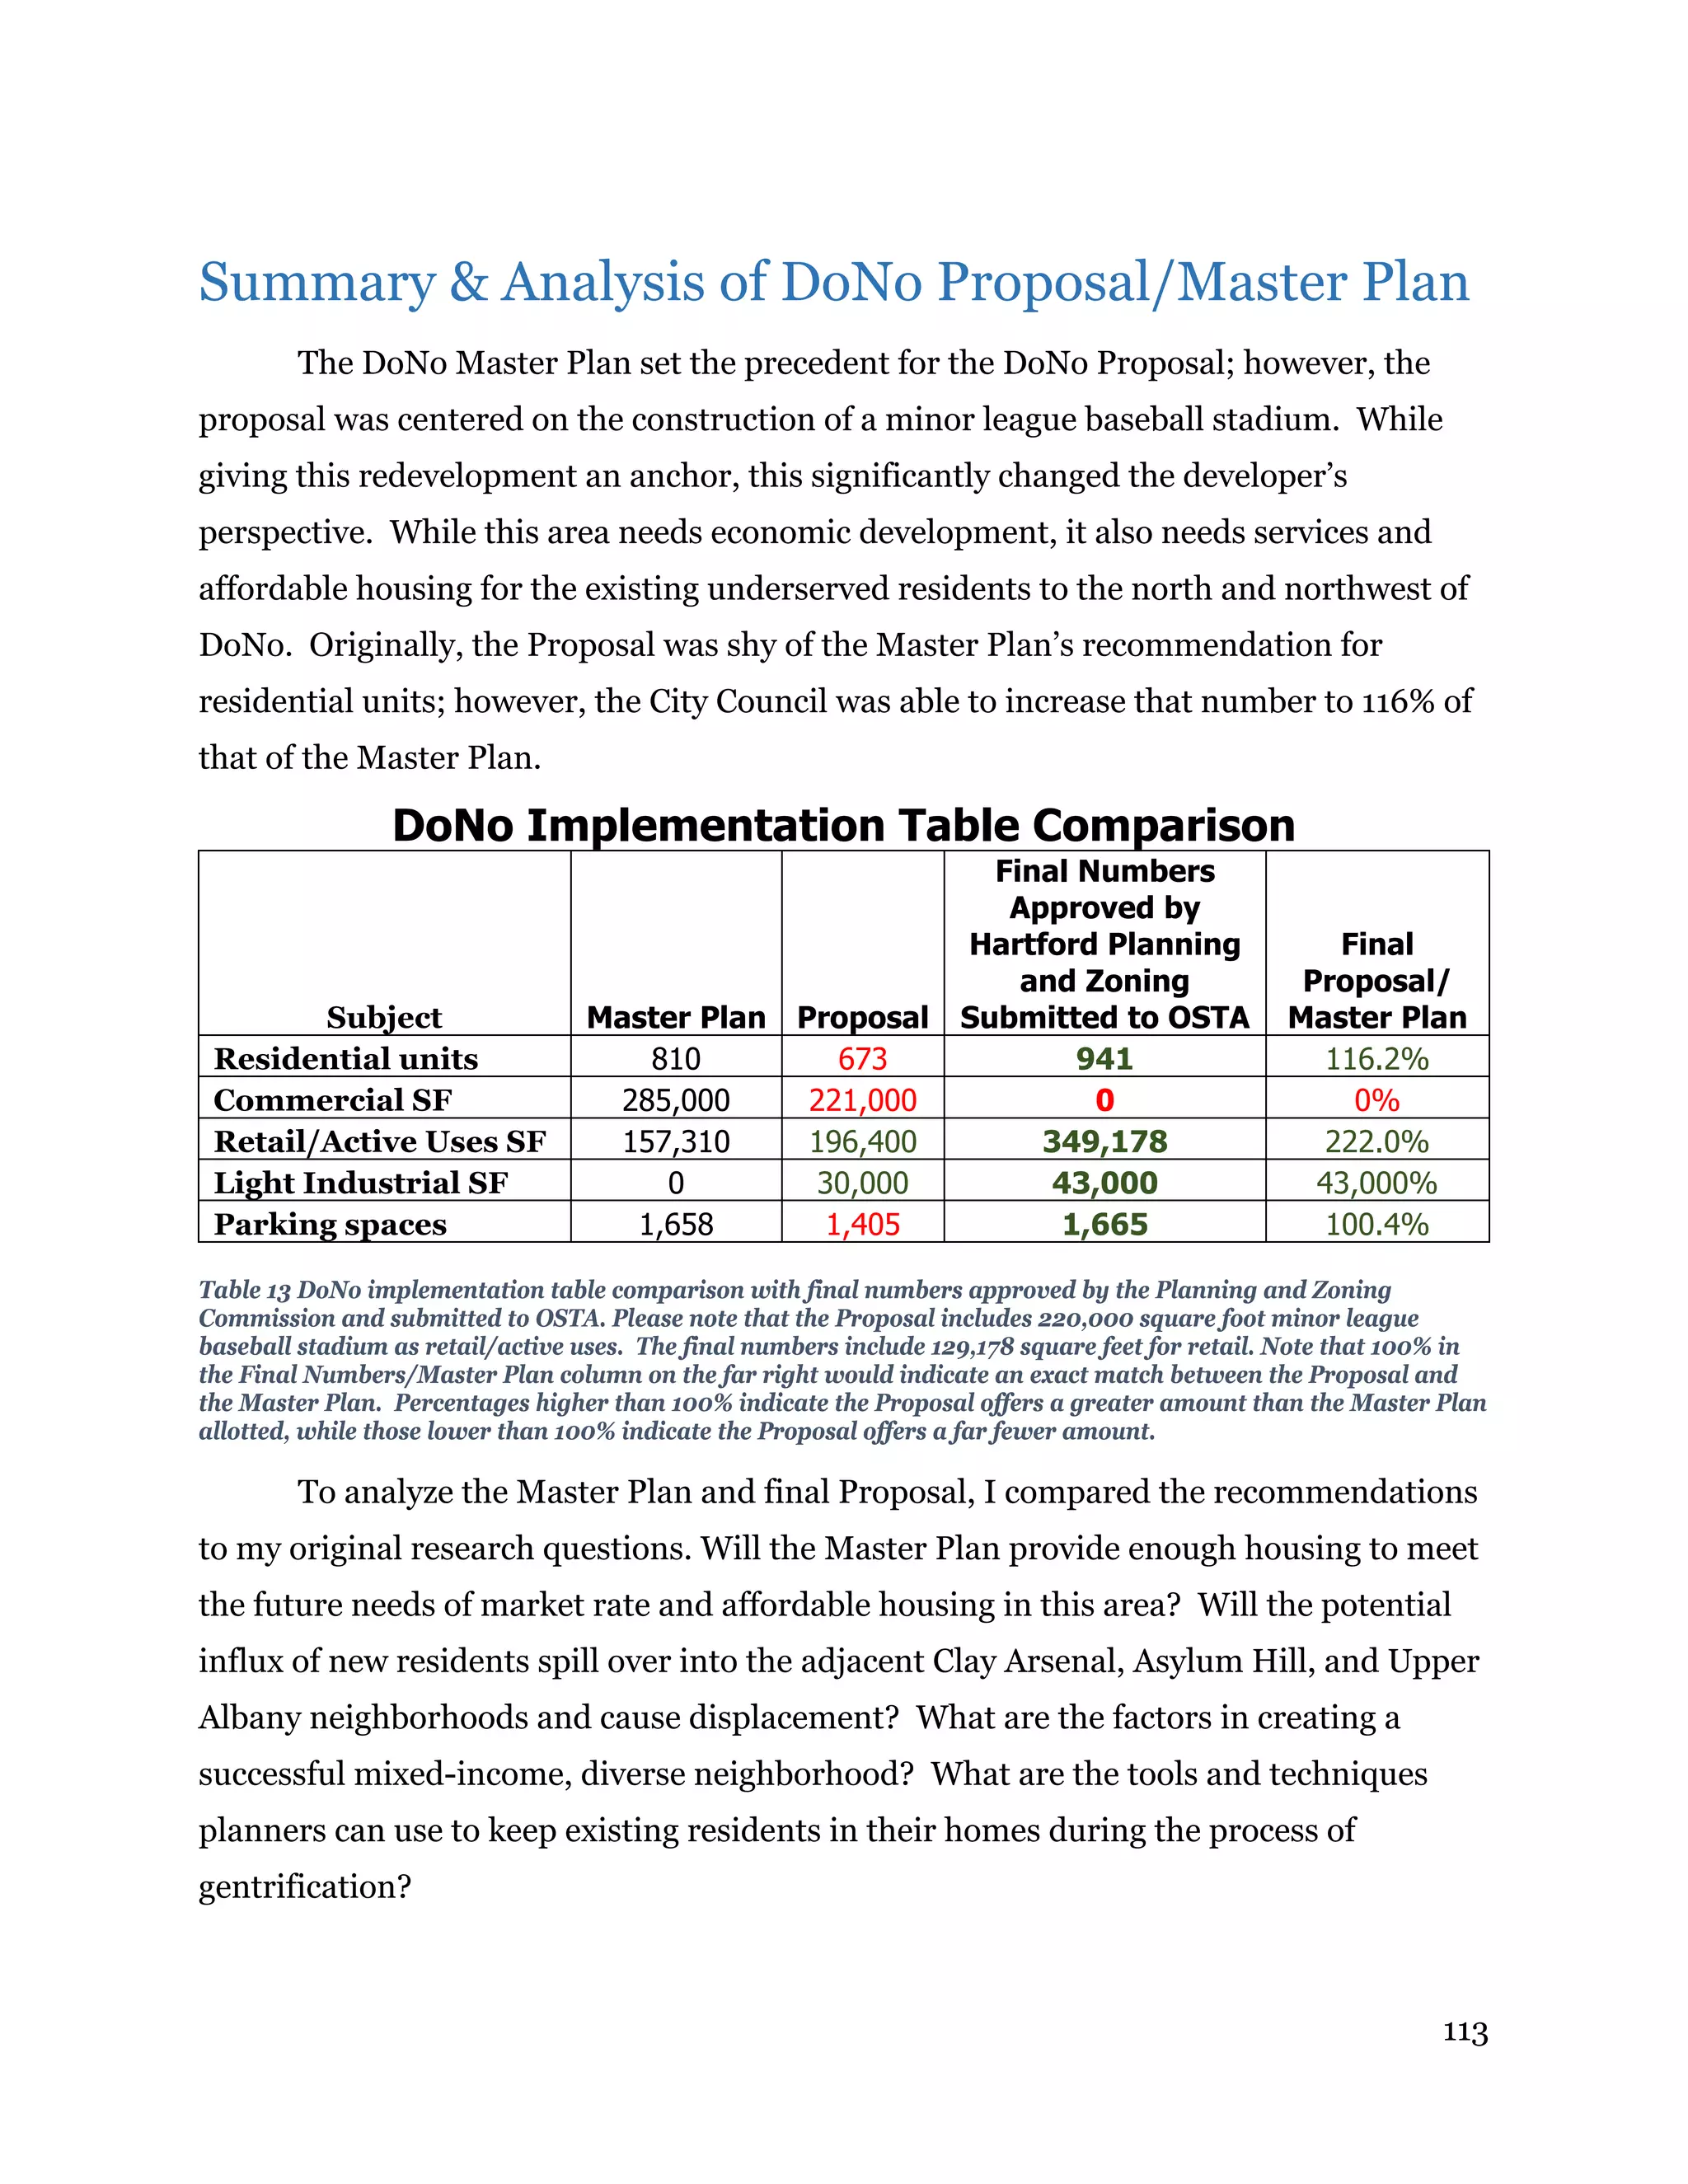
![63
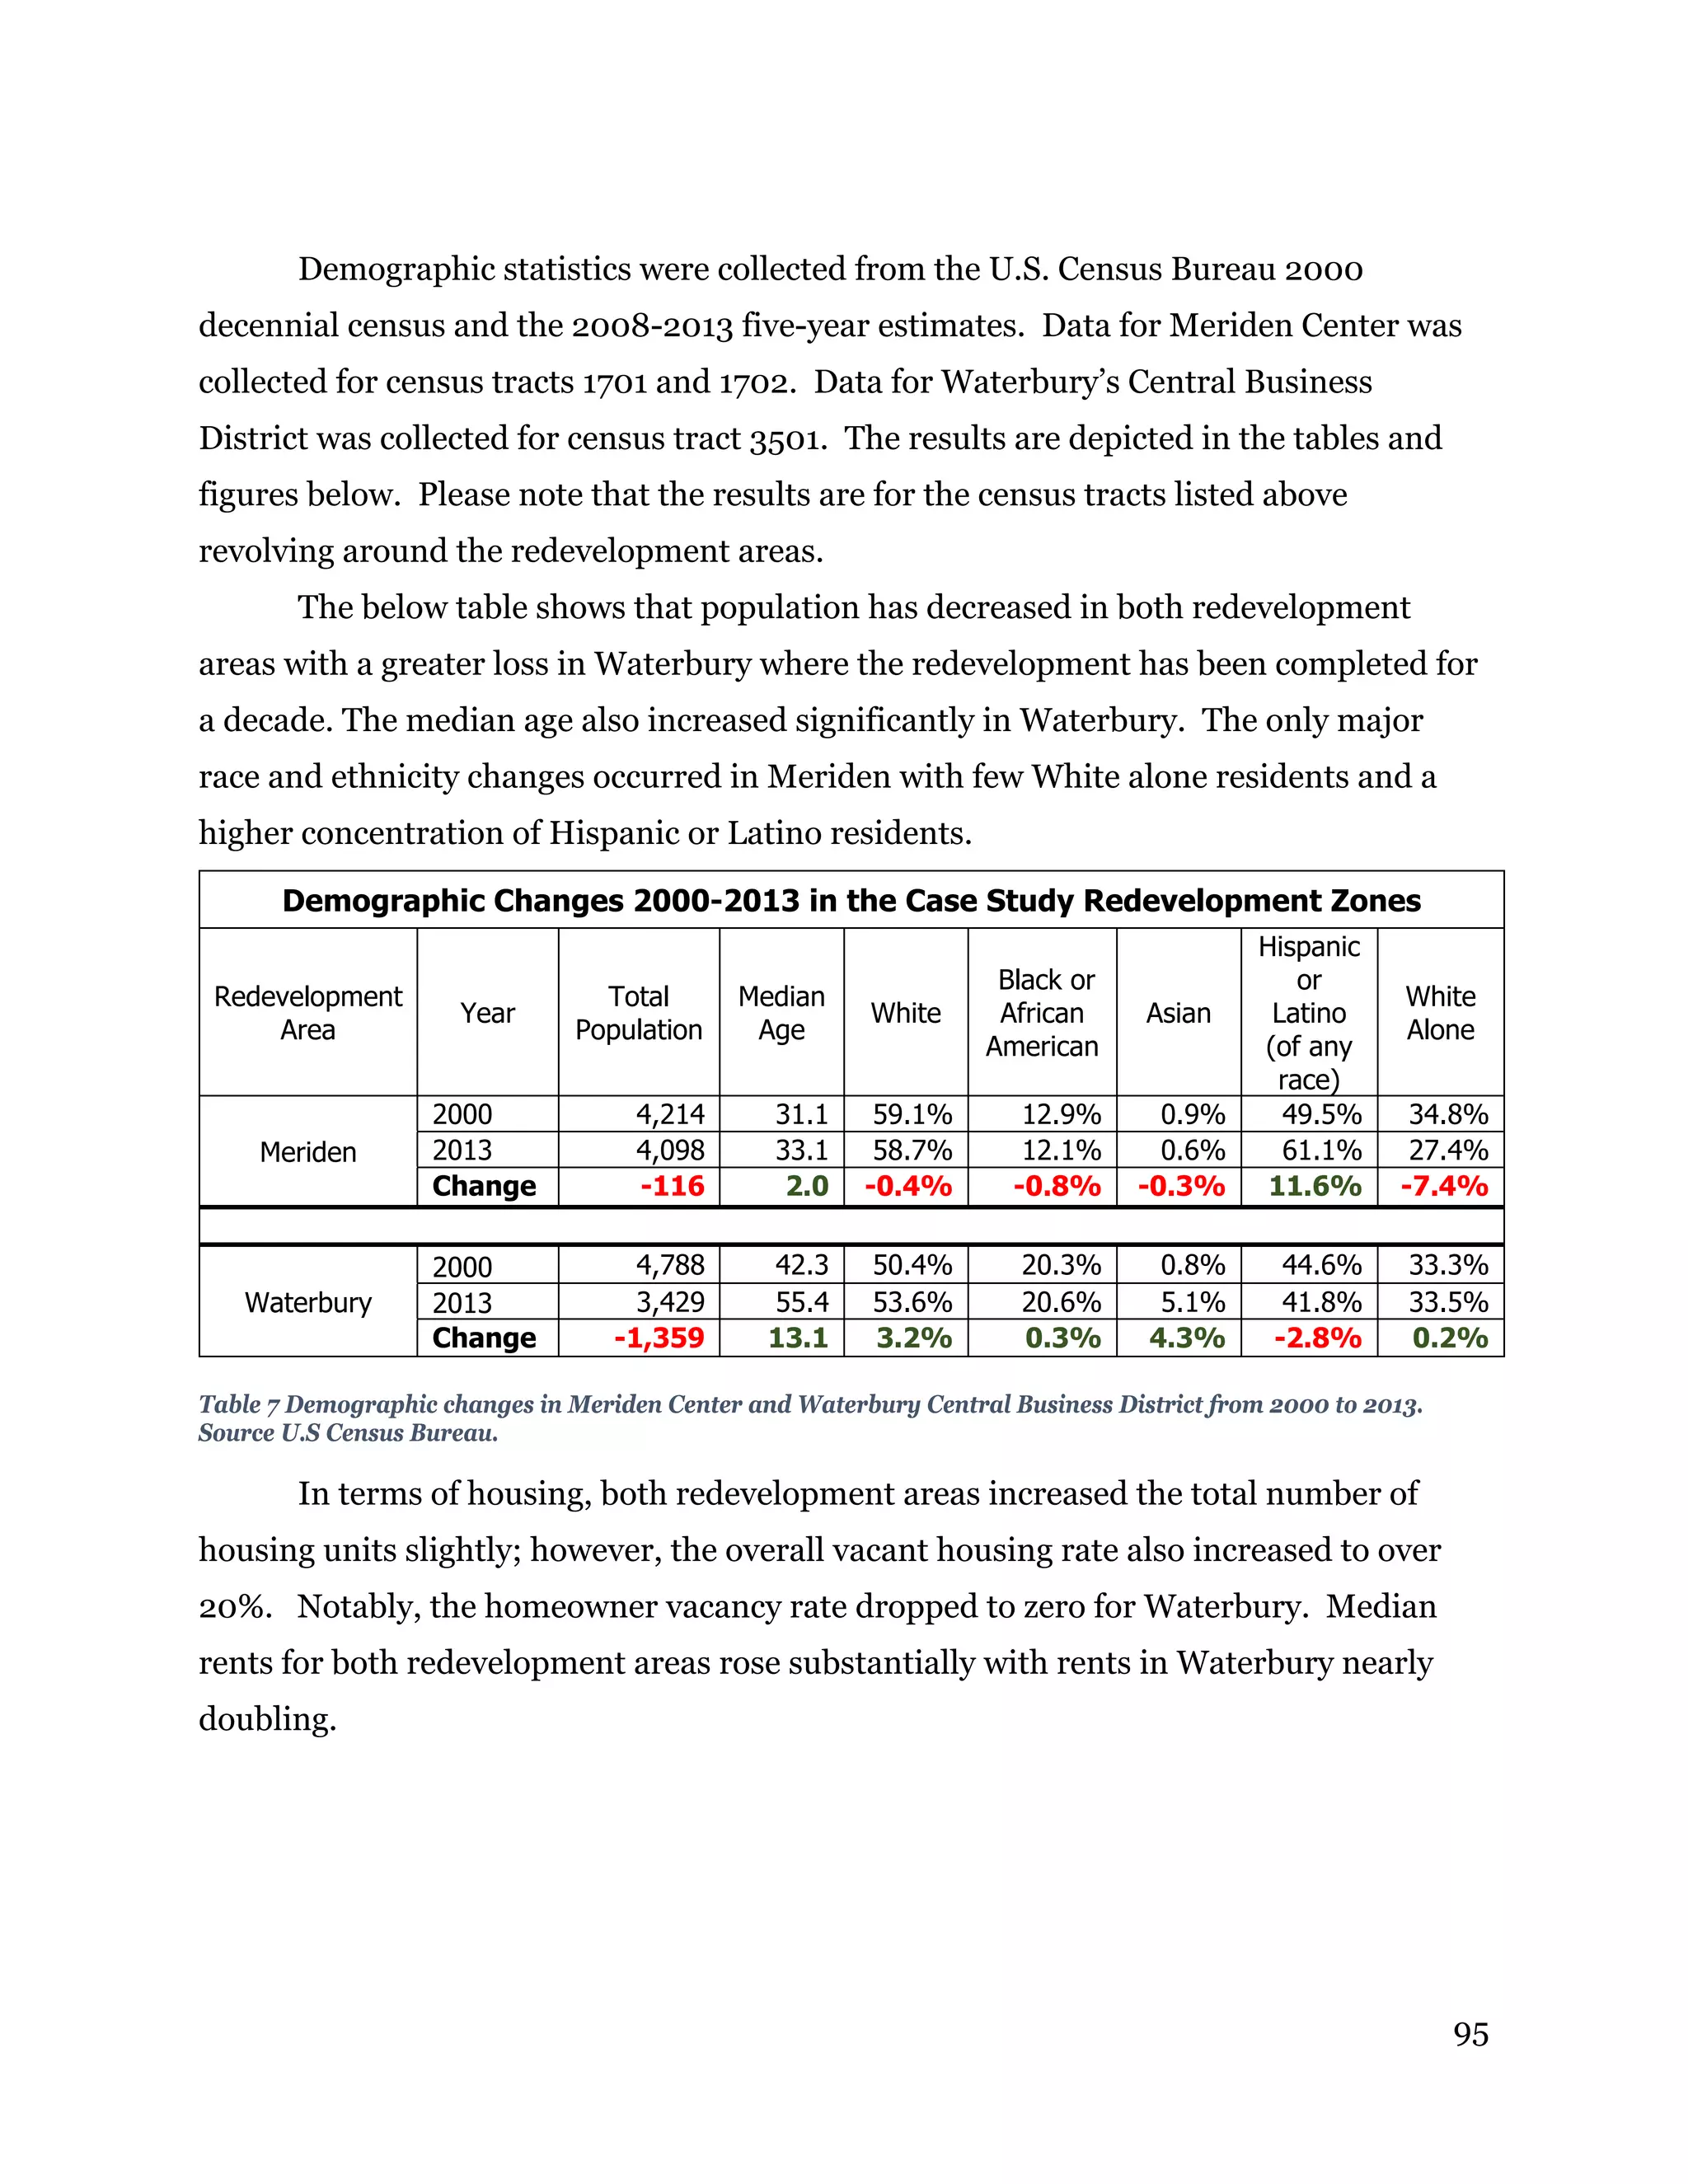
article “Deconcentrating Poverty with Housing Programs” (2008). In “Forced
relocation vs. voluntary mobility: The effects of dispersal programs on households,”
Goetz breaks down the successes and failures of two poverty deconcentration programs
in the Twin Cities region of Minnesota (2002). Lastly, DeFilippis and Wyly discuss the
vouchers and LIHTC’s abilities to deconcentrate poverty in “Running to Stand Still:
Through the Looking Glass with Federally Subsidized Housing in New York City”
(2006).
According to McClure, housing vouchers supplied to households are not helping
renters locate in low-poverty areas any more effectively than are current project-based
subsidies (2008). It is McClure’s opinion that “planners seeking to make poverty
deconcentration more effective [should] use housing placement counselors, administer
programs at the metropolitan scale, lease and broker market-rate housing directly,
promote mixed income LIHTC developments, practice inclusionary zoning, and monitor
the impacts of these efforts” (p. 90). The LIHTC program may be providing greater low-
poverty market penetration than the HCV program because the developer makes the
location decision in the LIHTC program, while in the HCV program the household
chooses the location. There are difficulties finding units, fear of discrimination, and loss
of social fabric. Housing placement counselors are essential in the HCV program to help
households that may not have access to internet, good credit, or references to find units
and facilitate transition. Planners should make it easy for developers to place LIHTC
and other affordable housing in the proper neighborhoods rather than vulnerable
neighborhoods by zoning these areas to allow for multi-family developments.
Goetz’s research analyzed two poverty deconcentration programs: voluntary
mobility programs and involuntary relocation of families through government action in
the Twin Cities Region in response to the Hollman v. Cisneros case settled in 1995 that
demolished 700 units (2002). These units were mandated to be replaced in a scattered
fashion in non-concentrated parts of the metropolitan area (p. 108). The voluntary
mobility program was similar to the “Moving to Opportunity” (MTO) program, which is
a modified Section 8 voucher that must be used in low poverty areas (ibid). The greatest
effects of these programs was seen in relieving issues of personal safety and
neighborhood incivility (drug use, graffiti, drinking etc.). Neighborhood satisfaction was](https://image.slidesharecdn.com/928d85f8-e886-4de1-82d7-630b9f3923e8-160106213833/75/DoNo-Master-s-Project-FINAL-DRAFT-63-2048.jpg)


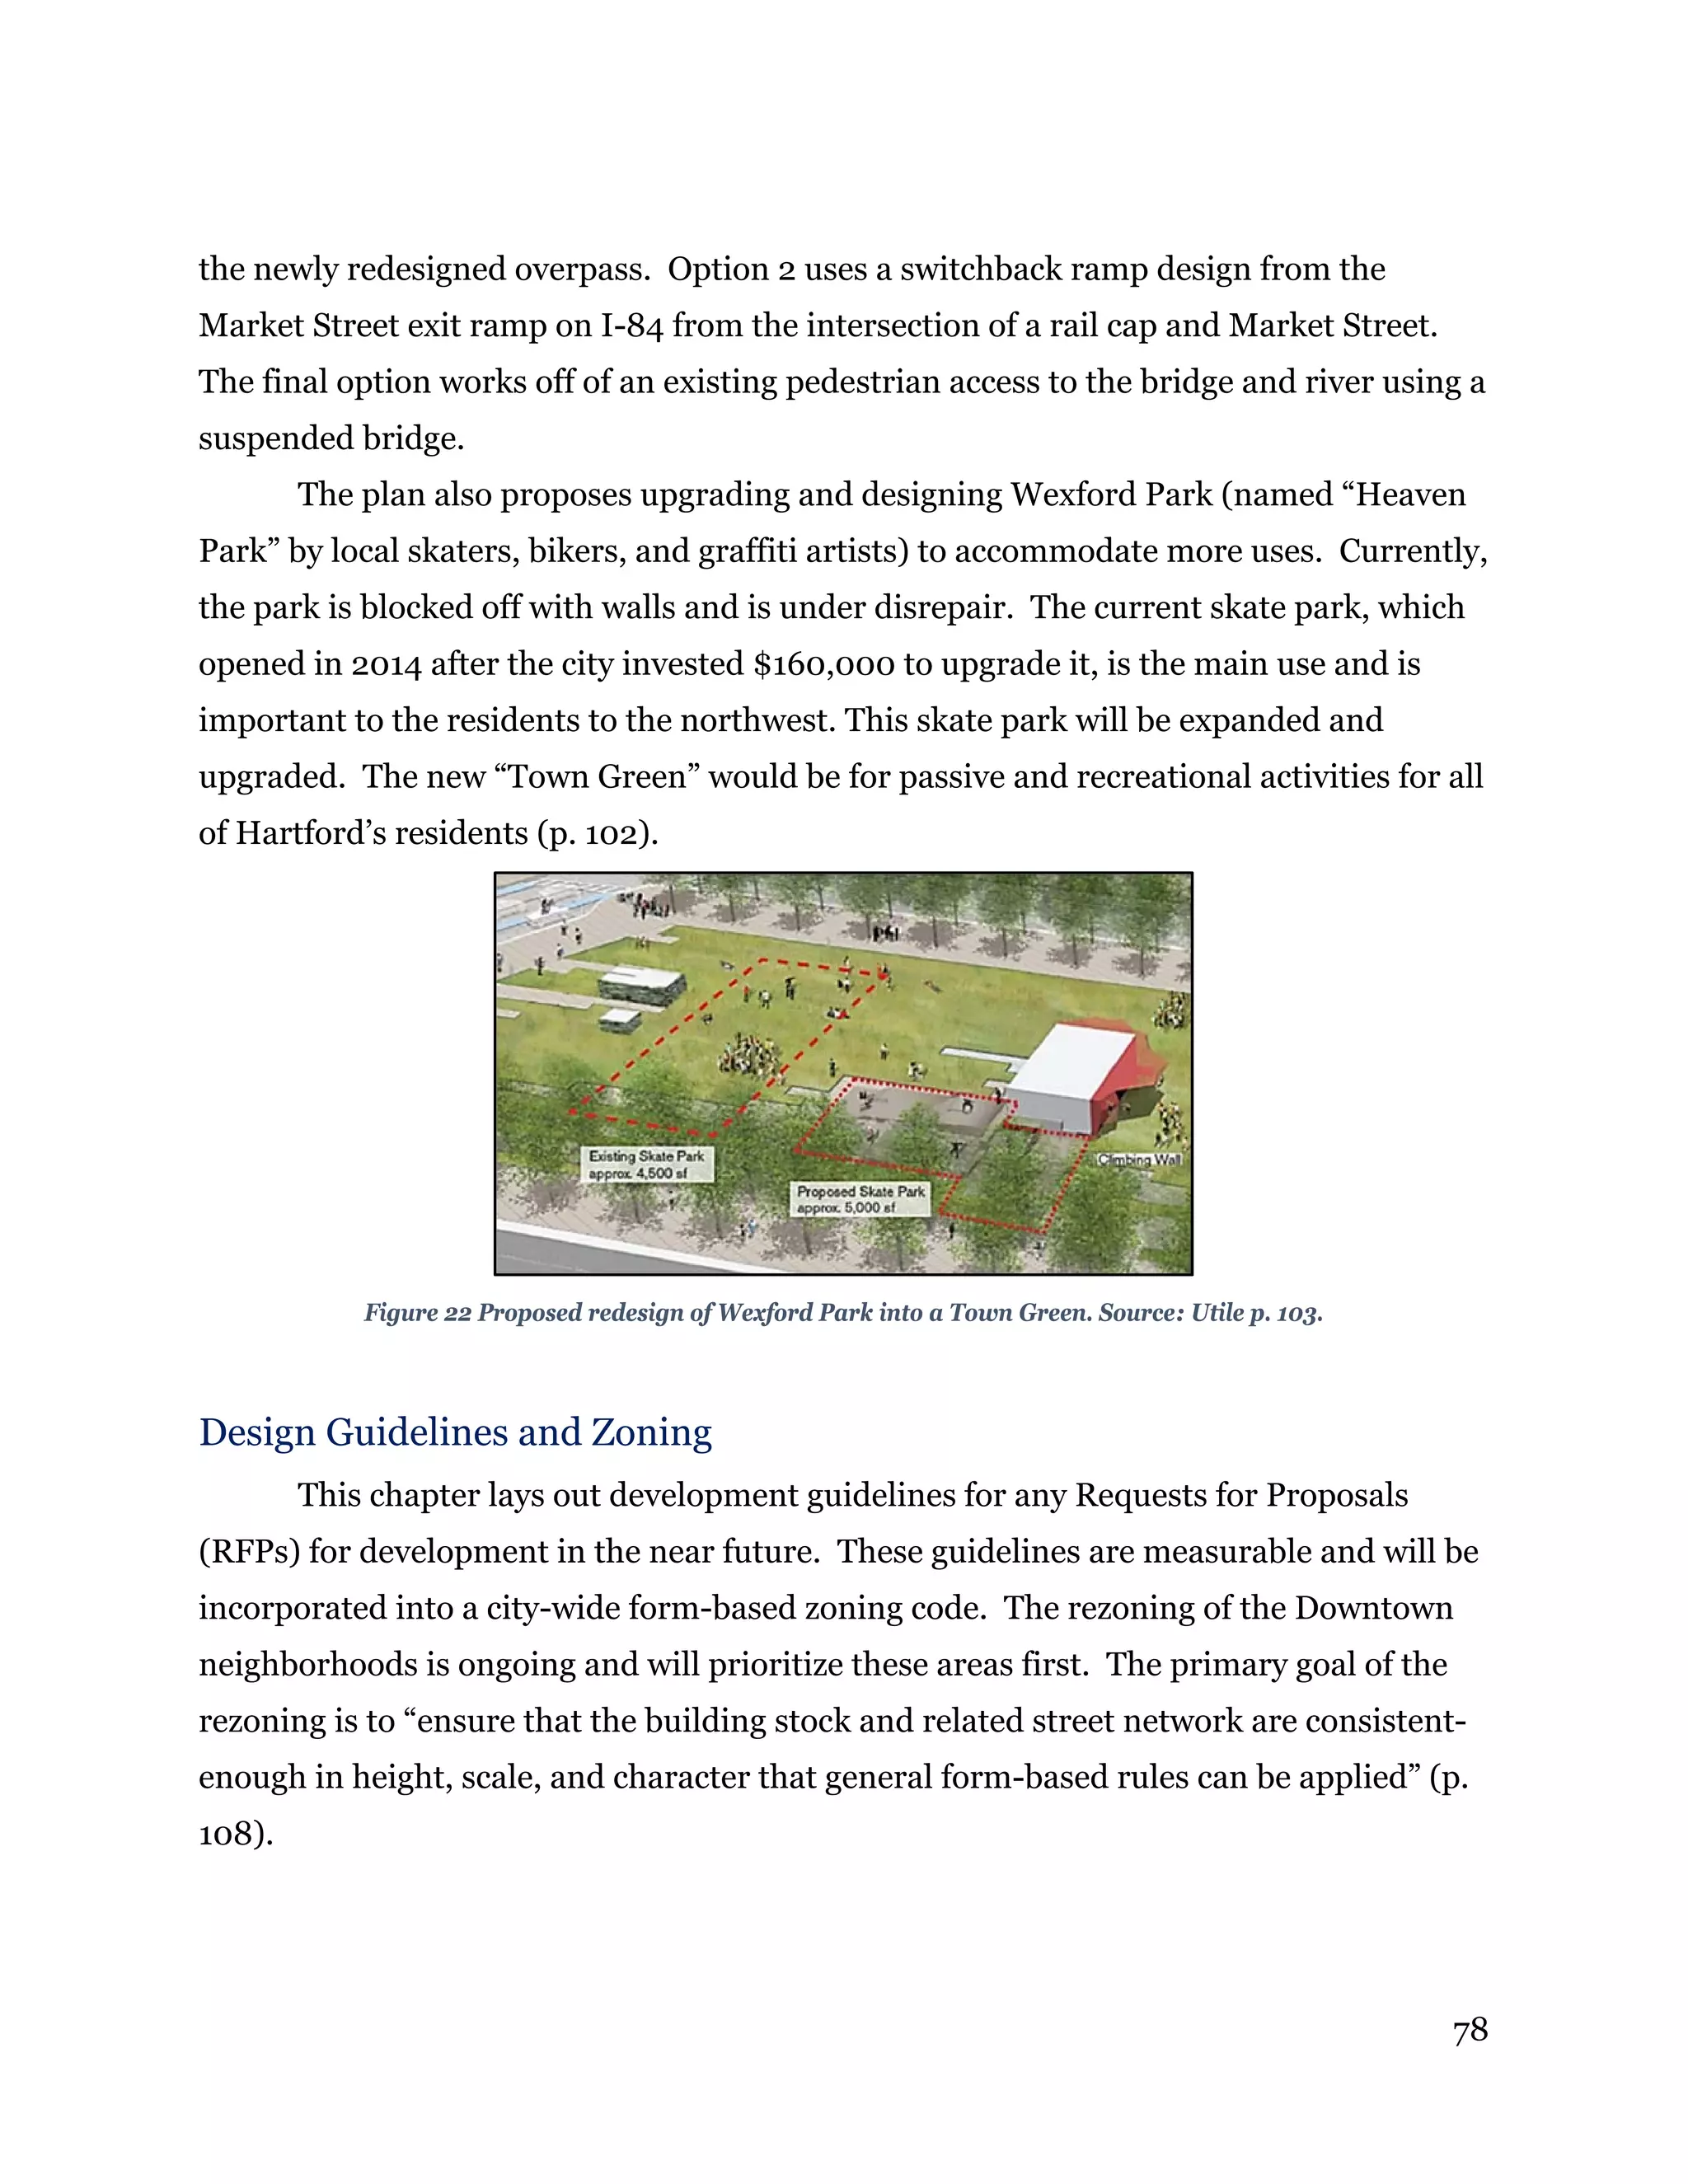
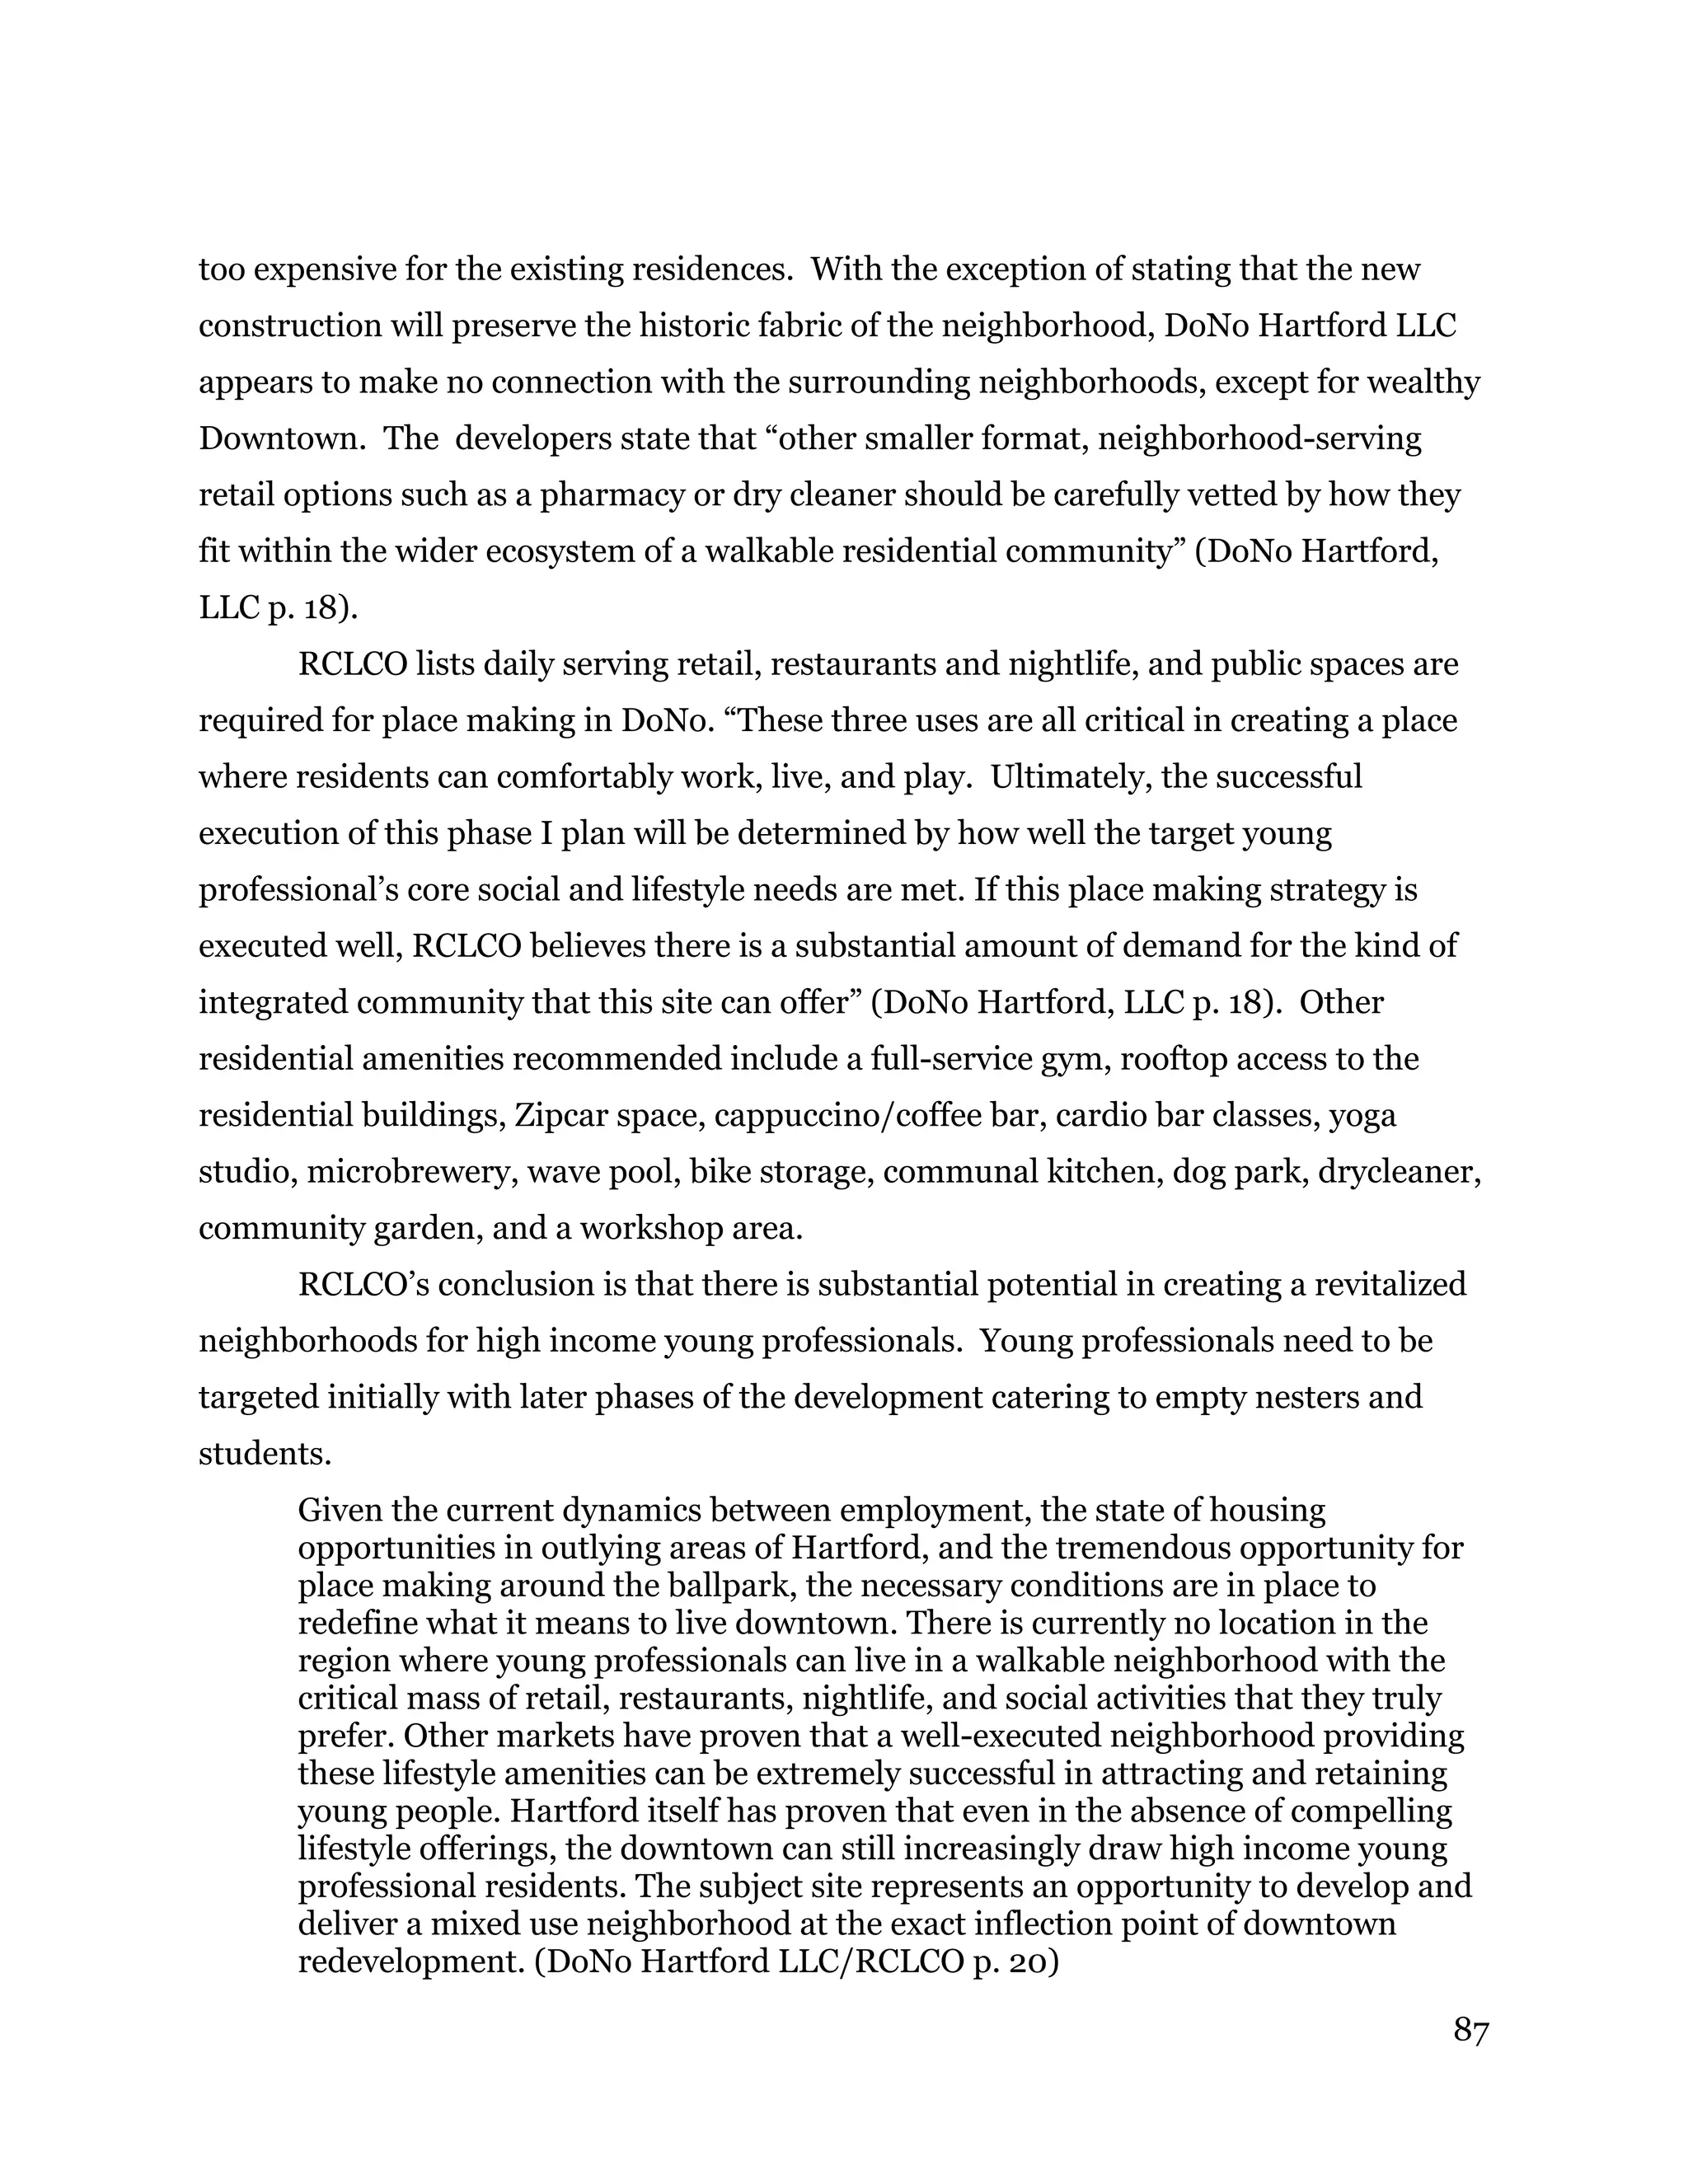
![84
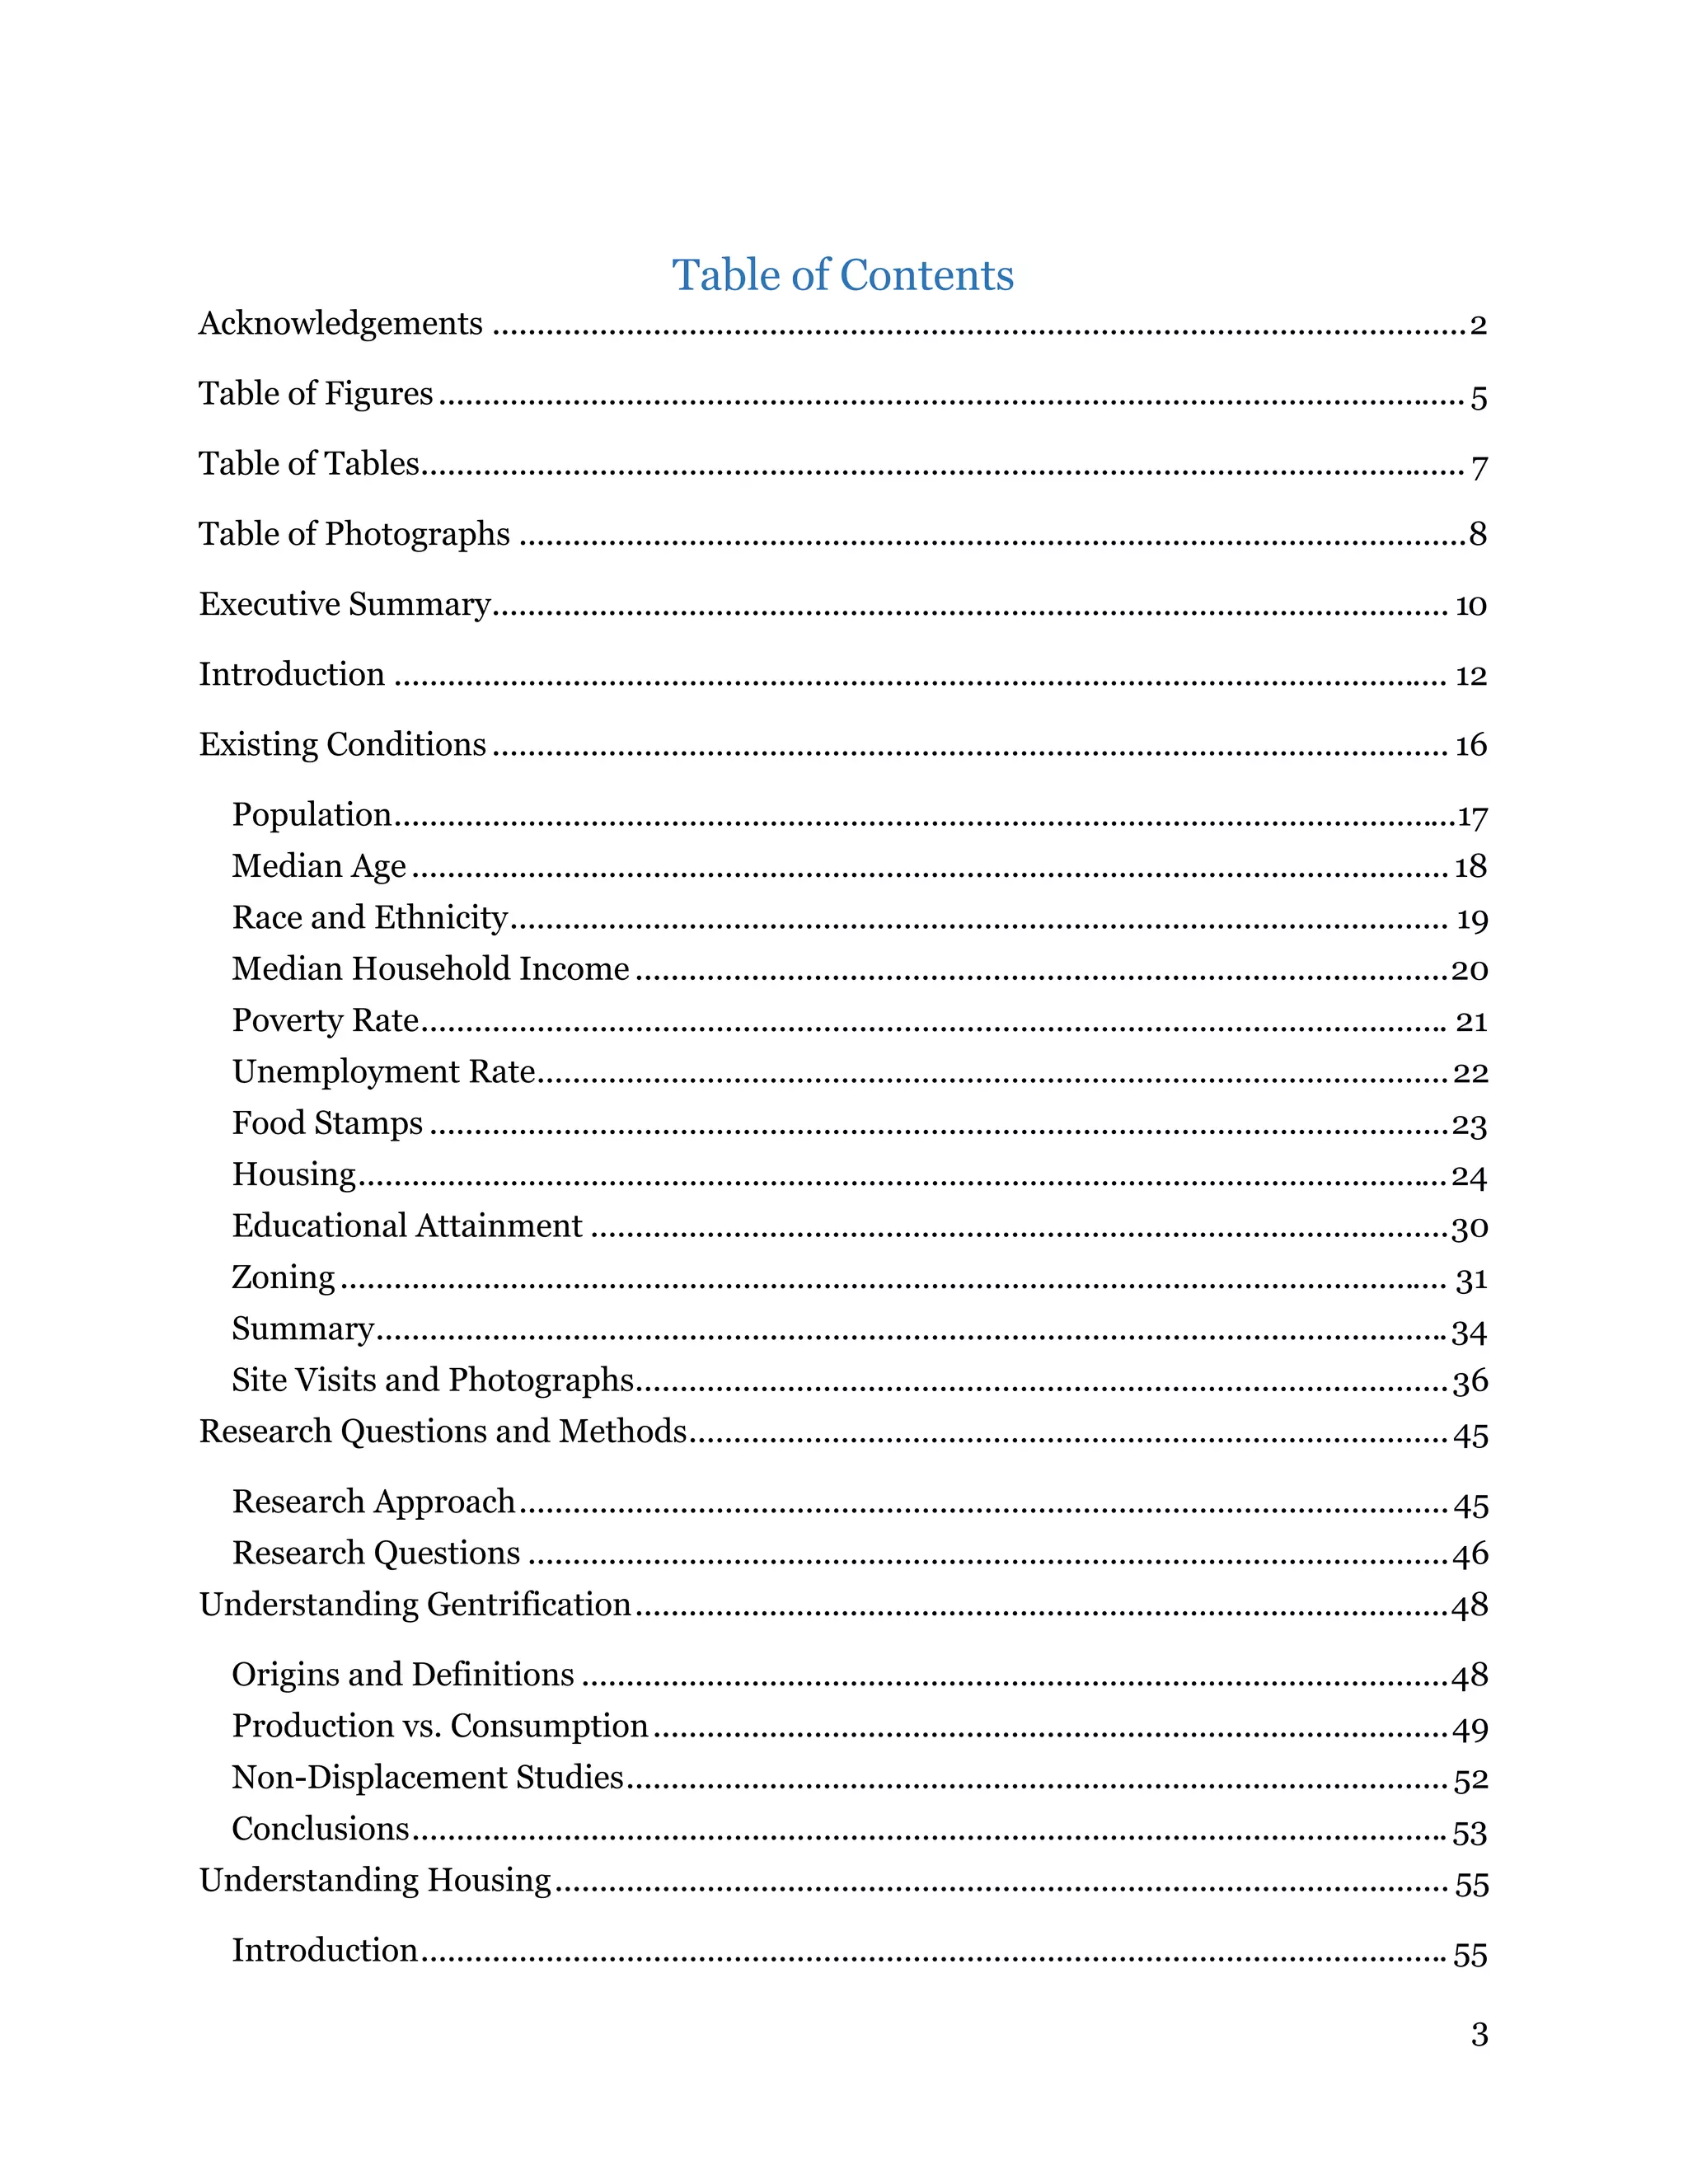
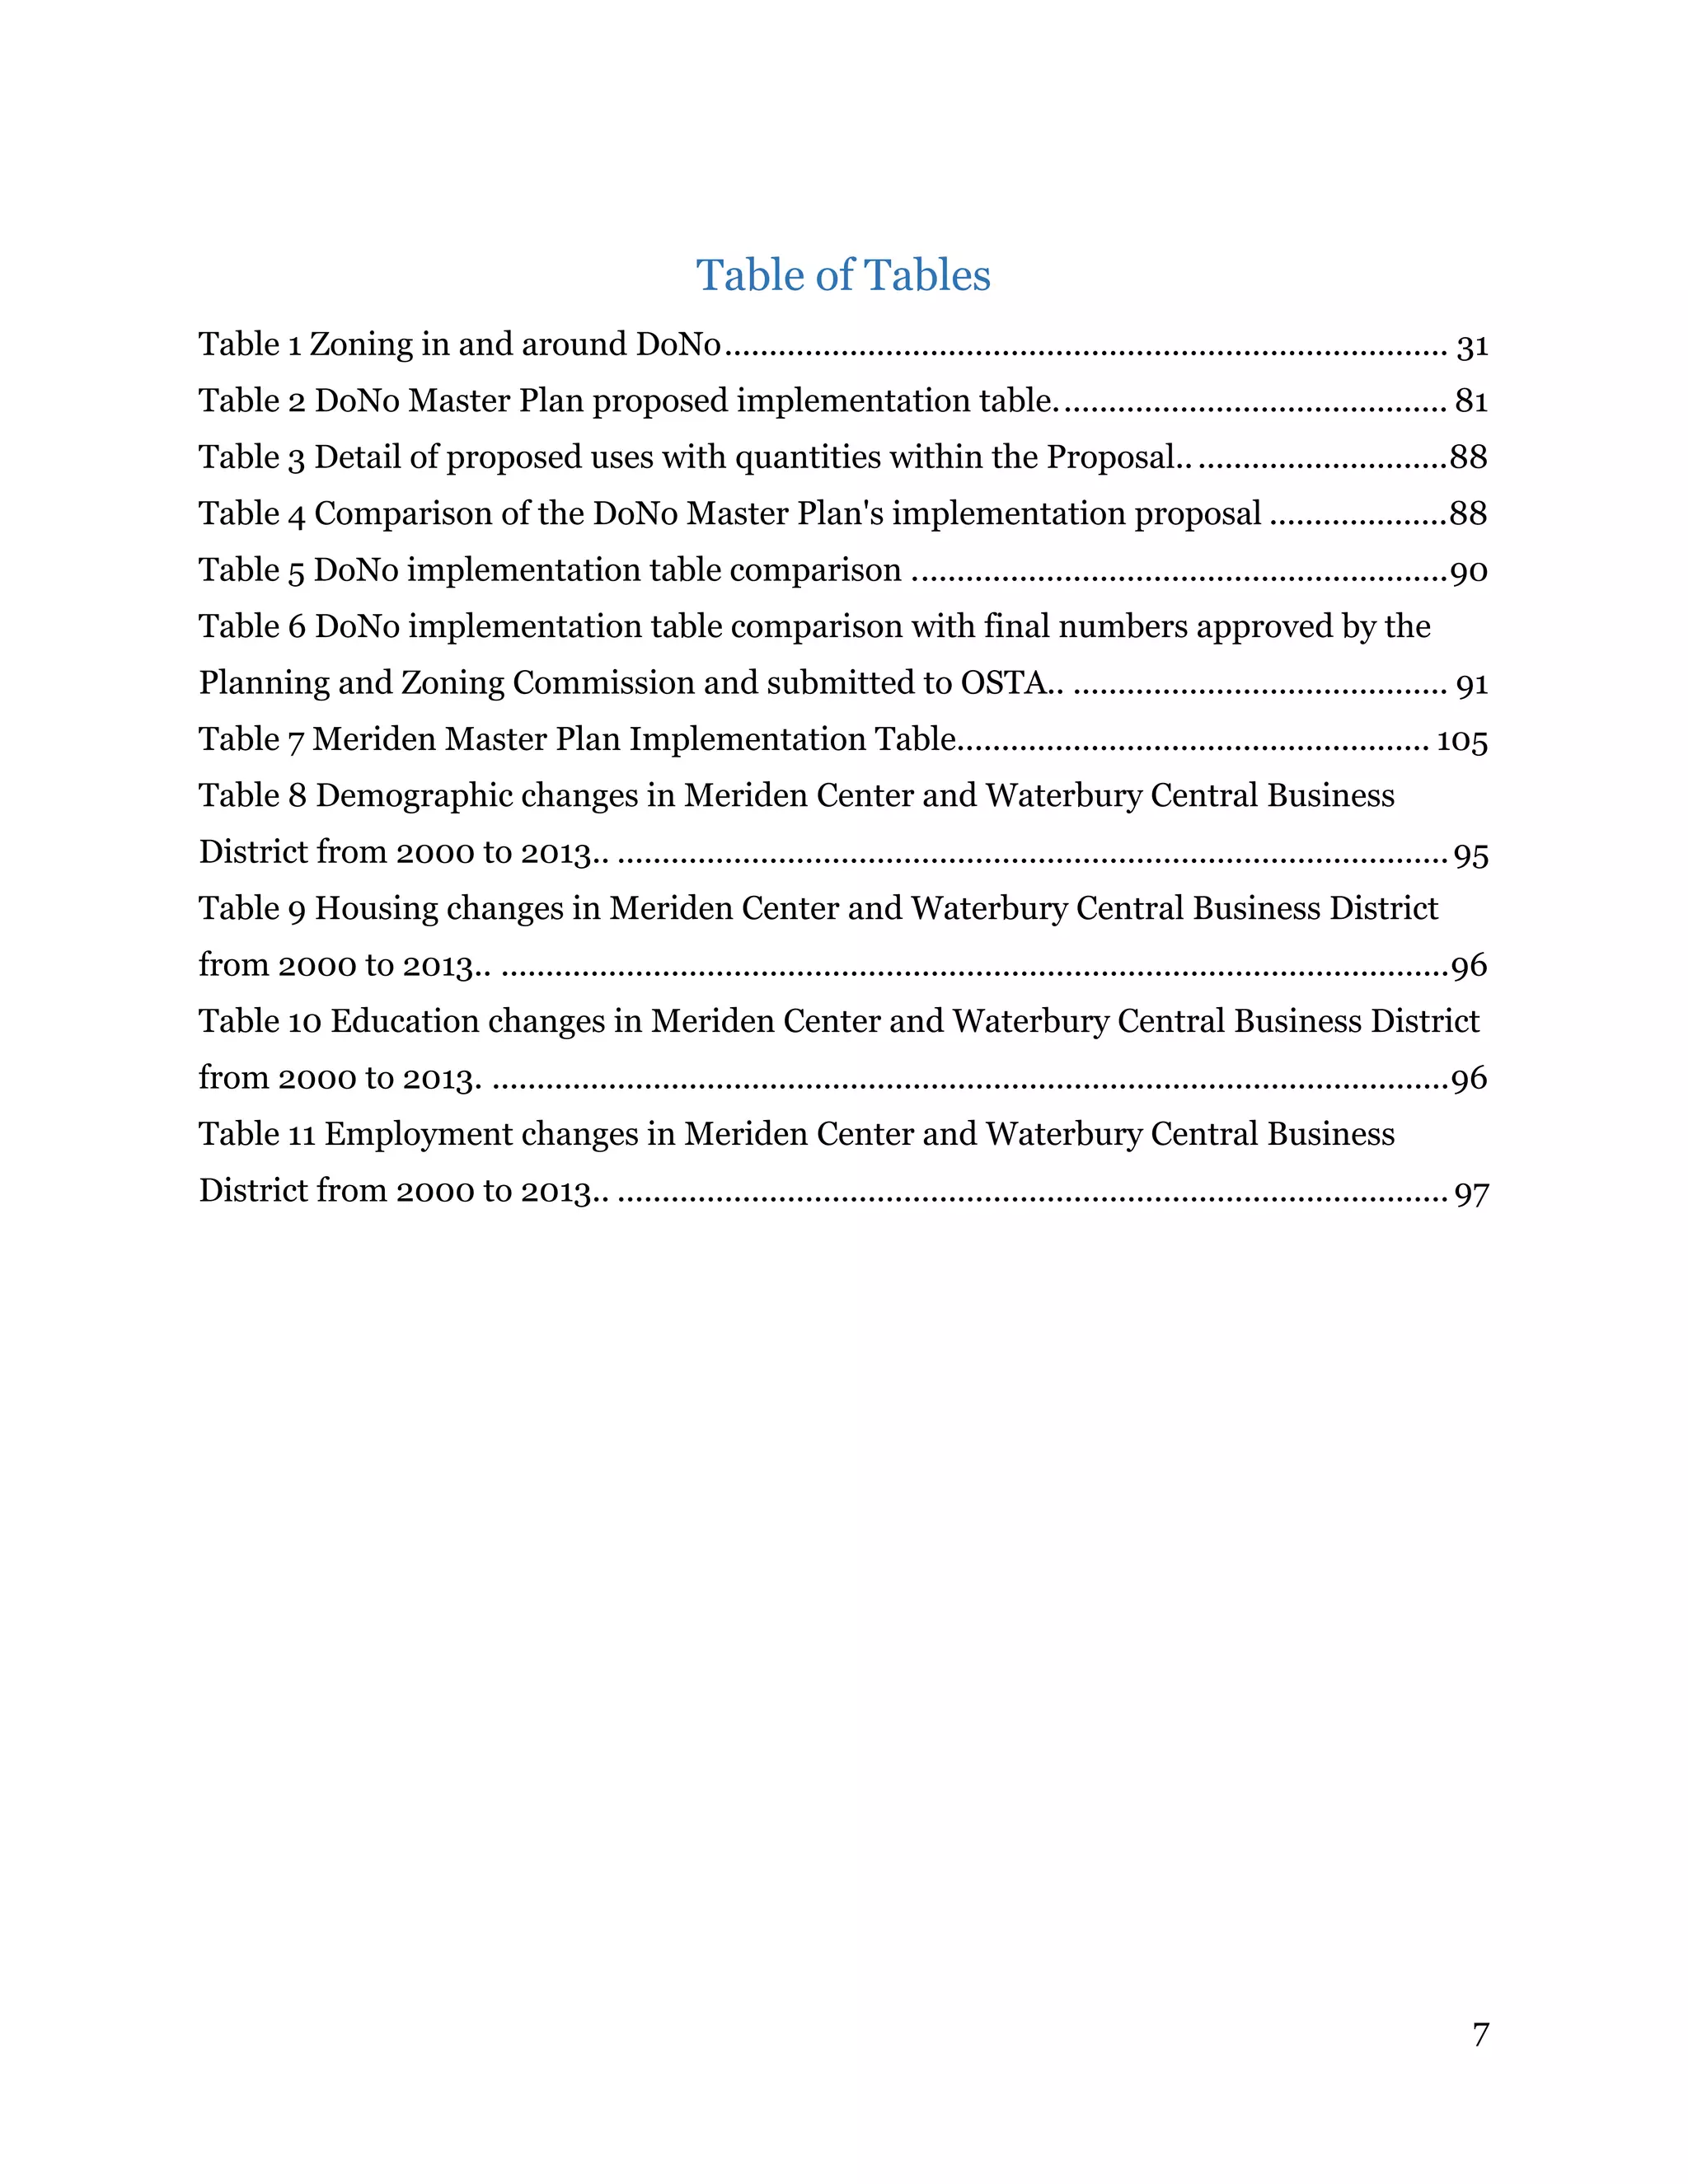
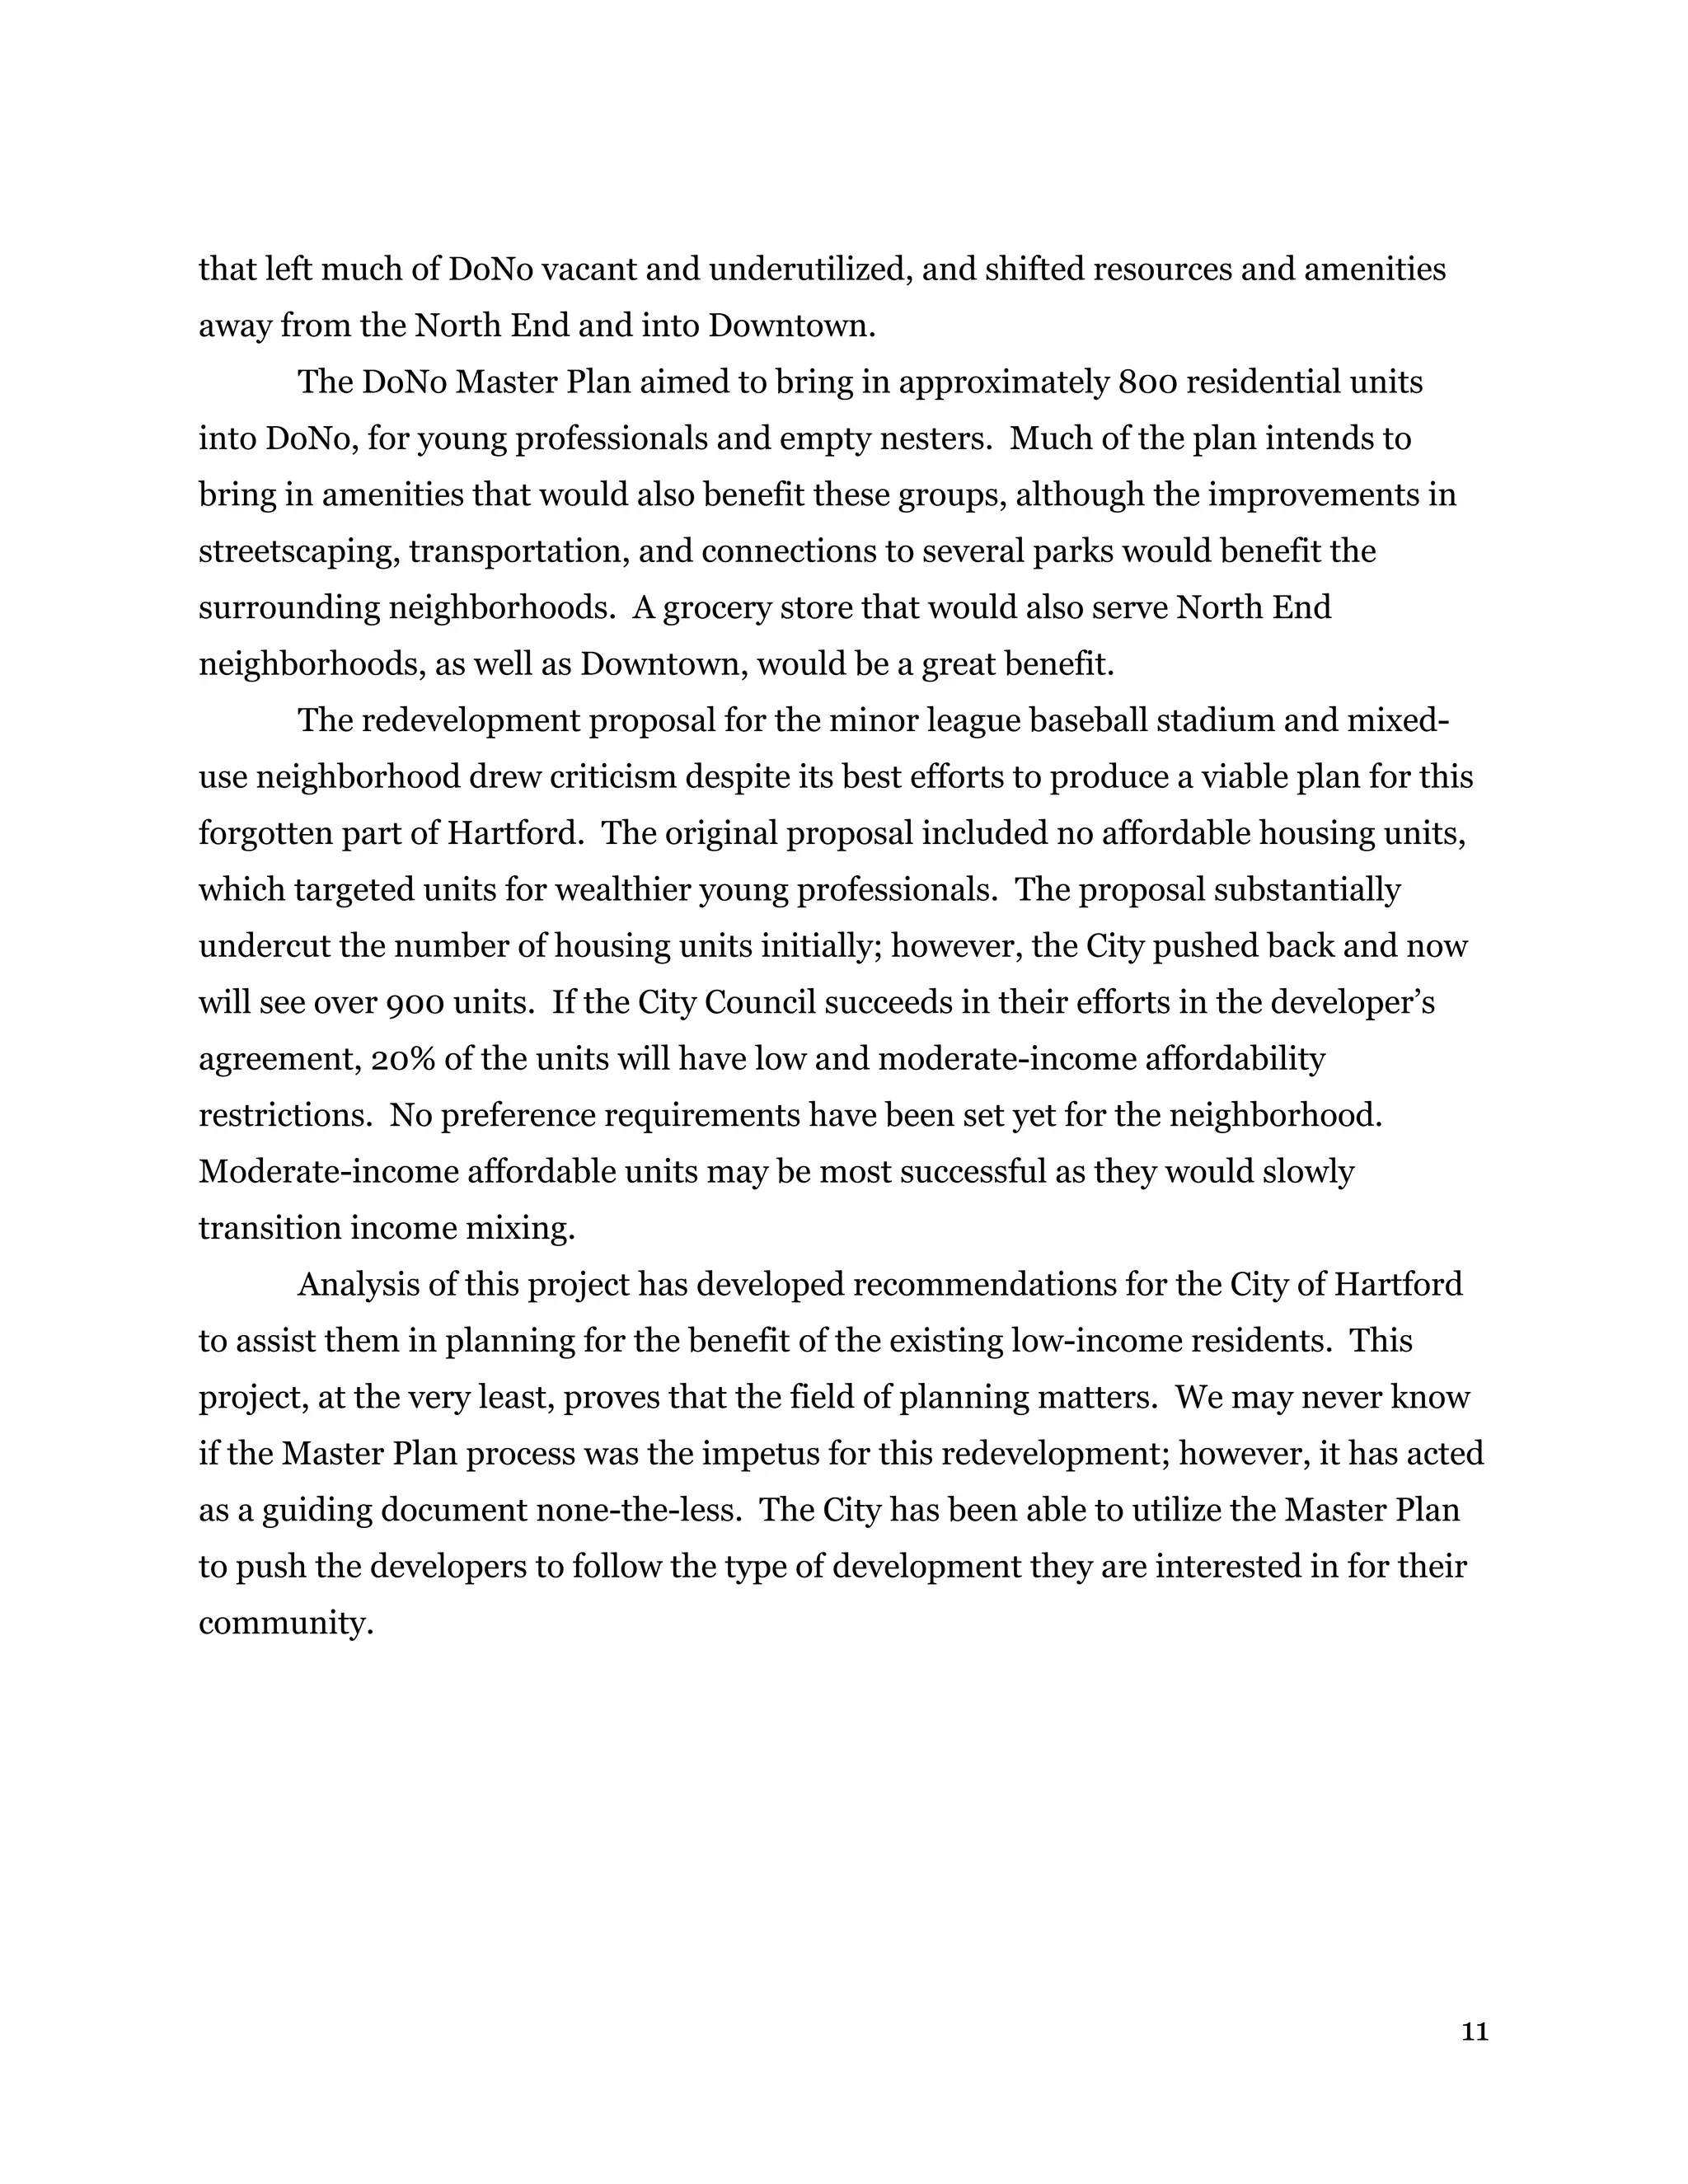
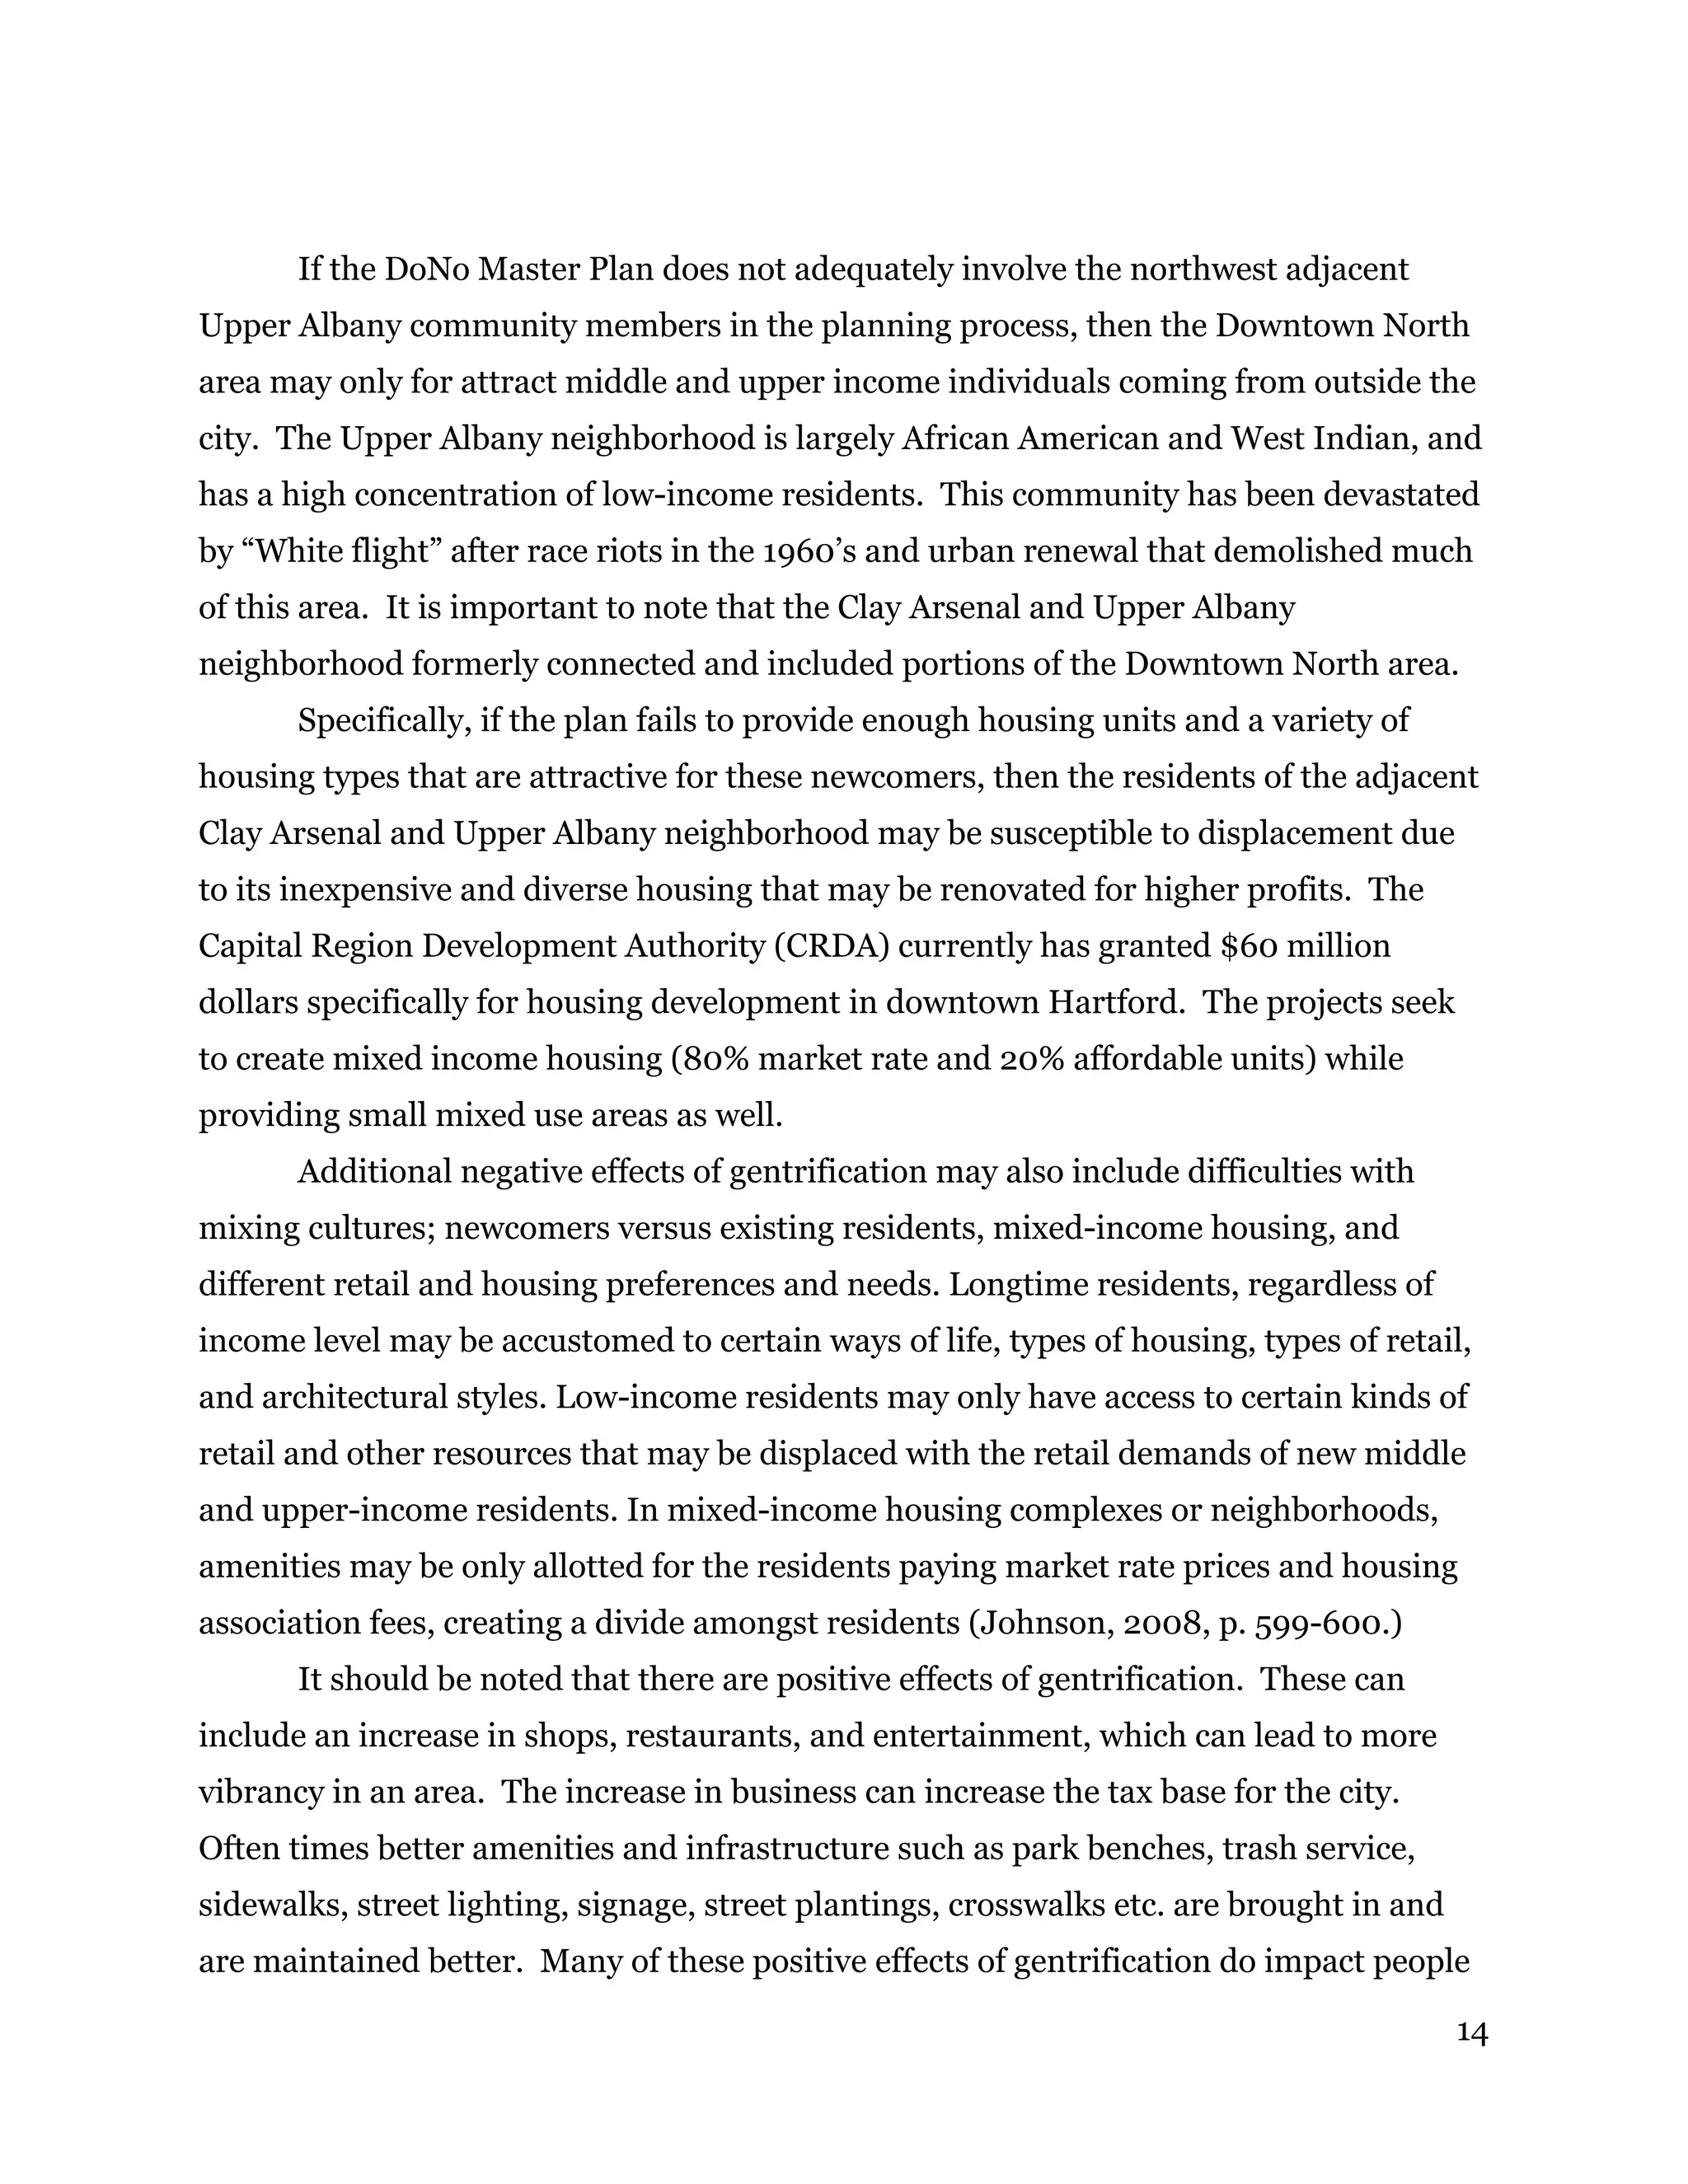
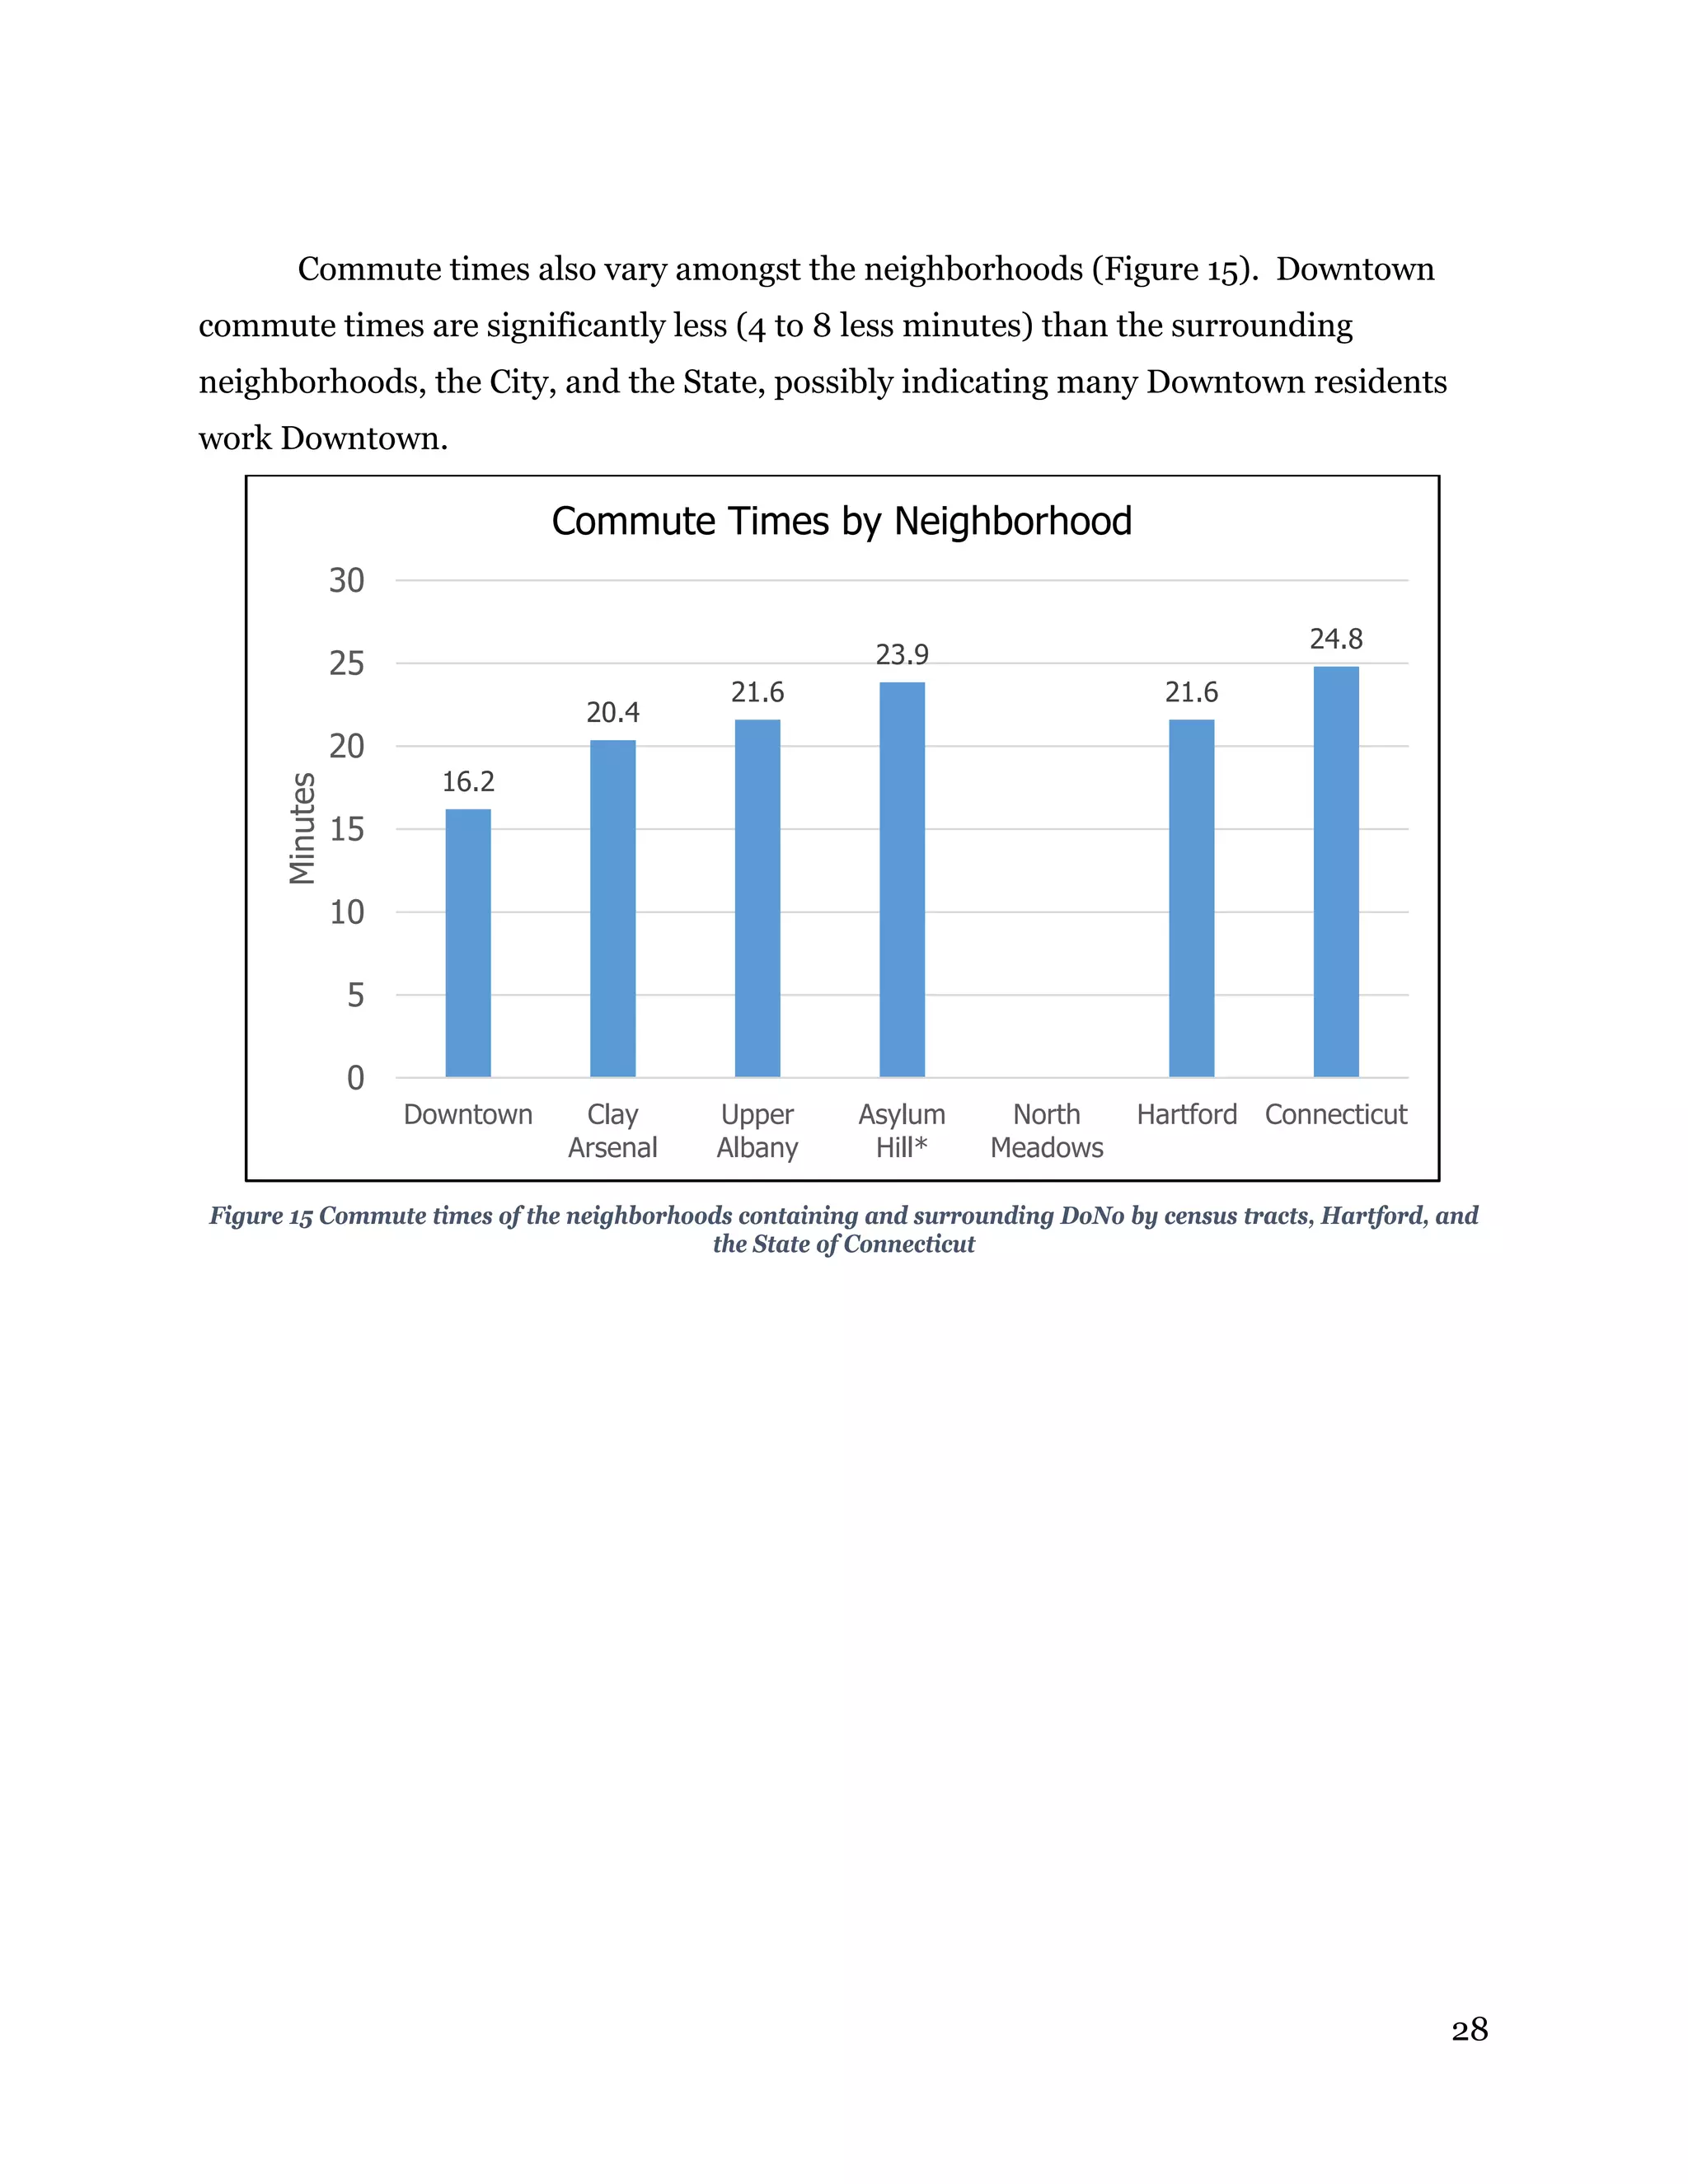
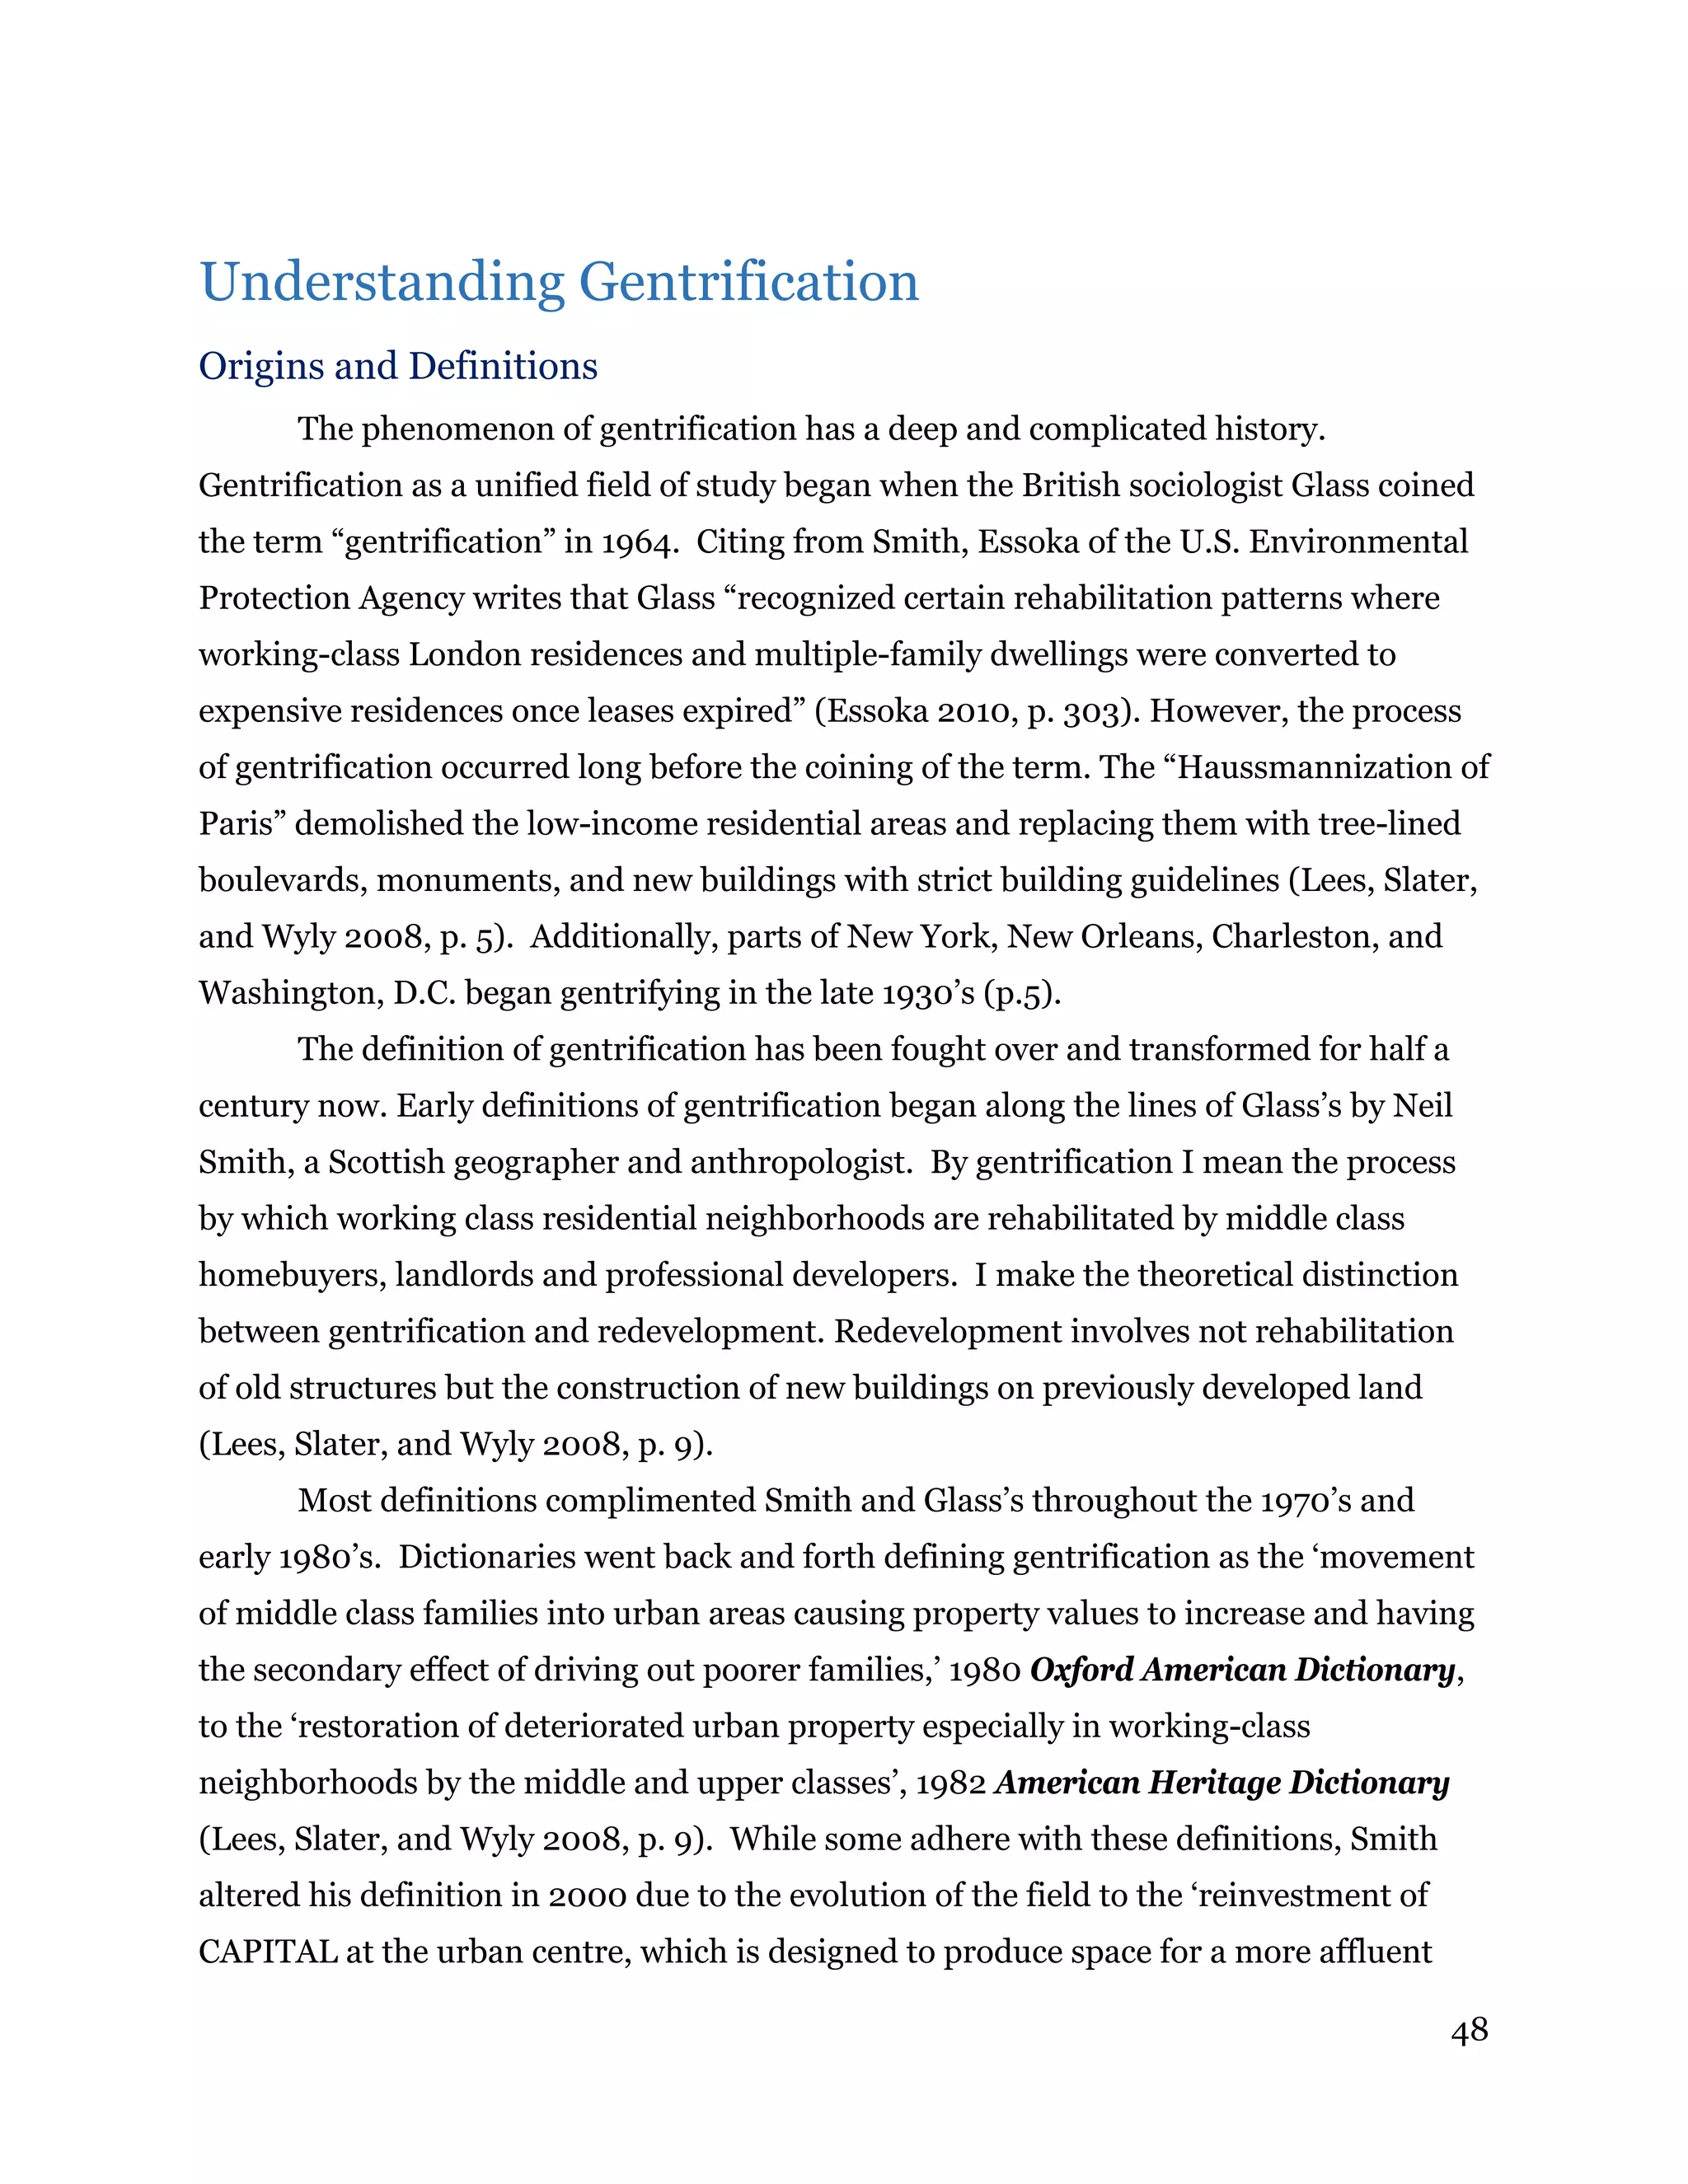
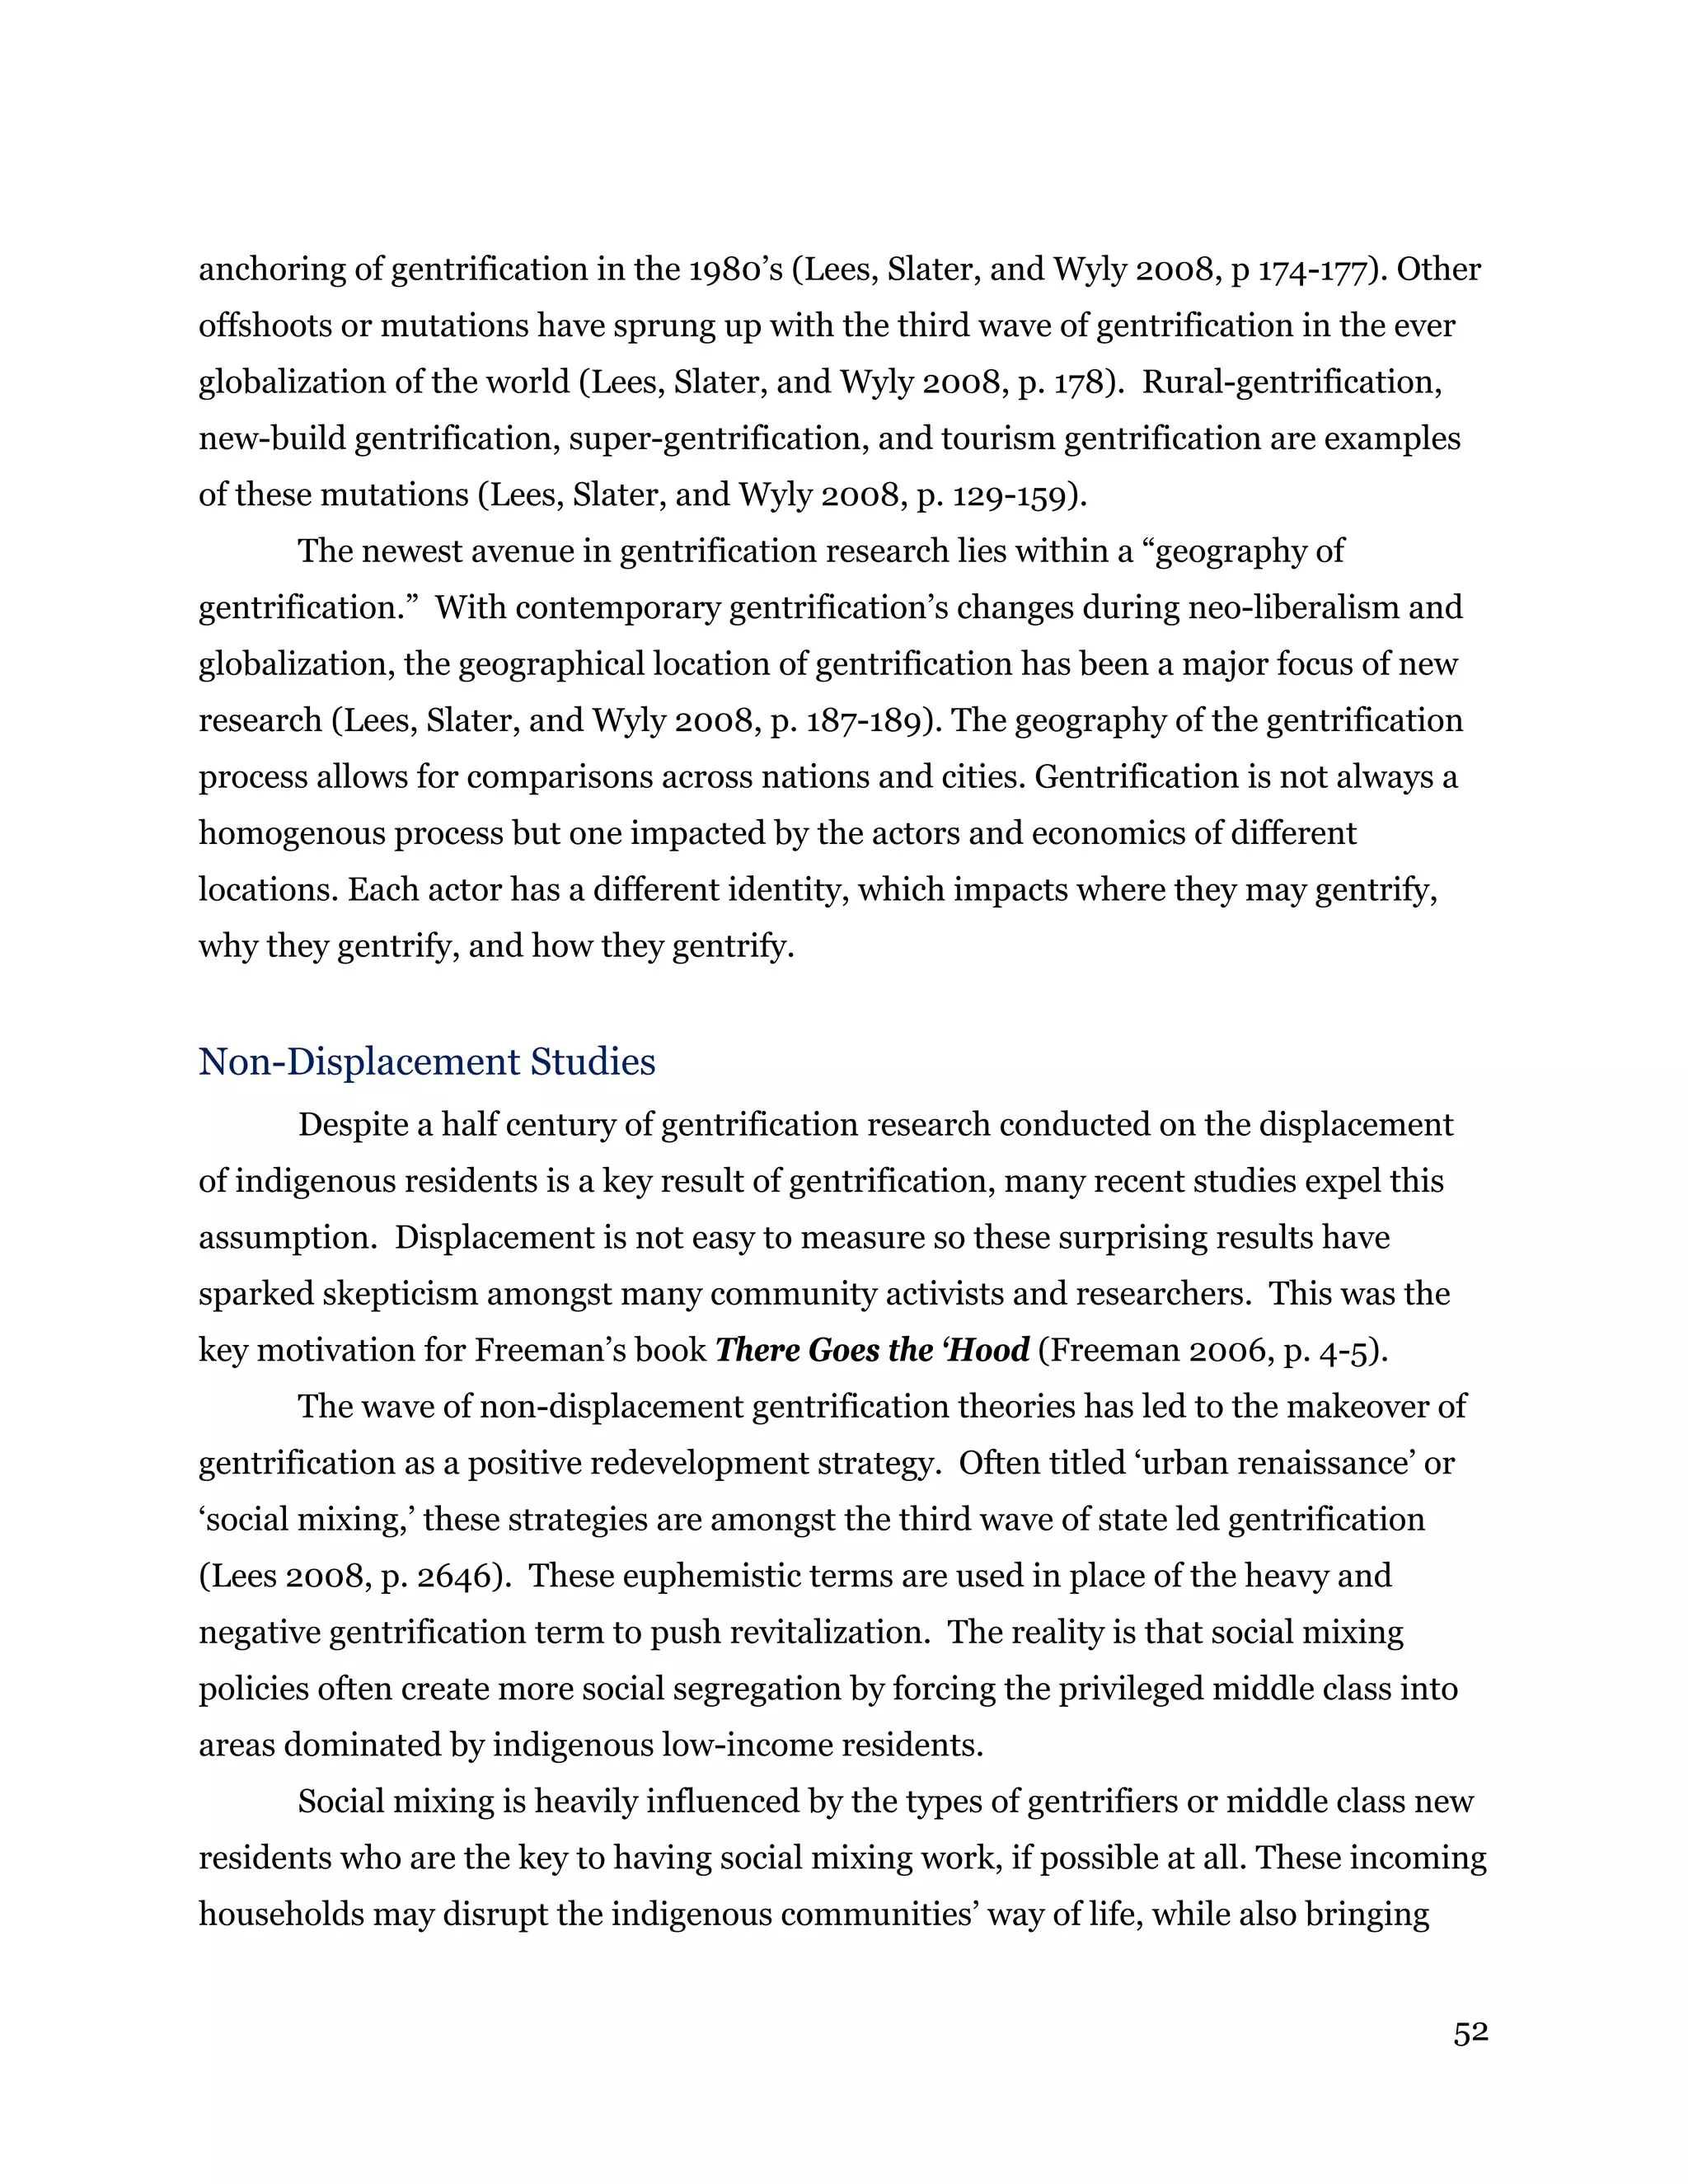
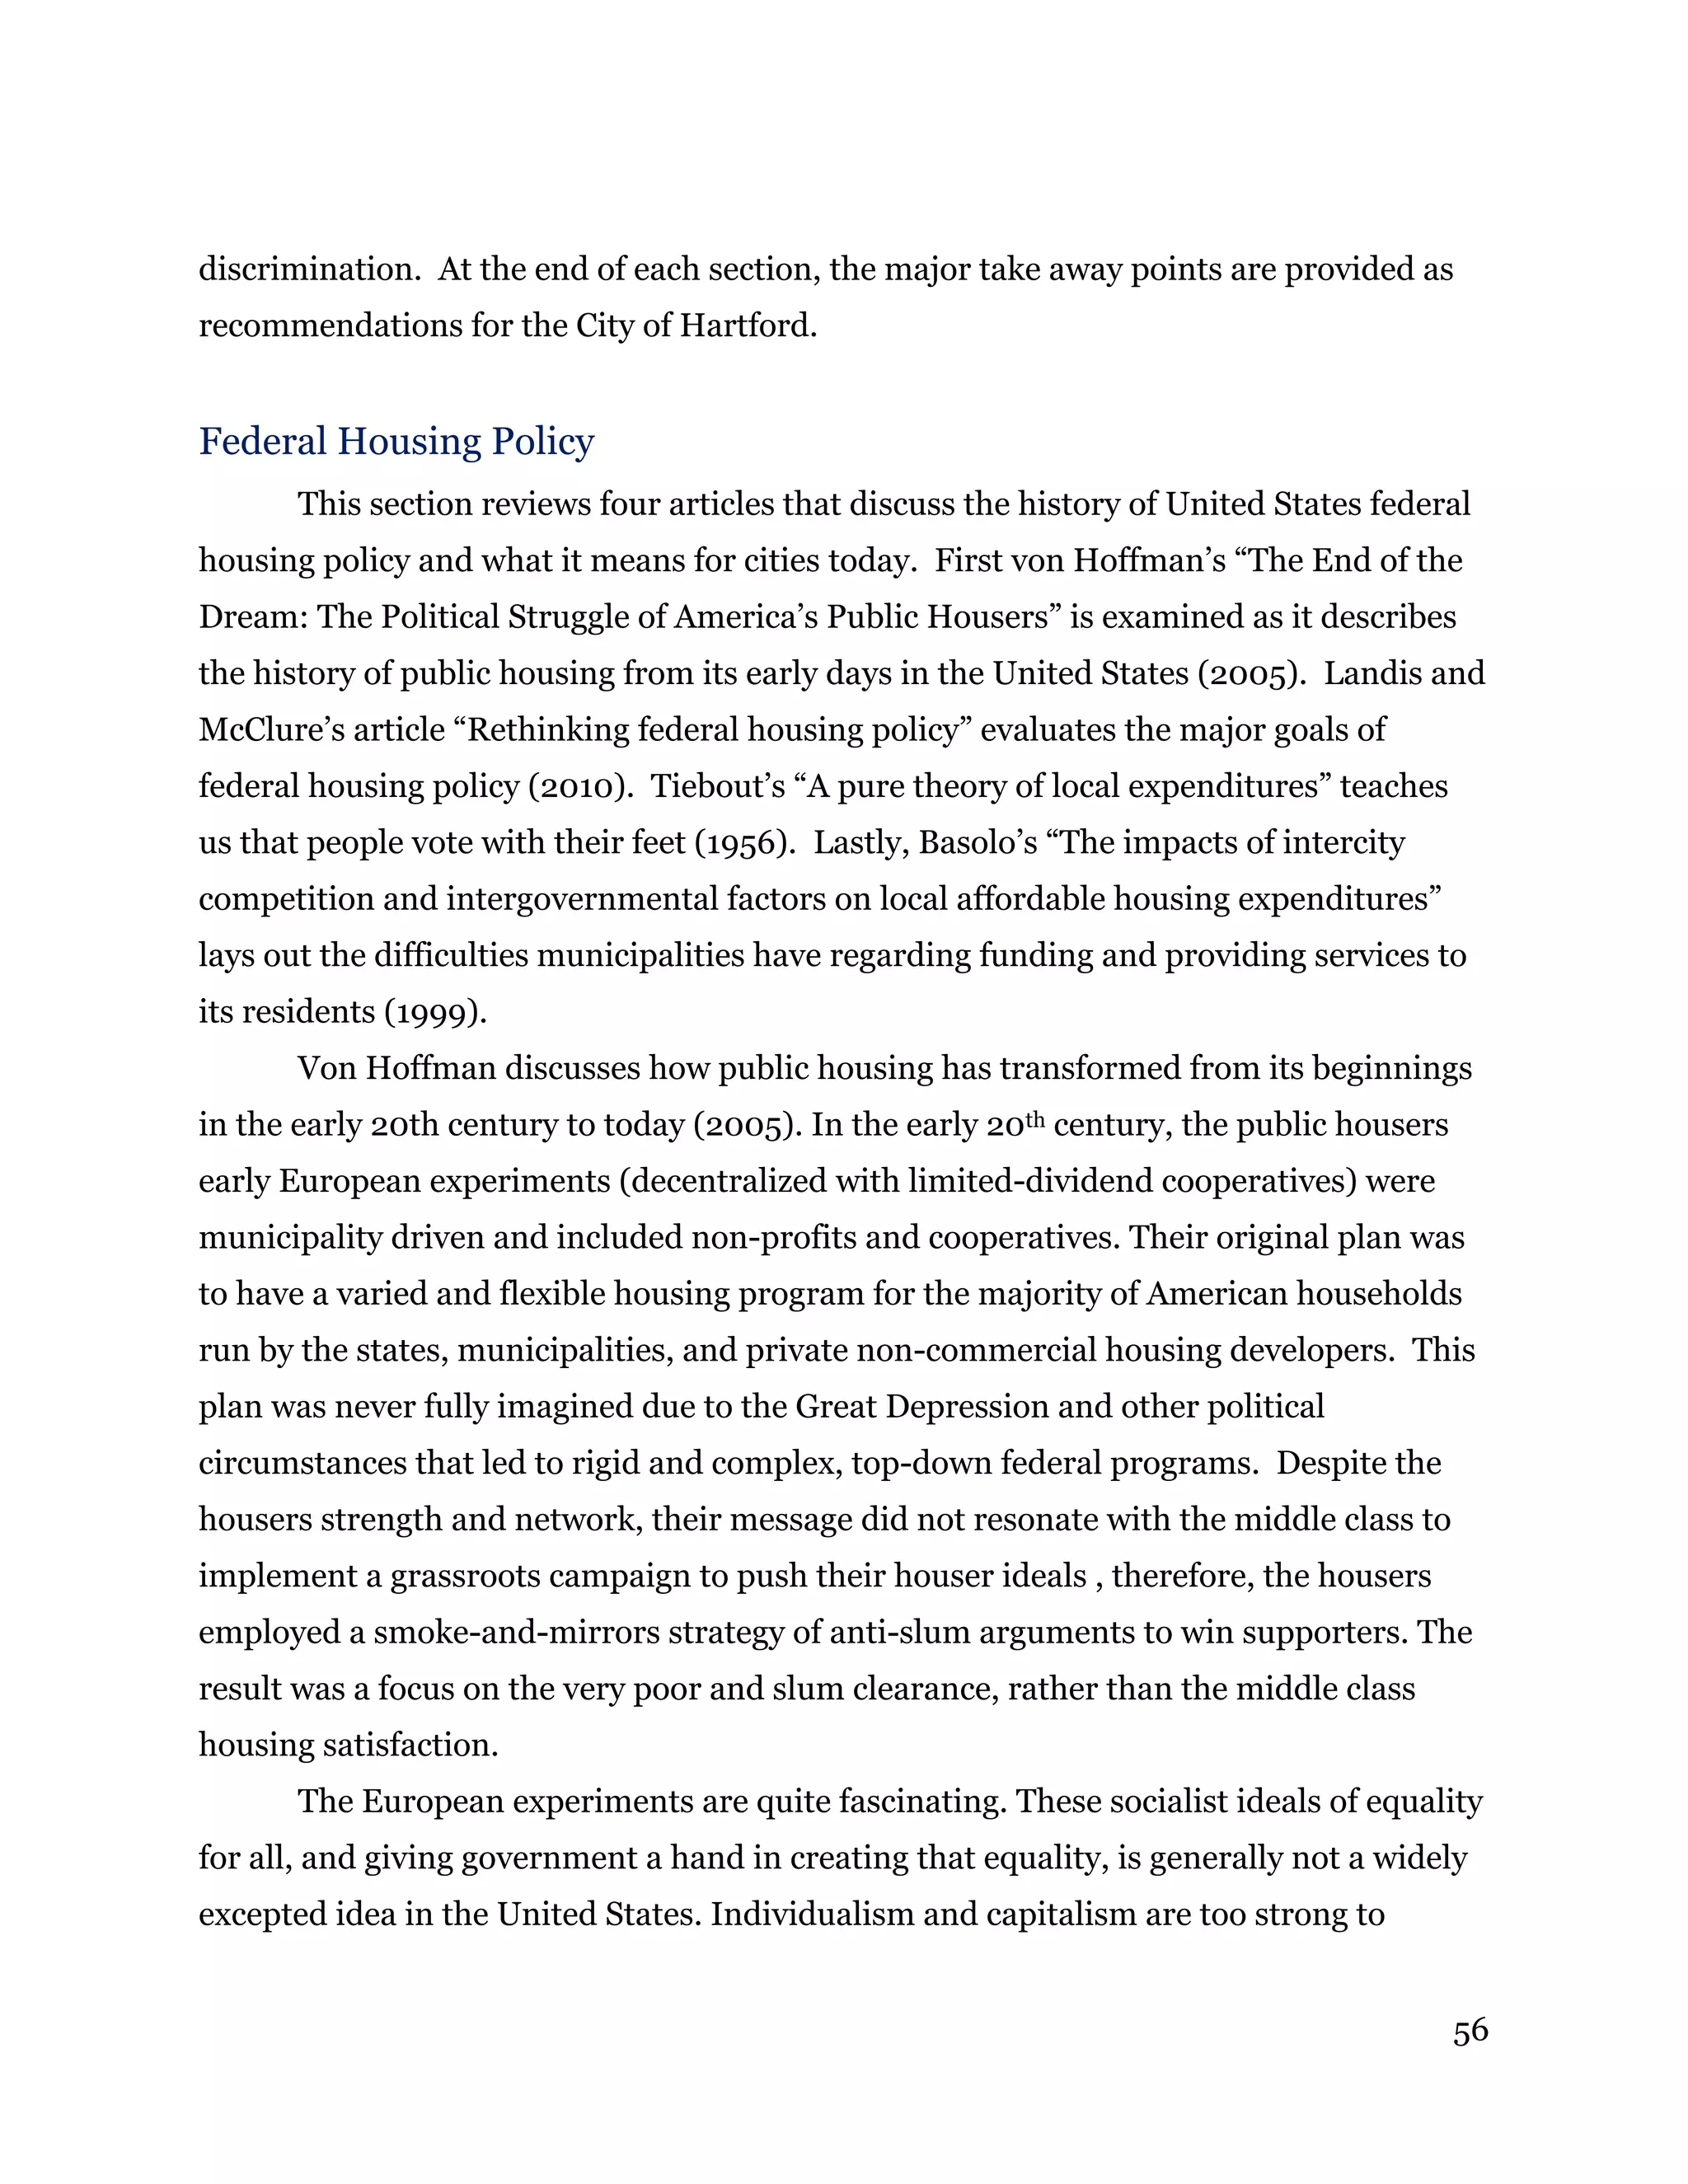
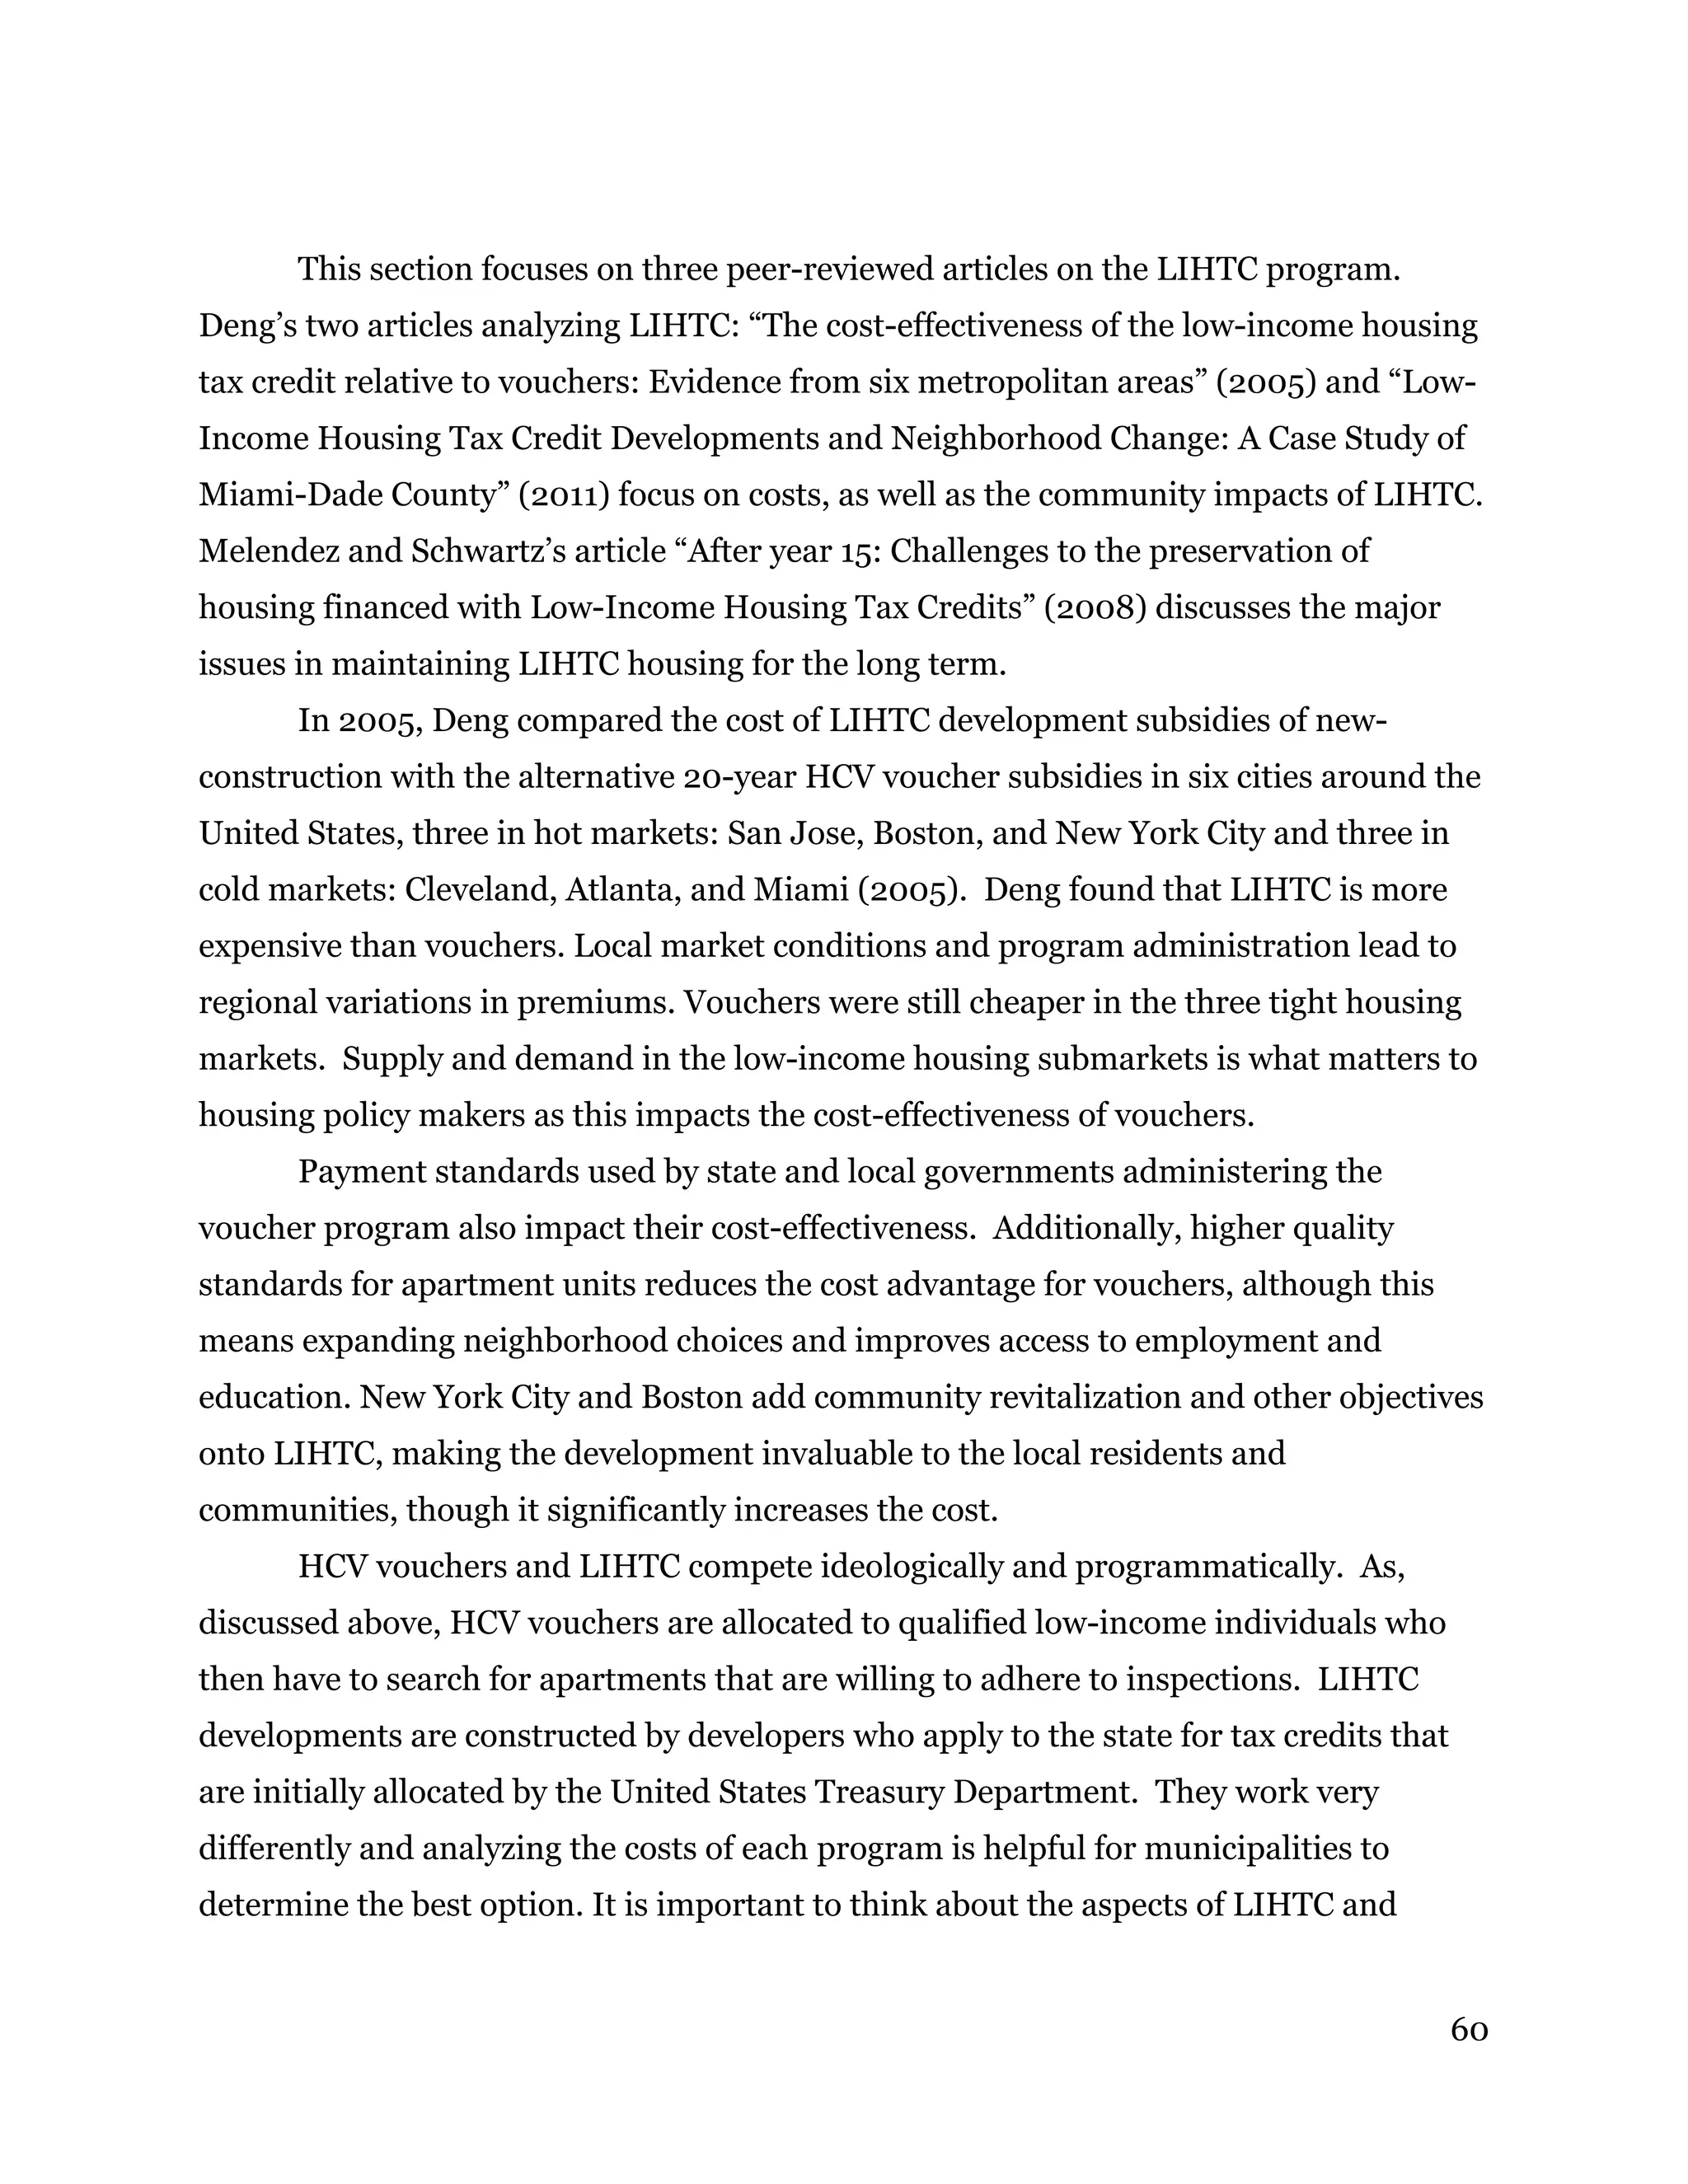
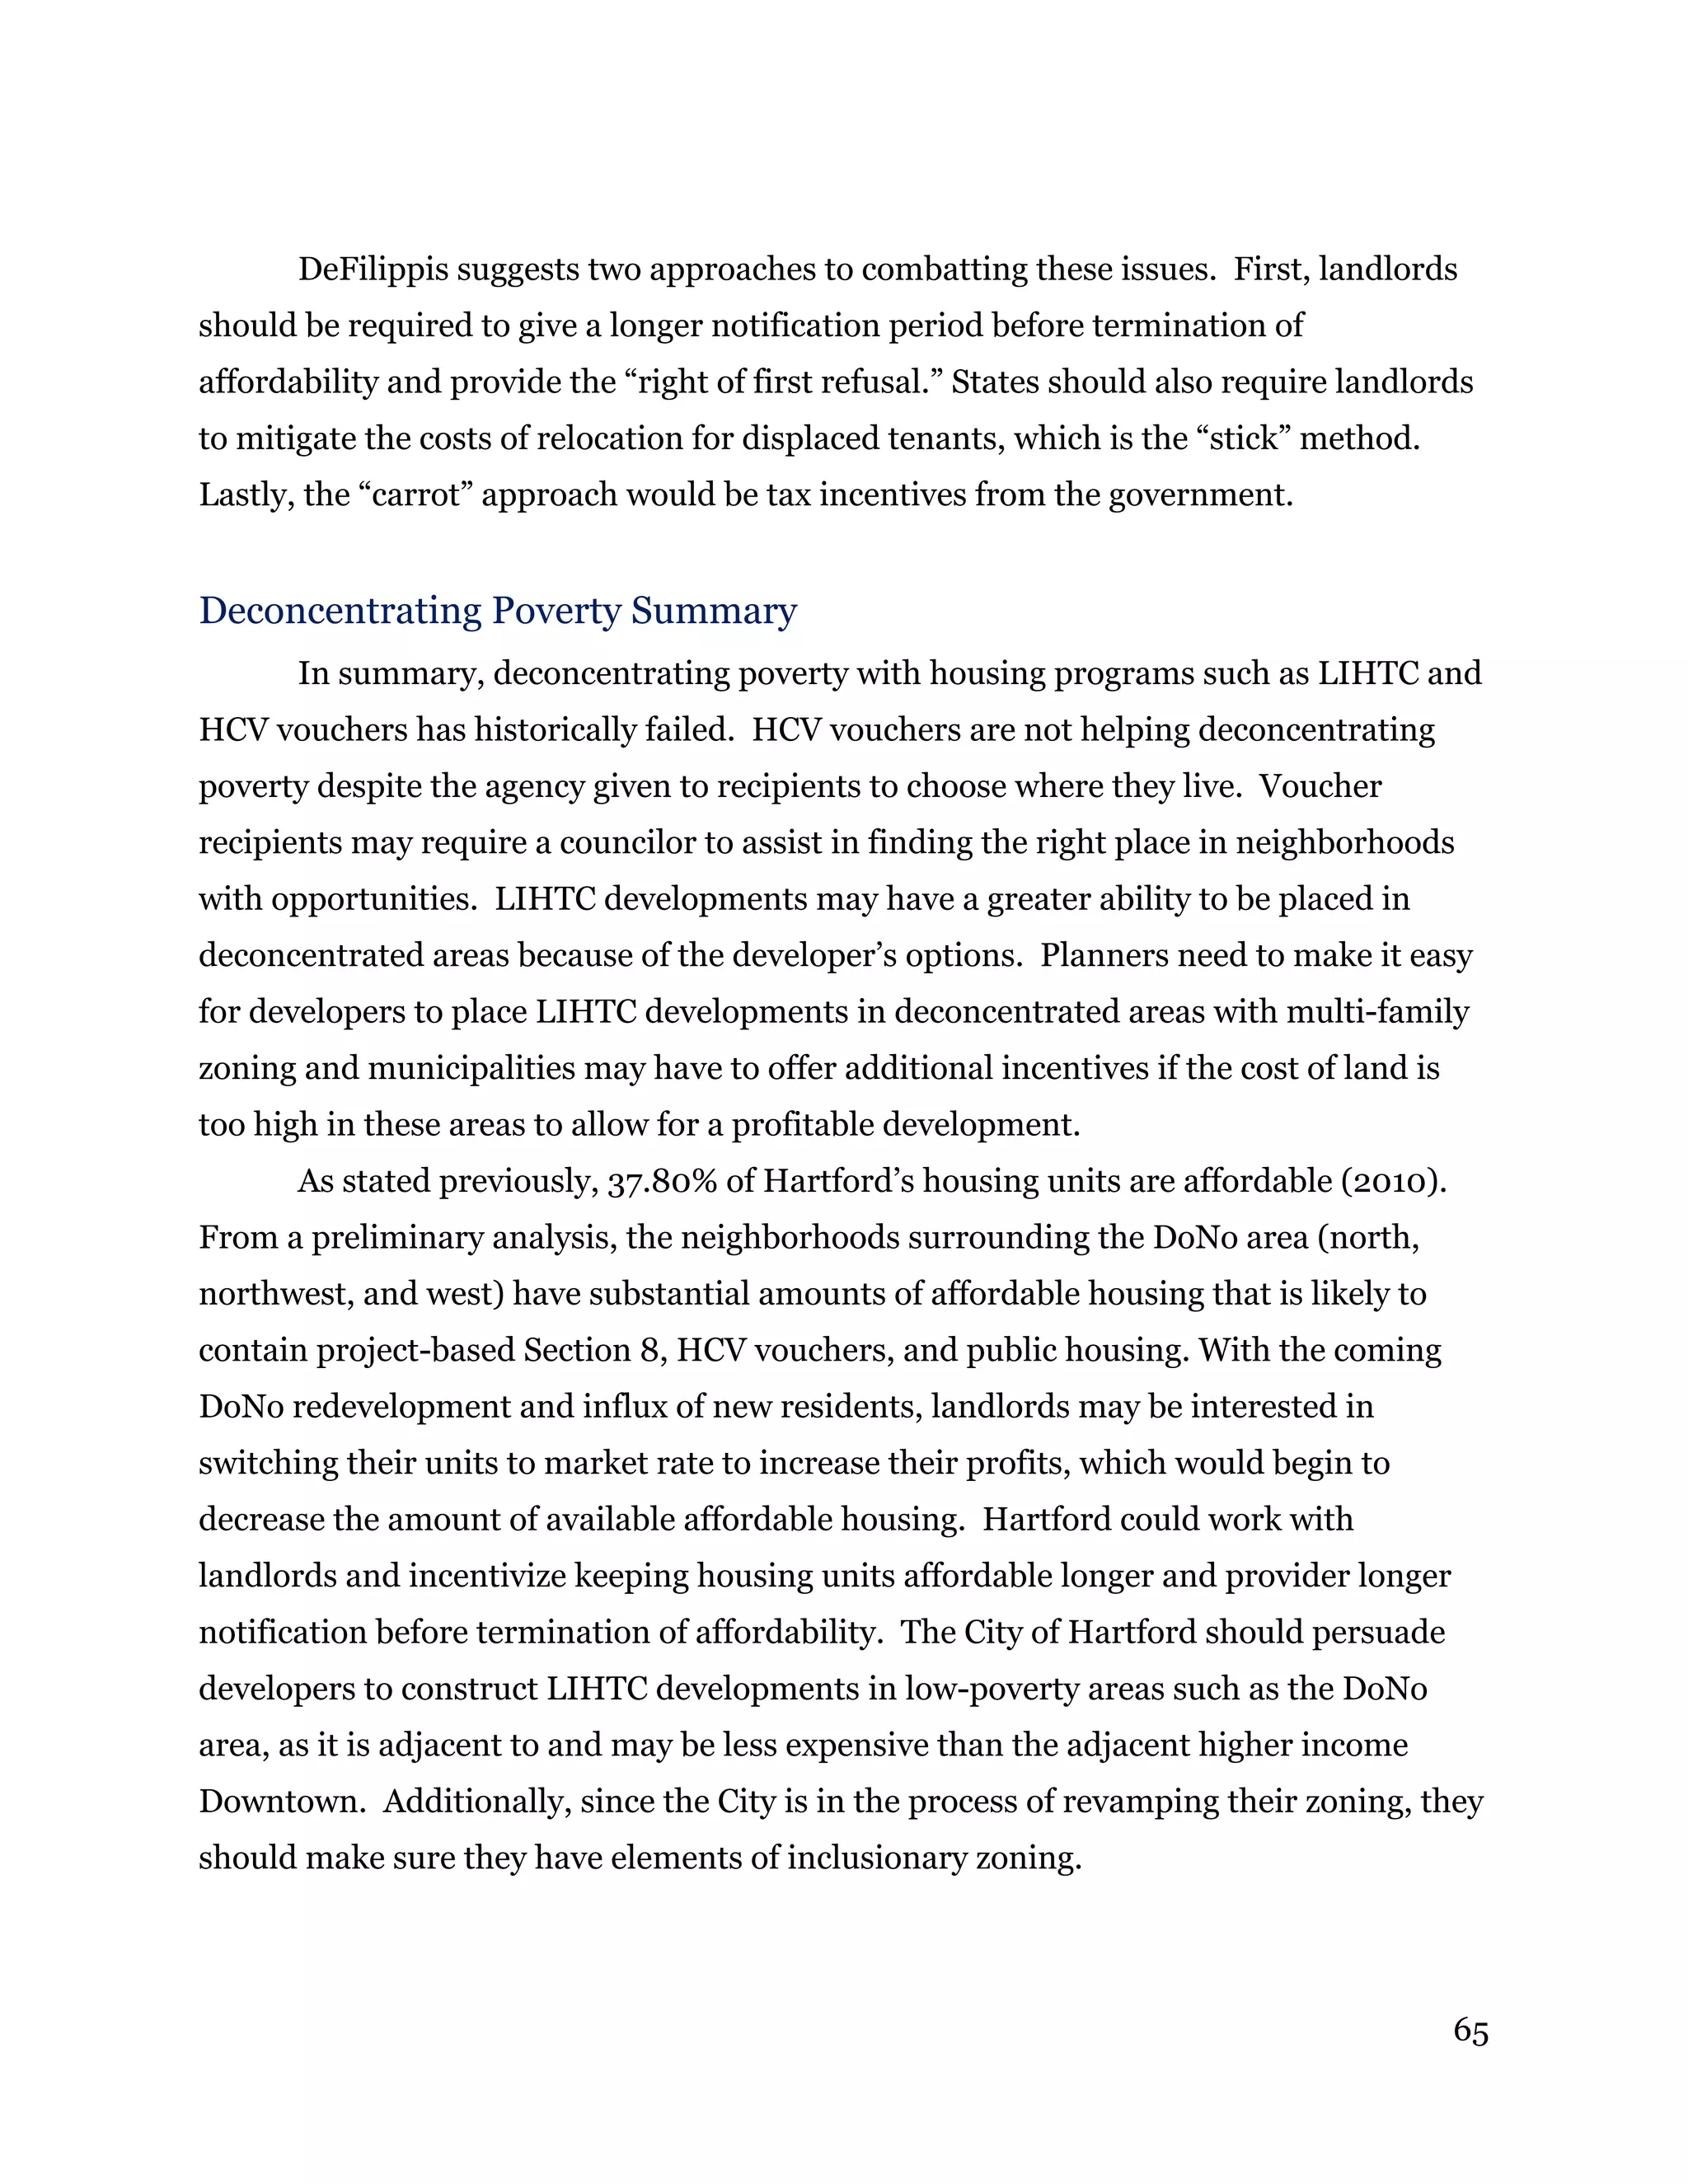
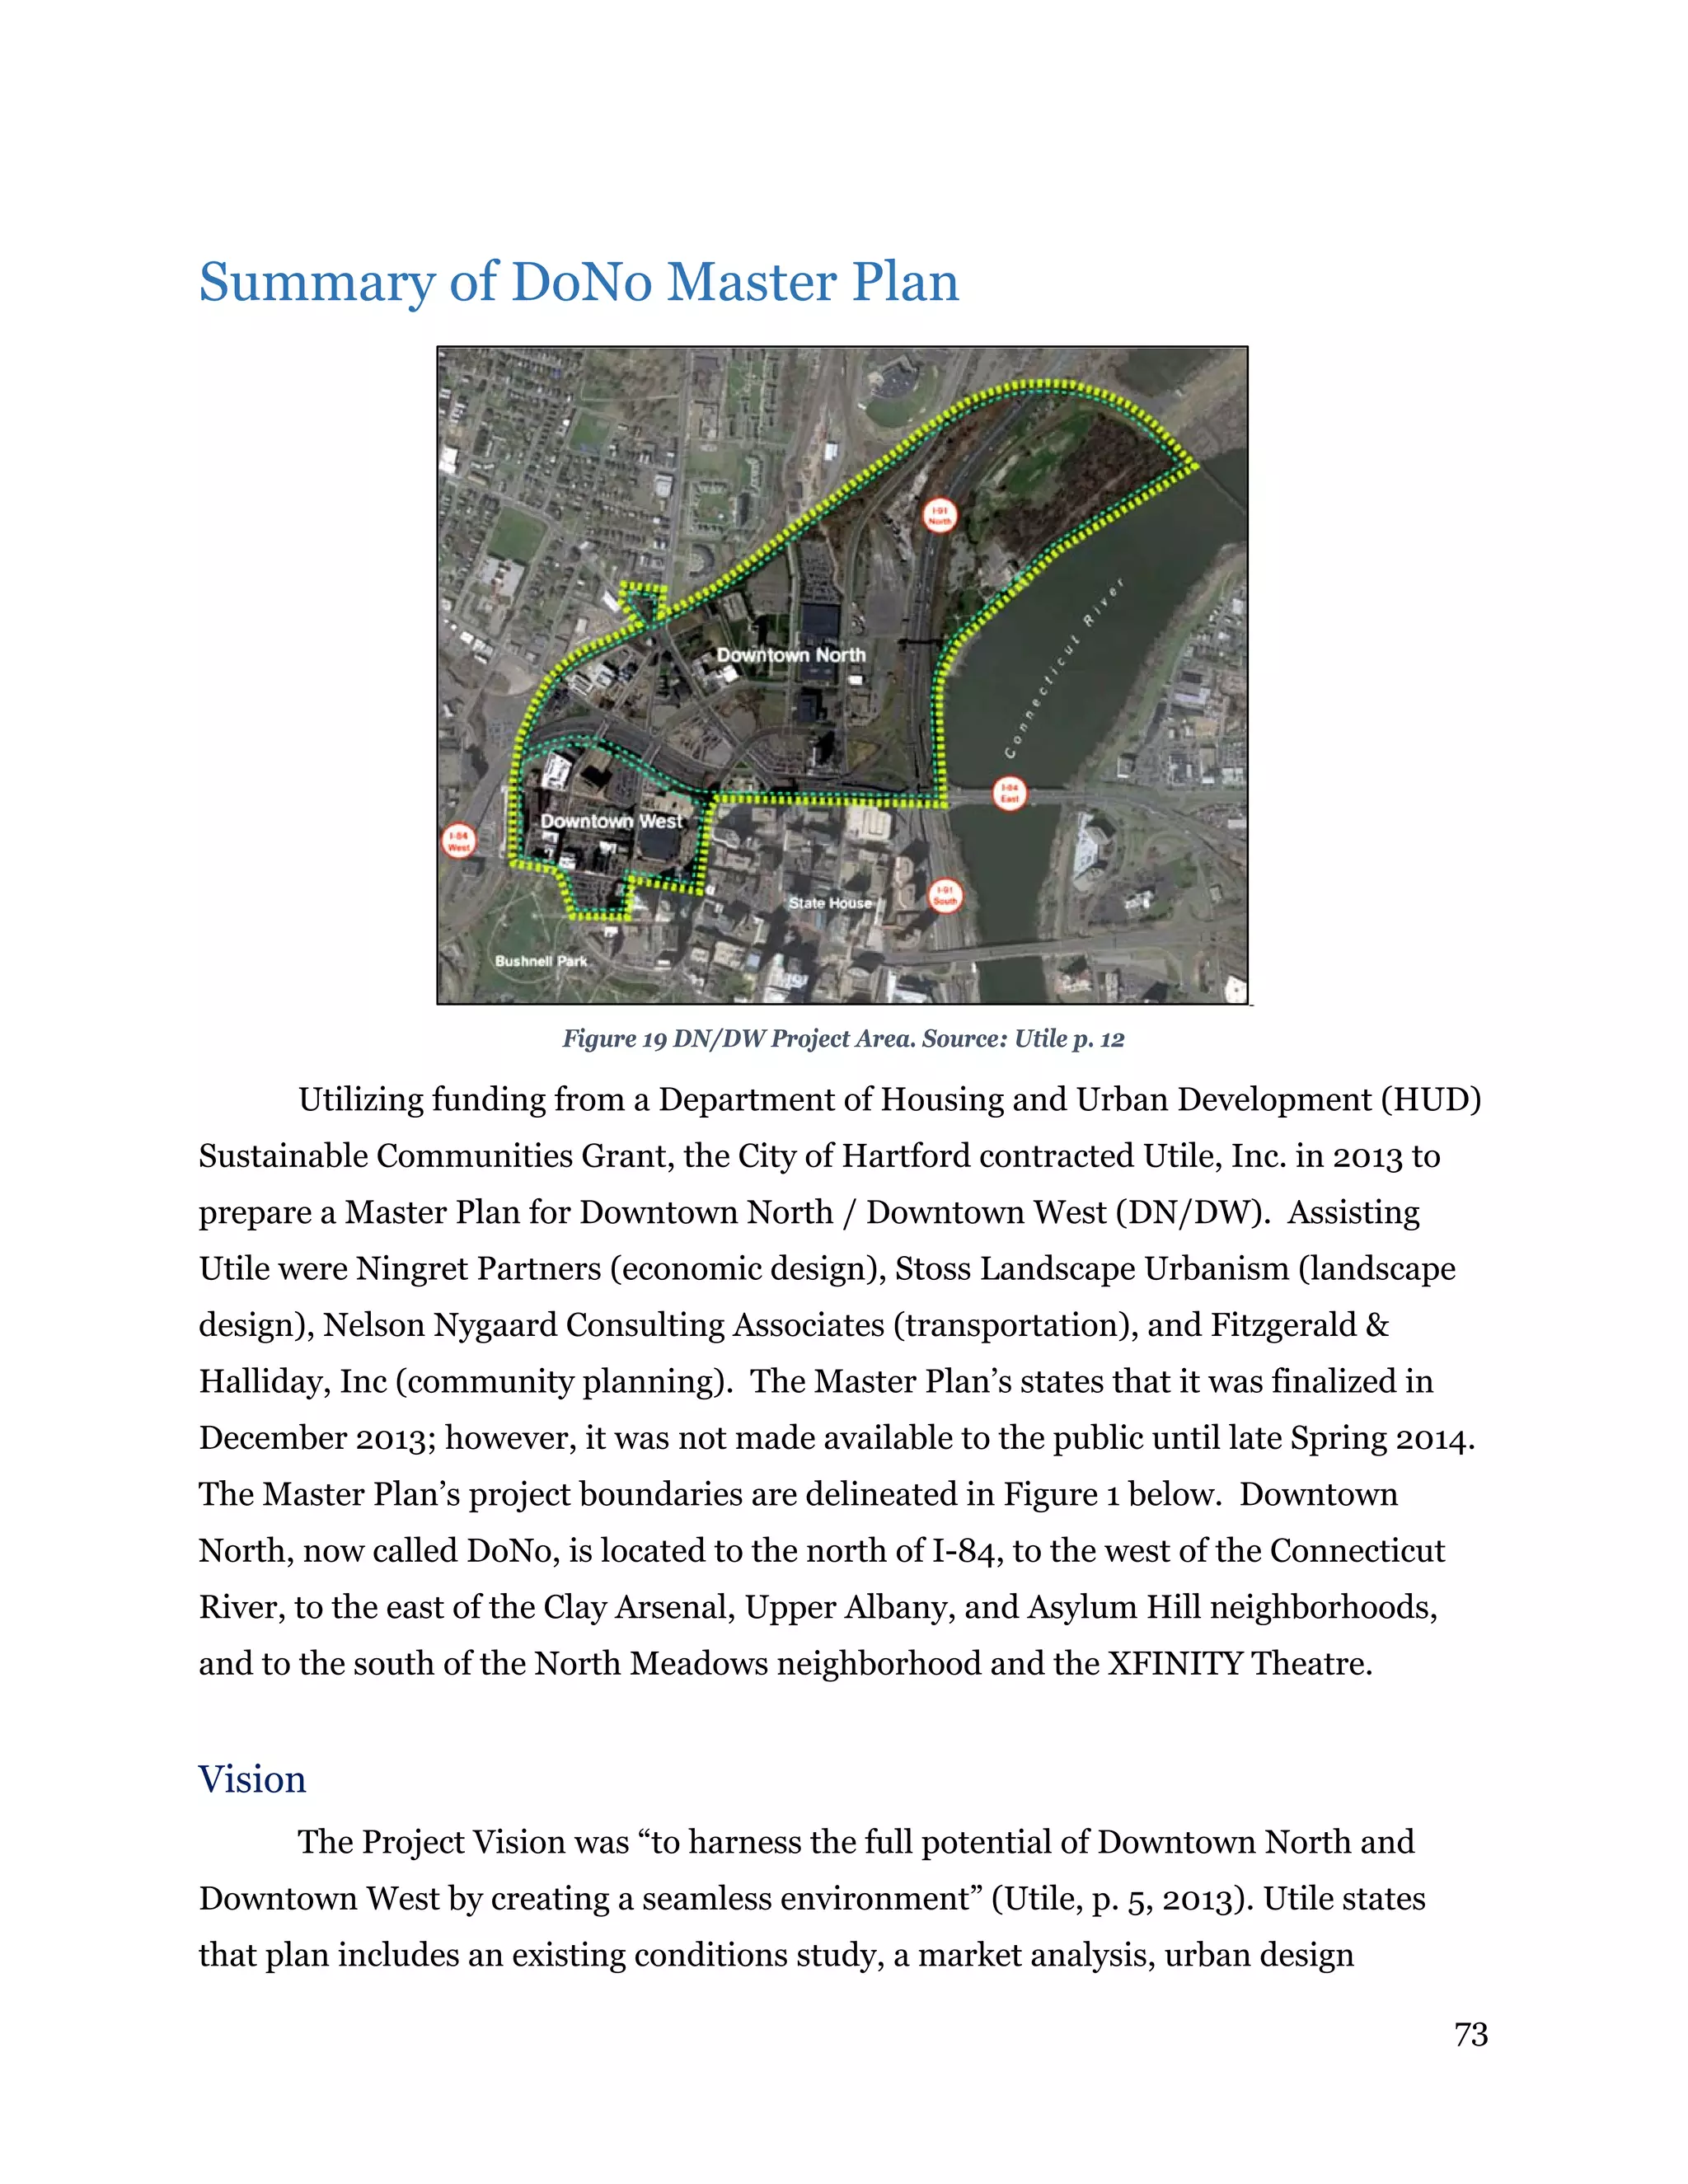
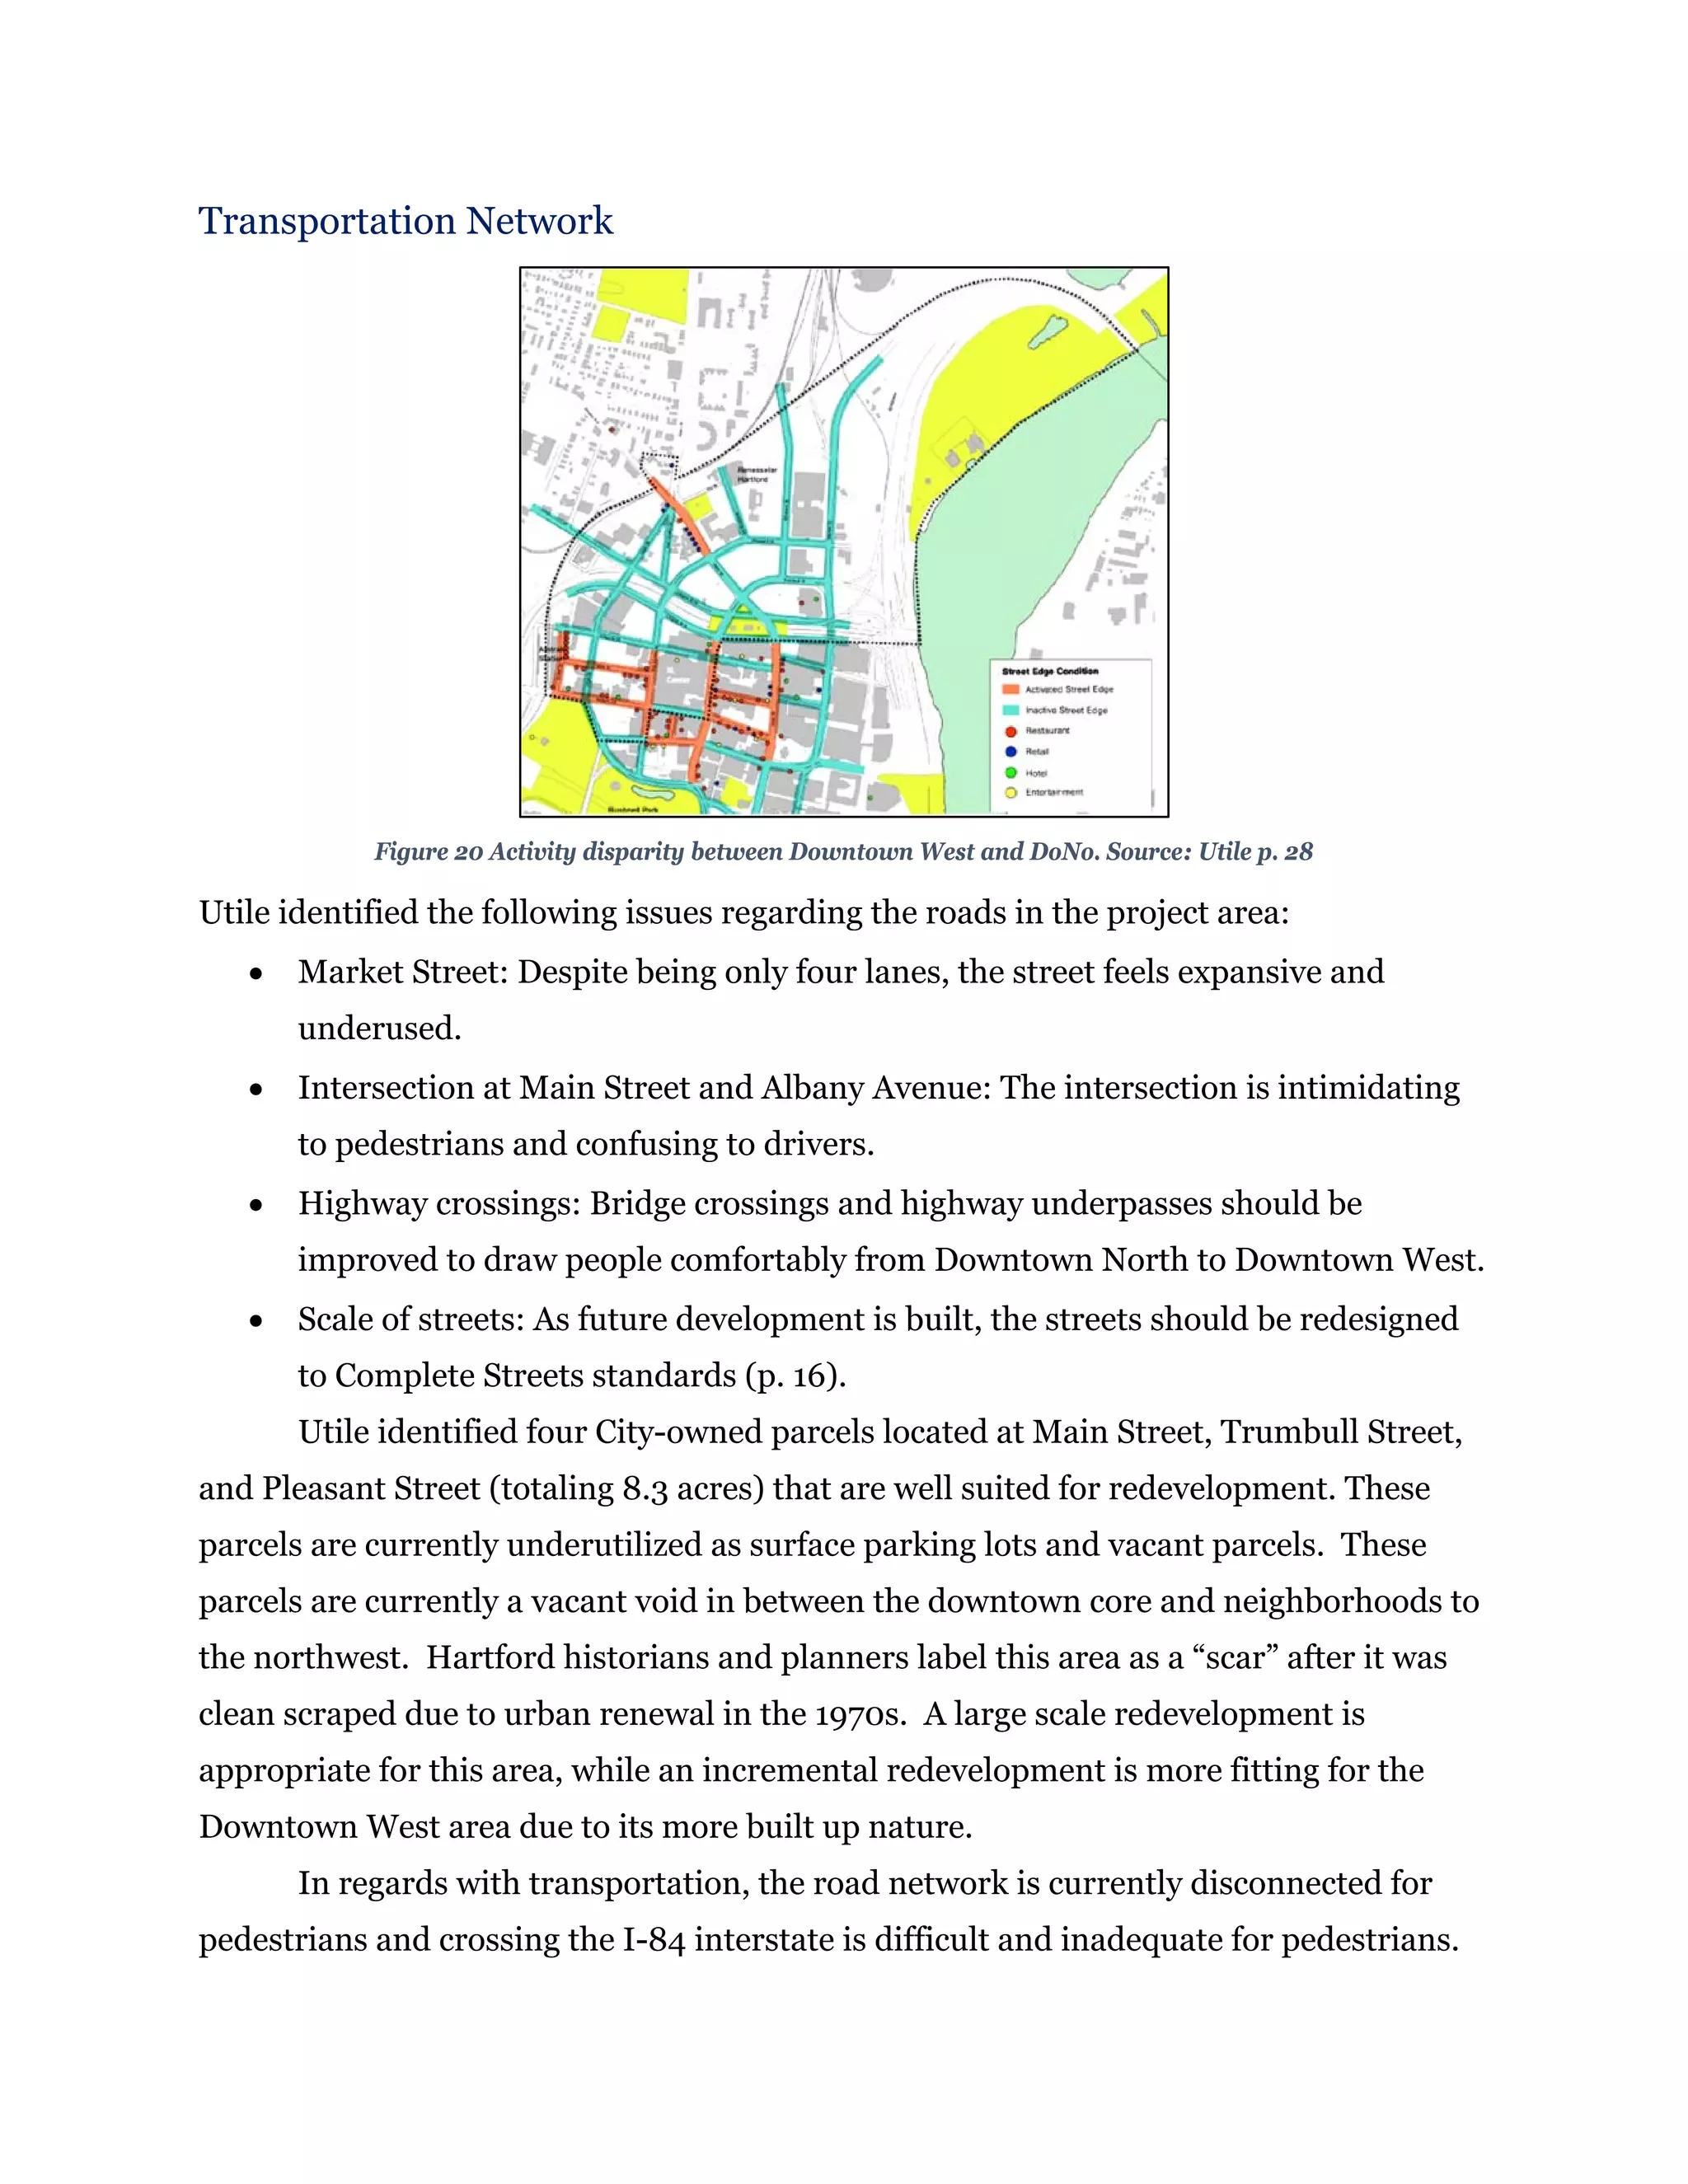
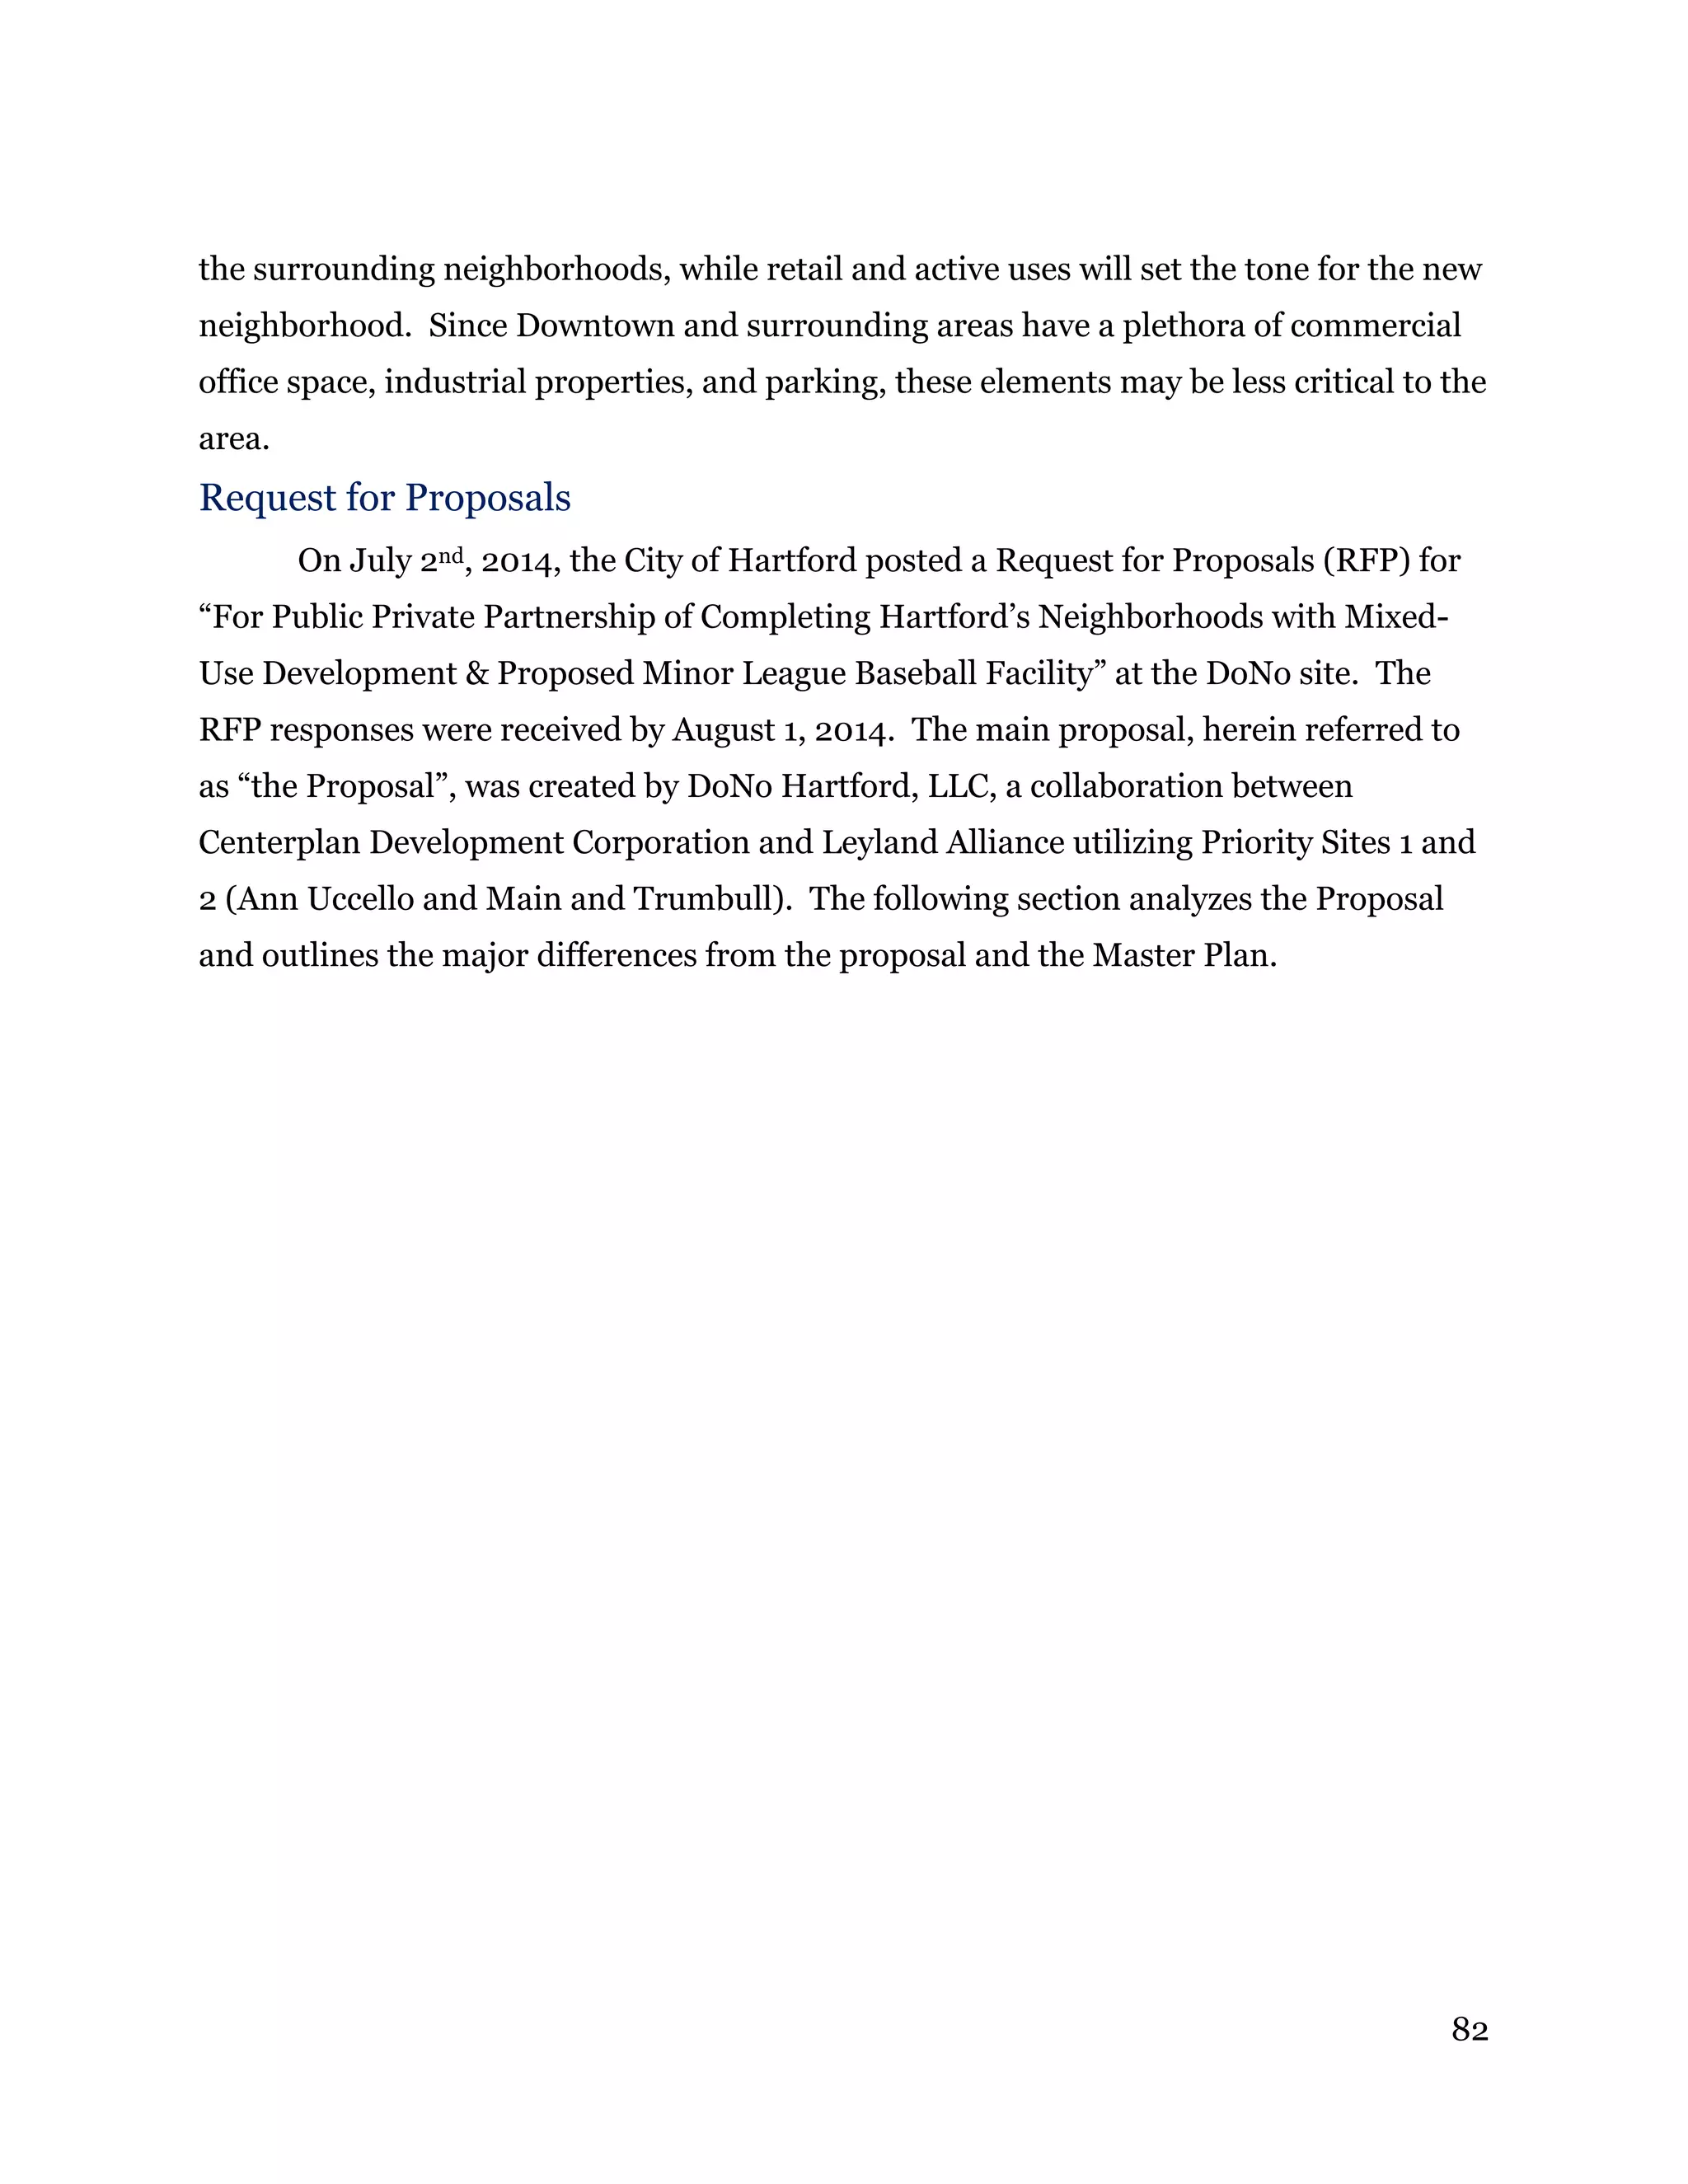
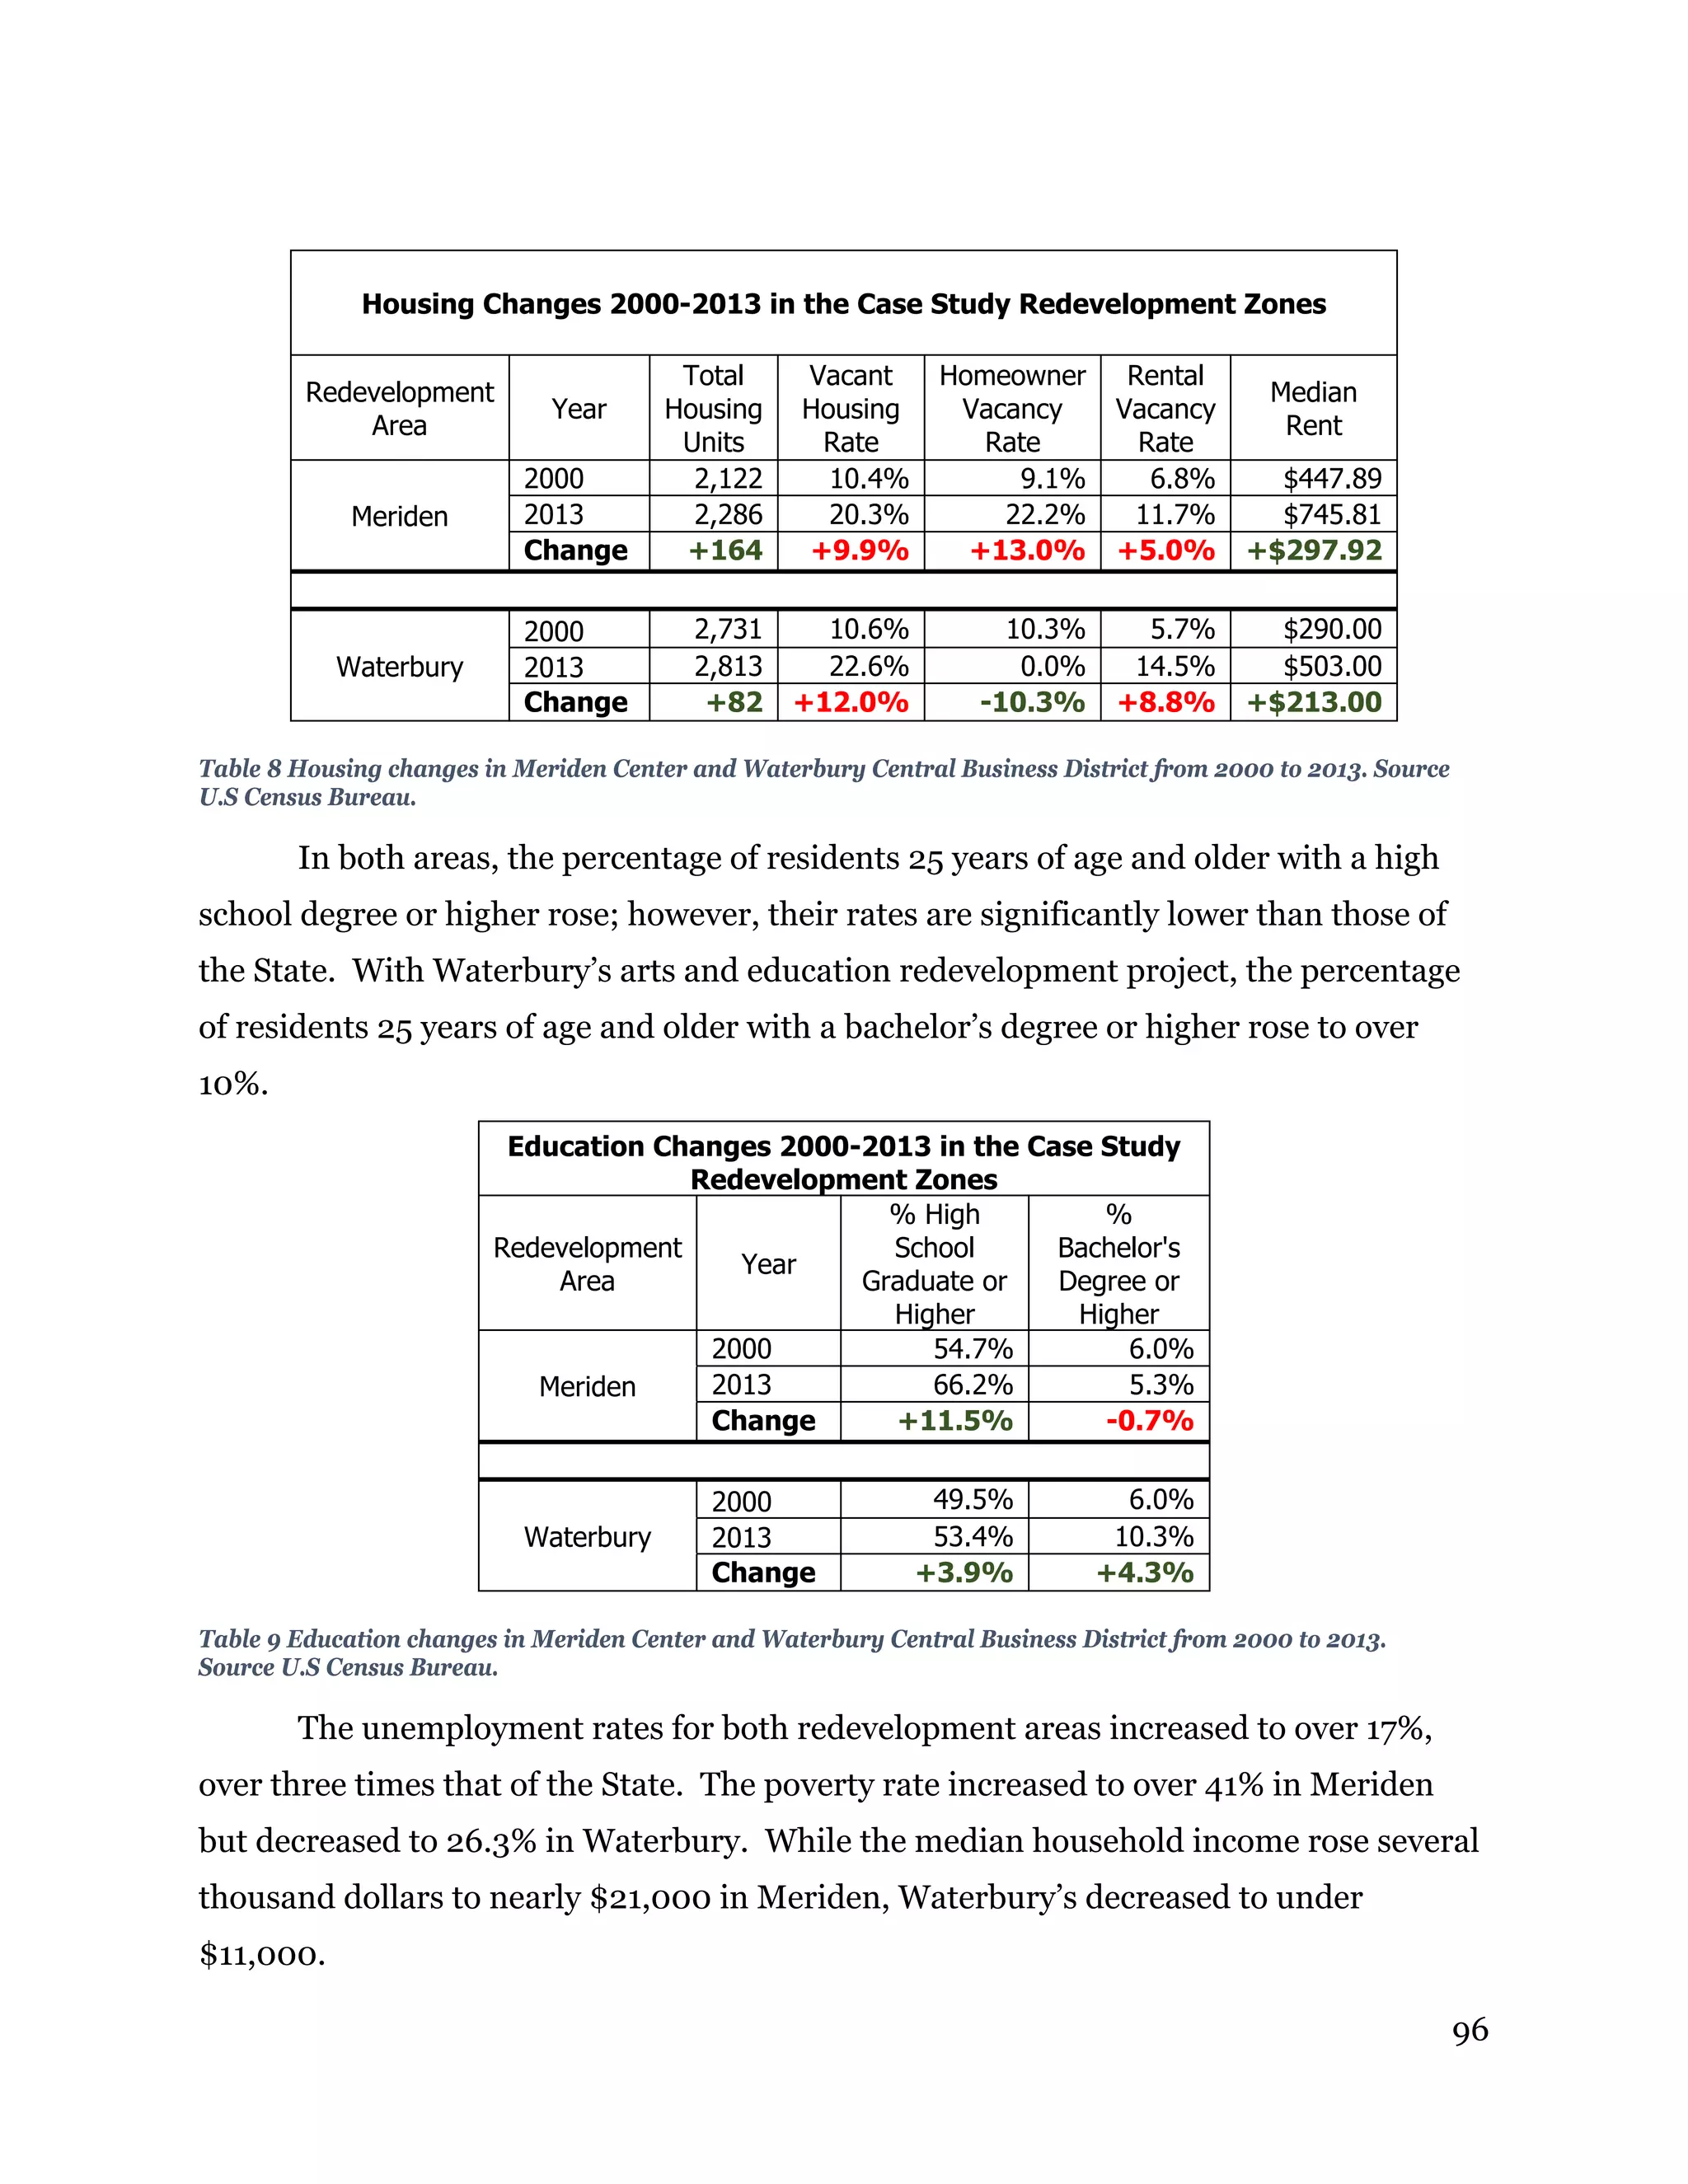
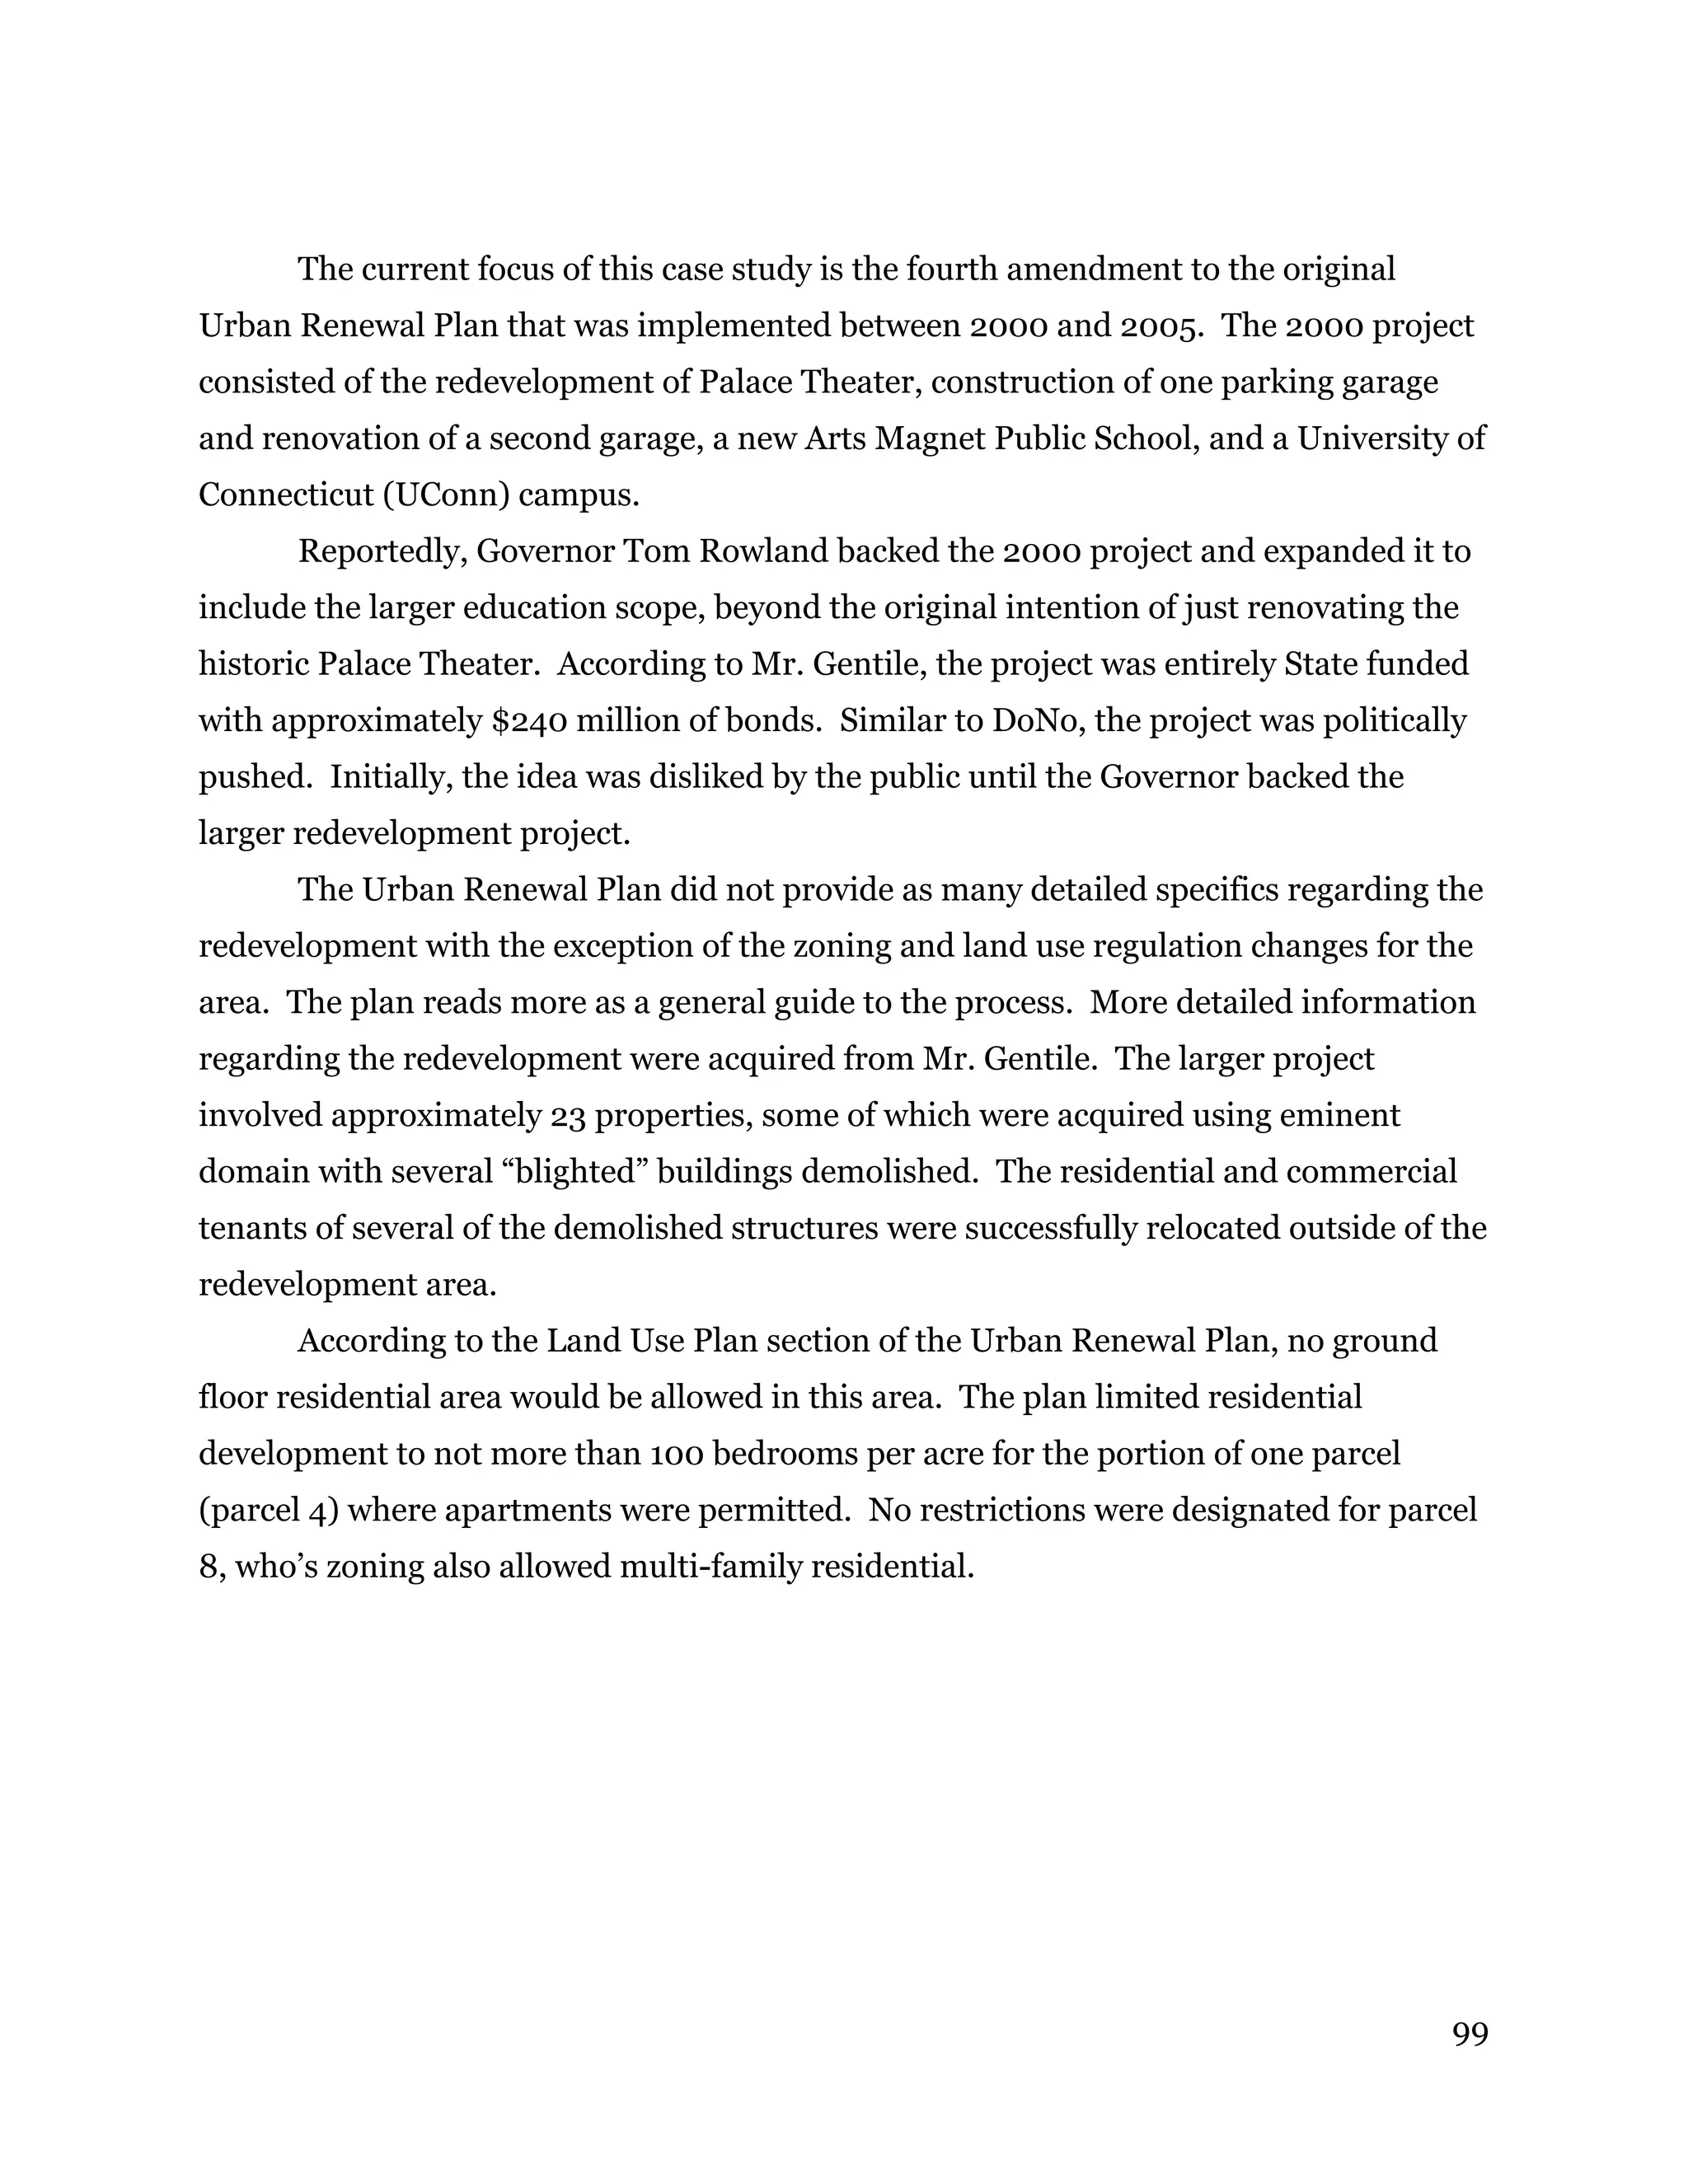
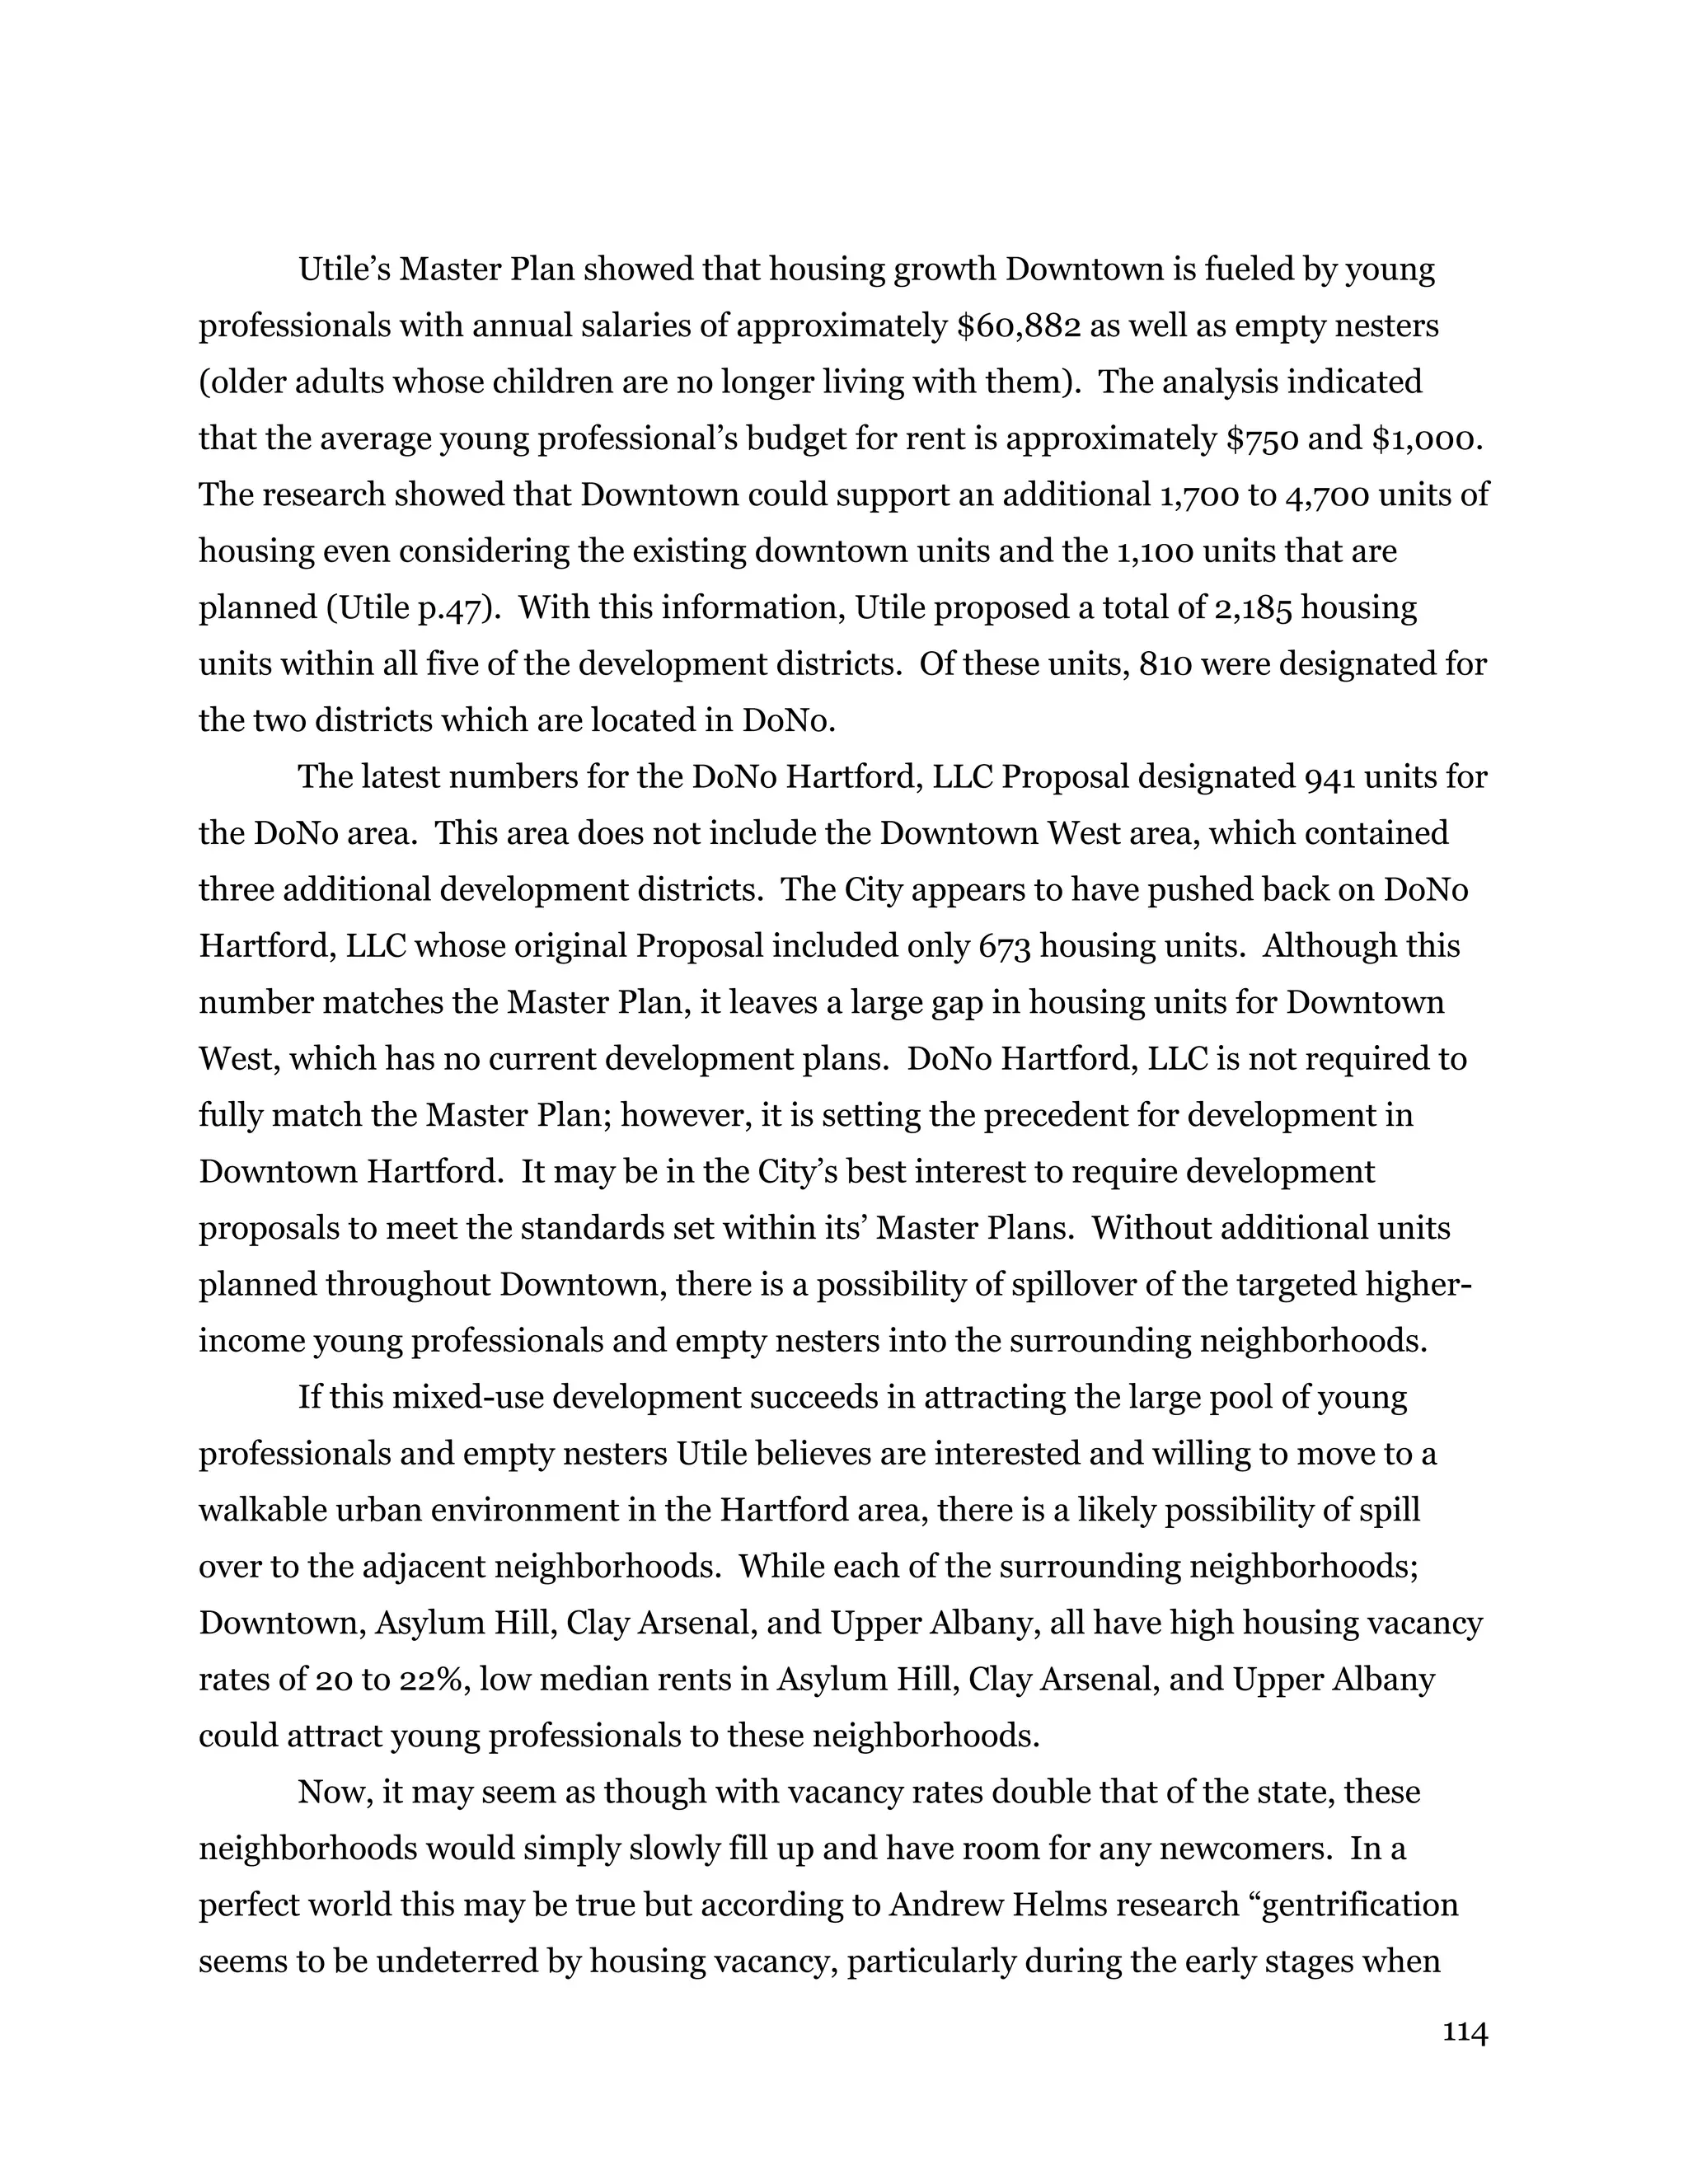
Figure 27 DoNo Hartford LLC's concept site design of the DoNo redevelopment. Source: DoNo Hartford LLC p. 22).
Below is the Statement of Interest from DoNo Hartford LLC that was submitted
to the City in August 2014.
[DoNo Hartford LLC] proposes to deliver a wide range of services in the creation
of a dynamic, mixed‐use neighborhood, including planning and design,
construction management, financing strategies, commercial and residential
leasing, and property management. The net result will create a neighborhood that
will not only become an entertainment destination for hundreds of thousands of
visitors annually, with a professional baseball team as its focal point, but will also
link the North End of Hartford and Downtown within an environment that
includes public space, apartments, offices, retail, restaurants, a grocery store, and
a variety of potential destinations that will define itself as a holistic urban core
that provides its residents with a real opportunity to live, work and play. This
neighborhood, known as Downtown North, or DoNo, will energize an area that is
presently dormant, and create a major new assembly venue for the region.
(DoNo Hartford LLC, 2014, p. 6)
B
D-1
A
G-2
F
B
D-1
E
D-2
C
G-1](https://image.slidesharecdn.com/928d85f8-e886-4de1-82d7-630b9f3923e8-160106213833/75/DoNo-Master-s-Project-FINAL-DRAFT-84-2048.jpg)


![115
renovators purchase and renovate abandoned buildings that are usually deteriorated but
still structurally sound” (Helms, 2003, p. 485). Helms has several other findings that
indicate the neighborhoods to the northwest and west of DoNo have the possibility of
gentrifying:
By and large, the results confirm intuitive expectations and support anecdotal
accounts about the determinants of renovation, particularly as it occurs in the
context of gentrification. Older, low-density houses in older, moderate-density
neighborhoods are most likely to be renovated. Accessibility to the [Central
Business District] CBD matters: improvement is more likely in areas that are
close to downtown and well-served by mass transit. Housing vacancy does not
deter renovation, but nearby public housing projects do. Neighborhood
amenities, including city parks and bodies of water (Lake Michigan in this case),
encourage renovation activity (Helms, 496).
Clay Arsenal, Upper Albany, and Asylum Hill are all located adjacent to a
maximum of two miles from the CBD (Downtown), are older, moderate-density
neighborhoods, and have a fair amount of parks. The DoNo redevelopment may also
connect these neighborhoods to Riverside Park and the Connecticut River. These
neighborhoods already contain the large Keney Park and Golf Course, Bellevue Square
Park, Brackett Park & Parker Community Center, Heartbeat Park, Sigourney Square
Park, and are close to Bushnell Park in Downtown.
Hartford’s public transportation is also increasing. There is an existing bus
system connecting the surrounding neighborhood to Downtown, as well as a free “dash
shuttle” circulating Downtown. The Amtrak train has recently been upgraded to “high-
speed” connecting north and south, making it easier to get to cities such as New Haven
and New York City. Hartford also has several large entertainment venues, and will have
the new minor league baseball stadium in DoNo in Spring 2016.
According to the Metro Hartford Progress Points report developed by the
Hartford Foundation for Public Giving, 82% of the 121,000 jobs in Hartford are filled by
commuters from the surrounding region. The population of Hartford reportedly
doubles during the daytime due to the influx of commuters. These statistics were
collected from the U.S. Census Bureau, 2011. Many of these jobs are located in
Downtown Hartford, especially those within the insurance and finance industries.
Based on this information, coupled with the National trend of people moving back into](https://image.slidesharecdn.com/928d85f8-e886-4de1-82d7-630b9f3923e8-160106213833/75/DoNo-Master-s-Project-FINAL-DRAFT-115-2048.jpg)
![118
Recommendations
Essential to this project is the question “what is ‘Planning’?” The basis of this
Master’s Project is to analyze the potential impacts of a critical piece of planning, a
master plan. According to the American Planning Association, Planning works to
improve the present and future community.
[Planning] is a dynamic profession that works to improve the welfare of people
and their communities by creating more convenient, equitable, healthful,
efficient, and attractive places for present and future generations…Good planning
helps create communities that offer better choices for where and how people live.
Planning helps communities to envision their future. It helps them find the right
balance of new development and essential services, environmental protection,
and innovative change (www.planning.org).
I began this project in the Spring of 2014 prior to the completion of the DoNo
Master Plan or any proposals being submitted to the City for development. I had hope
and excitement that this area was ripe for redevelopment. To my pleasant surprise, a
major redevelopment of DoNo has unfolded right in front of me. While I am excited for
the prospect of revitalization in and around DoNo, as a Planner, I seek to work to the
benefit of the entire community.
Throughout my research of housing, gentrification, redevelopment, several case
studies, and the details of this project, I have developed several recommendations for
the City of Hartford to plan for all the current residents. DoNo’s location as the
connecting piece between the contrasting Downtown and North End neighborhoods of
Clay Arsenal, Upper Albany, and Asylum Hill makes its’ redevelopment sensitive and
political. The needs of the City and its economic development must be balanced with
the needs of the existing underserved community.
Affordable Housing
Hartford should require that 20% of the housing units constructed in DoNo are
affordable with affordability restrictions of 80 or 99 years. DoNo Hartford LLC has
stated that with the exception of the funding for the baseball stadium, the mixed use
development was originally intended to be funded entirely by private financing. This](https://image.slidesharecdn.com/928d85f8-e886-4de1-82d7-630b9f3923e8-160106213833/75/DoNo-Master-s-Project-FINAL-DRAFT-118-2048.jpg)
![119
appears to be DoNo Hartford LLC’s reason for not originally including affordable
housing.
According to an article written by Kenneth Gosselin in the Hartford Courant on
February 20, 2015, after they are seeking a $20 million subsidy from the Capital
Region Development Authority (CRDA). “[The] city council pushed to have some
rentals set aside for low and moderate income households. Those apartments carry
lower rents. Centerplan and its partner, Leyland Alliance of New York, had intended
not to seek public subsidies. However, including ‘affordable’ housing would create a
gap between the cost to develop and the revenue that would be generated” (Gosselin,
2015).
Additionally, the City should make a concerted effort to map the location of all types
of affordable housing: Section 8 Housing Choice Voucher, Section 8 project-based
housing, LIHTC developments, and public housing, that are located in the
Downtown and surrounding neighborhoods. This information will arm the City with
the knowledge of what units may be most susceptible to conversion to market-rate
housing. The City could then work to enforce longer affordability restrictions at
these locations. The City could provide resources to properties in need of
maintenance or to the most vulnerable properties in terms of conversion and
displacement.
Mixed-Income
The DoNo redevelopment may be seen as something for middle and higher income
residents with DoNo Hartford LLC stating that wealthier young professionals will be
targeted and catered to at the start of this redevelopment. However, there are many
efforts to make the development beneficial for the Hartford residents, especially in
the surrounding neighborhoods.
The need for a grocery store is high in these neighborhoods that have been classified
as food deserts. The City should ensure that this grocery store is in the price range of
those residents who need it now. Additionally, the grocery store is located in the
south-central portion of DoNo and closer to Downtown than the underserved
neighborhoods to the north and northwest. It would be more beneficial to the](https://image.slidesharecdn.com/928d85f8-e886-4de1-82d7-630b9f3923e8-160106213833/75/DoNo-Master-s-Project-FINAL-DRAFT-119-2048.jpg)
![122
References
Cohen, Jeffrey, “Anger After King’s Death Left Lasting Mark on Hartford’s North
End” (April 6, 2008). Hartford Courant,
http://www.hartfordinfo.org/issues/documents/history/htfd_courant_040608.
asp.
Tateosian, Nicole, "Hartford, Connecticut: Discrimination, Segregation, and
Urban Riots" (1998). Hartford Studies Collection: Papers by Students and
Faculty. Paper 24.
Dale, Ann and Lenore L. Newman. 2009. "Sustainable development for some:
green urban development and affordability." Local Environment 14, no. 7: 669-
681.
Basolo, V. (1999). The impacts of intercity competition and intergovernmental
factors on local affordable housing expenditures. Housing Policy Debate, 10(3),
659-688.
DeFilippis, J. and E. Wyly, Running to Stand Still: Through the Looking Glass
With
Federally Subsidized Housing in New York City. Urban Affairs Review, 2006. 43:
p.777-816.
Deng, L. (2005). The cost-effectiveness of the low-income housing tax credit
relative to vouchers: Evidence from six metropolitan areas. Housing Policy
Debate, 16(3-4), 469-511.
Deng, L. (2005). The cost-effectiveness of the low-income housing tax credit
relative to vouchers: Evidence from six metropolitan areas. Housing Policy
Debate, 16(3-4), 469-511.
Goetz, E. G. (2002). Forced relocation vs. voluntary mobility: The effects of
dispersal programs on households. Housing Studies, 17(1), 107-123.
Halasz, J.R. (2011). Fair and affordable? Racial and ethnic segregation and
inequality in New York City rental housing. Housing Policy Debate, 21(2), 267-
293.
Housing and Urban Development, 2015,
http://portal.hud.gov/hudportal/HUD?src=/program_offices/public_indian_ho
using/programs/ph/cn. FHUB site
Landis, J. D., & McClure, K. (2010). Rethinking federal housing policy. Journal of
the American planning Association, 76(3), 319-348.
McClure, K., (2008). Deconcentrating Poverty with Housing Programs. Journal
of the American Planning Association. 74(1): p. 90-99.
Melendez, E., & Schwartz, A. (2008). After year 15: Challenges to the
preservation of housing financed with Low-Income Housing Tax Credits.
[Article]. Housing Policy Debate, 19(2), 261-294.
Mhatre, P. C., & Van Zandt, S. (2009). Growing Pains: Perpetuating Inequality
through the production of low-income housing in the Dallas/Fort Worth
metroplex. Urban Geography, 30(5), 490-513.](https://image.slidesharecdn.com/928d85f8-e886-4de1-82d7-630b9f3923e8-160106213833/75/DoNo-Master-s-Project-FINAL-DRAFT-122-2048.jpg)
![123
Orfield, M. (2005). Racial integration and community revitalization: Applying the
fair housing act to the low income housing tax credit. [Review]. Vanderbilt Law
Review, 58(6), 1747-+.
Pritchett, W. E. (2008). Which Urban Crisis? Regionalism, Race, and Urban
Policy, 1960-1974. Journal of Urban History, 34(2), 266-286.
Tiebout, C. M. (1956). A pure theory of local expenditures. The Journal of
Political Economy, 64(5), 416.
von Hoffman, A. (2005). The End of the Dream: The Political Struggle of
America’s Public Housers. Journal of Planning History, 4(3), 222.
Woods, L. L. (2012). The Federal Home Loan Bank Board, Redlining, and the
National Proliferation of Racial Lending Discrimination, 1921-1950. [Article].
Journal of Urban History, 38(6), 1036-1059. doi: 10.1177/0096144211435126
Davidson, Justin. 2014. "Is Gentrification All Bad?" New York 47, no. 3: 36-75.
Davidson, Mark and Lees, Loretta. 2005. "New-build 'gentrification' and
London's riverside renaissance." Environment & Planning A, 37: no. 7: 1165-
1190.
Davis, Tomeka and Oakley, Deirdre. 2013. "Linking Charter School Emergence to
Urban Revitalization and Gentrification: a Socio-Spatial Analysis of Three Cities."
Journal of Urban Affairs 35, no. 1: 81-102.
Eckerd, Adam. 2011. "Cleaning Up Without Clearing Out? A Spatial Assessment
of Environmental Gentrification." Urban Affairs Review, no. 47: 31-59.
Essoka, Jonathan D. 2010. "The Gentrifying Effects of Brownfields
Redevelopment." Western Journal of Black Studies 34, no. 3: 299-315.
Freeman, Lance. 2006. There Goes the 'Hood: Views of Gentrification from the
Ground Up. Philadelphia, Temple University Press.
Glanville, Justin 2013. “Taking the Sting Out of Gentrification,” American
Planning Association, April 2013: 12-15.
Hartford Foundation for Public Giving. 2014. “Metro Hartford Progress Points.”
Helms, Andrew. 2000; revised 2003. “Understanding gentrification; an empirical
analysis of the determinants of urban housing renovation,” Journal of Urban
Economics, no. 54: 474-498.
Johnson, Jennifer S. 2008. “Affordable Housing in New Urbanist Communities:
A Survey of Developers.” Housing Policy Debate Volume 19 Issue 4: 583-613.
Lees, Loretta. 2008. "Gentrification and Social Mixing: Towards an Inclusive
Urban Renaissance?" Urban Studies 45, no. 12: 2449-2470.
Lees, Loretta, Tom Slater, and Elvin Wyly. 2008. Gentrification. New York:
Routledge/Taylor and Francis Group.
Mathema, Silva. 2013. “Gentrification: An Updated Literature Review.” Poverty
& Race Research Action Council: 1-8.
Orfield, Myron. 2005. "Racial Integration and Community Revitalization:
Applying the Fair Housing Act to the Low Income Housing Tax Credit."
Vanderbilt Law Review 58, no. 6: 1747-1804.
Pearsall, Hamil. 2013. "Superfund Me: A Study of Resistance to Gentrification in
New York City." Urban Studies 50, no. 11: 2293-2310.](https://image.slidesharecdn.com/928d85f8-e886-4de1-82d7-630b9f3923e8-160106213833/75/DoNo-Master-s-Project-FINAL-DRAFT-123-2048.jpg)