
Recommended
Recommended
More Related Content
What's hot
What's hot (10)
Similar to Happy Employees Don't Always Equal Satisfied Customers
Similar to Happy Employees Don't Always Equal Satisfied Customers (20)
Recently uploaded
Recently uploaded (20)
Happy Employees Don't Always Equal Satisfied Customers
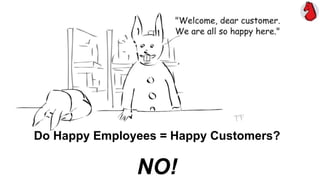
- 1. Do Happy Employees = Happy Customers? NO!
- 2. In short: The relationship between employee and consumer satisfaction for large American companies is close to zero, contrary to what most people believe. There are three industry sectors that seem to be exceptions. There are also some individual companies with surprising results 12 March 2018 http://customerstrategy.net/ Note: This presentation is designed to accompany the blog post about the research at http://customerstrategy.net/employee-customer-satisfaction-2/
- 3. Conventional wisdom 12 March 2018 http://customerstrategy.net/
- 4. Existing research • Most articles only cover single companies • The message tends to be something like “Google employees and customers are both highly satisfied, therefore one drives the other for all companies” • James A Harrington showed employee satisfaction was not a major factor in customer satisfaction in an article in the American Quality Digest covering 100 companies in the media industry • A Northwestern University study found a weak relationship between the two for 100 companies in the media industry Article references are in our blog post12 March 2018 http://customerstrategy.net/
- 5. WYSIATI • Nobel-winner Daniel Kahneman talks about ‘What You See Is All There Is’. He says our brains are lazy and want to jump to any available immediate conclusion without much thought Intuition Limited data (for example, only employee and customer satisfaction) Conclusion based on the assumption that the limited data is all that matters • If we had to brainstorm a list of things that drive customer satisfaction, employee satisfaction would be on the list, but nowhere near the top for most companies 12 March 2018 http://customerstrategy.net/
- 6. Solution: match these two 12 March 2018 http://customerstrategy.net/
- 7. Glassdoor overall ratings by employees explain 4.4% of ACSI customer satisfaction 12 March 2018 http://customerstrategy.net/ R² = 0.0438 2 2.5 3 3.5 4 4.5 5 50 55 60 65 70 75 80 85 90 Glassdoorrating ACSI score ACSI vs. Glassdoor for 345 businesses
- 8. Glassdoor explains 9.6% of ACSI in high-touch 12 March 2018 http://customerstrategy.net/ R² = 0.0963 2 2.5 3 3.5 4 4.5 60 65 70 75 80 85 90 Glassdoorrating ACSI score ACSI vs. Glassdoor for 125 higher-touch businesses
- 9. Glassdoor explains 5.1% of ACSI in low-touch 12 March 2018 http://customerstrategy.net/ R² = 0.0514 2 2.5 3 3.5 4 4.5 5 50 55 60 65 70 75 80 85 90 Glassdoorrating ACSI score ACSI vs. Glassdoor for 220 lower-touch businesses
- 10. Sectors with more human touch have higher numbers 12 March 2018 http://customerstrategy.net/ An R-squared number of 0.313 means the Glassdoor variations explain 31% of the ACSI variations, for example Sector R2 Count Touch Retail Trade 0.324 68 High Transportation 0.313 12 High Accommodation & Food Services 0.196 39 High Manufacturing/Durable Goods 0.130 42 Low Telecommunications & Information 0.126 42 Low Energy Utilities 0.027 29 Low E-Business 0.004 22 Low Finance & Insurance 0.002 49 Low Manufacturing/Nondurable Goods 0.004 26 Low E-Commerce 0.013 16 Low
- 11. Not surprising • This is a study of large companies. In many cases, no employees of a company have any interaction whatsoever with customers. Products or services are provided by resellers or franchisees. Support may be outsourced • There are companies such as Amazon (High ACSI, average Glassdoor) where it is rare to interact with a human 12 March 2018 http://customerstrategy.net/
- 12. 12 March 2018 http://customerstrategy.net/
- 13. The ‘love-hate matrix’ (examples) 12 March 2018 http://customerstrategy.net/ American Customer Satisfaction Index Glassdoorrating 9050 2.5 4.5 3.5 70 Customers Employees
- 14. Top 10% for both employees and customers Used Toyota Glassdoor number Lexus12 March 2018 http://customerstrategy.net/ * Companies on the same list last year
- 15. Bottom 10% for both employees and customers Only one Glassdoor number available for the three Frontier businesses and and for the two Windstream businesses12 March 2018 http://customerstrategy.net/ * Companies on the same list last year
- 16. Counter-intuitive: top 10% for customers, bottom 10% for employees 12 March 2018 http://customerstrategy.net/ * Companies on the same list last year
- 17. Counter-intuitive: bottom 10% for customers, top 10% for employees Only one Glassdoor number available for both Spectrum businesses12 March 2018 http://customerstrategy.net/ * Companies on the same list last year
- 18. Conclusion • This is the best study possible with public data • Employee satisfaction is quite different from employee engagement. People can be happy with their pay, free food in the cafeteria, child care and their short commute to work. None of these do anything for customers • There is no standard metric for employee engagement, and no public data, so I believe looking at satisfaction is the best we can do • Feel free to disagree on our blog or by contacting me 12 March 2018 http://customerstrategy.net/
- 19. Notes • Download the Excel file from the customerstrategy.net resources page to examine detail and do your own analysis • All ACSI data is for all of 2017. Most Glassdoor ratings are from November 2017, with about 15 from March 2018 • Disagreement and debate welcome. Add comments to blog post at http://customerstrategy.net/customer-employee-satisfaction • Contact: Maurice FitzGerald mfg@customerstrategy.net 12 March 2018 http://customerstrategy.net/
- 20. 12 March 2018 http://customerstrategy.net/
- 21. Thank you 12 March 2018 http://customerstrategy.net/ Please read our blog at http://customerstrategy.net/blog/ and sign up for our newsletter at http://customerstrategy.net/newsletter/
Editor's Notes
- Drawing by Peter FitzGerald. See more of his business humor in his book “So Happy Here” available from Amazon stores worldwide.