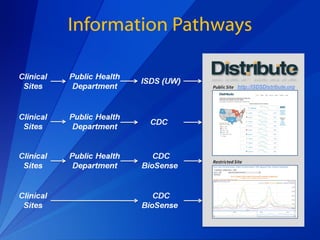
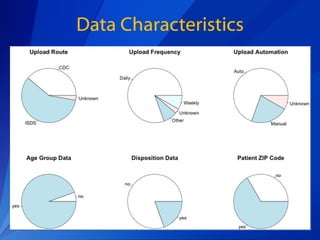
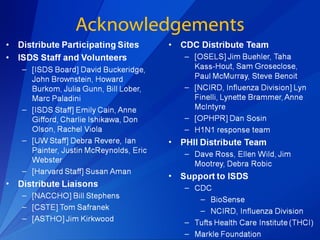
A Brief History
Building Distribute
Current State
Information Pathways
Data Characteristics
Acknowledgements

Editor's Notes

  • #3 Hockey stick
  • #5 Cross-tabulated by a limited number of variables Age group, 1st 3 digits of zip code, date of ED visit Temperature and disposition (hospital admission) where possible (proxy measures of illness severity) Draws on state/local familiarity with: Local language/lingo and health care services Calibration of ILI syndromic criteria to optimize alignment of observed trends with other local influenza markers
  • #6 The figure represents 36 health departments currently sending data to Distribute. Based on these comparisons of 12-month baseline (pre-H1N1) ED visits at these health departments and data from the 2007 American Hospital Association (AHA) survey, which provides data on total ED visits for all hospitals by state, county, or city, we estimate that EDs represented in Distribute account for >35% of all ED visits for the 10 HHS regions in the United States , ranging from ~70% for Region 2 to <10% for Region 9. This value is expressed as a ratio rather than as a percentage since time periods represented by numerator (Distribute data) and denominator (AHA survey data for all sites except for OK city where we estimated number of visits per month based on the metadata on the Distribute website) differ.