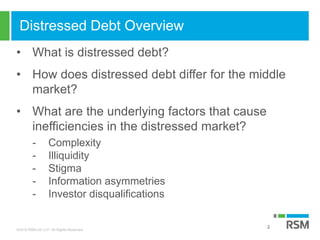
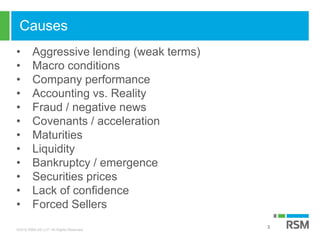
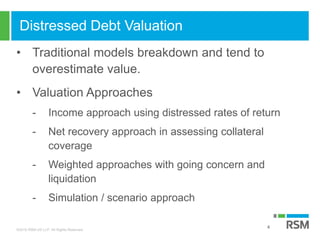
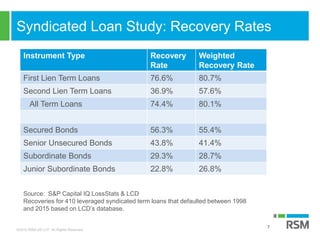
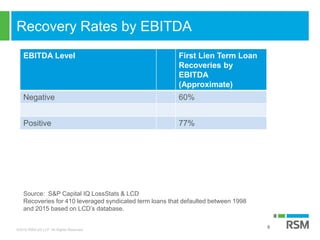
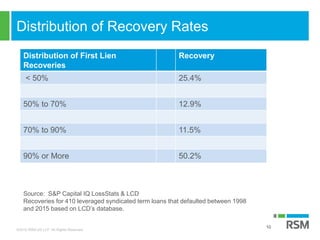
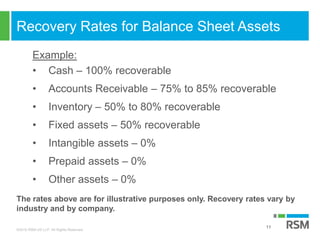
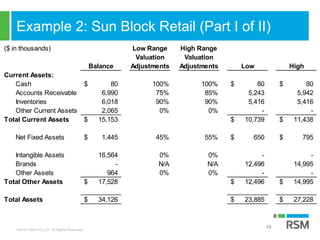
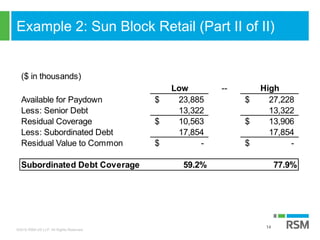
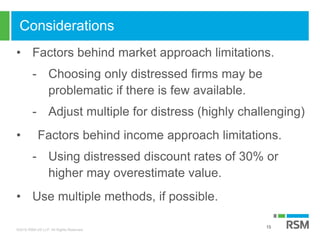
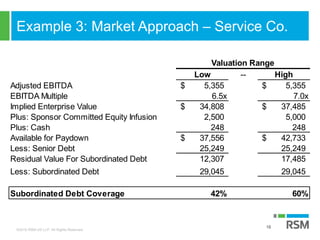
©2016 RSM US LLP. All Rights Reserved.©2016 RSM US LLP. All Rights Reserved.
VALUATION METHODOLOGIES OF
VARIOUS DEBT PRODUCTS
Melissa Brady, CFA
Phone: 212-372-1296
Email: Melissa.Brady@RSMUS.com
Website: www.RSMUS.com
September 26, 2016
©2016 RSM US LLP. All Rights Reserved.
Distressed Debt Overview
• What is distressed debt?
• How does distressed debt differ for the middle
market?
• What are the underlying factors that cause
inefficiencies in the distressed market?
- Complexity
- Illiquidity
- Stigma
- Information asymmetries
- Investor disqualifications
2
©2016 RSM US LLP. All Rights Reserved.
Causes
• Aggressive lending (weak terms)
• Macro conditions
• Company performance
• Accounting vs. Reality
• Fraud / negative news
• Covenants / acceleration
• Maturities
• Liquidity
• Bankruptcy / emergence
• Securities prices
• Lack of confidence
• Forced Sellers
3
©2016 RSM US LLP. All Rights Reserved.
Distressed Debt Valuation
• Traditional models breakdown and tend to
overestimate value.
• Valuation Approaches
- Income approach using distressed rates of return
- Net recovery approach in assessing collateral
coverage
- Weighted approaches with going concern and
liquidation
- Simulation / scenario approach
4
©2016 RSM US LLP. All Rights Reserved.
Recovery Rates
5
• Academic papers
• Studies
• CEPRES Data – Private Debt & Mezzanine
Market Report
• S&P Global Market Intelligence & LSTA
• Moody’s Annual Default & Recovery Studies
• Other
©2016 RSM US LLP. All Rights Reserved.
Academic Study: Recovery By Instrument
6
Instrument Type # of Obs. Mean Recovery
Rate
Revolvers 254 82.45%
Term Loans 209 70.49%
Senior Secured Bonds 218 58.90%
Senior Unsecured Bonds 483 52.69%
Senior Subordinate Bonds 148 28.79%
Subordinate Bonds 120 25.79%
Junior Bonds 17 18.36%
Source: Debt Structure, Market Value of Firm, and Recovery Rate by Min Qi and
Xinlei Zhao. Office of the Comptroller of the Currency. Economics Working Paper
2011-2, October 2011. Sample is from Moody’s Ultimate Recovery Rate Database.
©2016 RSM US LLP. All Rights Reserved.
Syndicated Loan Study: Recovery Rates
7
Instrument Type Recovery
Rate
Weighted
Recovery Rate
First Lien Term Loans 76.6% 80.7%
Second Lien Term Loans 36.9% 57.6%
All Term Loans 74.4% 80.1%
Secured Bonds 56.3% 55.4%
Senior Unsecured Bonds 43.8% 41.4%
Subordinate Bonds 29.3% 28.7%
Junior Subordinate Bonds 22.8% 26.8%
Source: S&P Capital IQ LossStats & LCD
Recoveries for 410 leveraged syndicated term loans that defaulted between 1998
and 2015 based on LCD’s database.
©2016 RSM US LLP. All Rights Reserved.
Recovery Rates by EBITDA
8
EBITDA Level First Lien Term Loan
Recoveries by
EBITDA
(Approximate)
Negative 60%
Positive 77%
Source: S&P Capital IQ LossStats & LCD
Recoveries for 410 leveraged syndicated term loans that defaulted between 1998
and 2015 based on LCD’s database.
©2016 RSM US LLP. All Rights Reserved.
Recovery Rates by Industry
9
Industry Recovery
Printing & Publishing 64.8%
Telecom 68.1%
Gaming & Hotel 68.2%
Chemicals 68.8%
Healthcare 69.9%
Utilities 72.9%
Computers and Electronics 73.8%
Automotive 85.8%
Entertainment & Leisure 89.2%
Radio 91.0%
Source: S&P Capital IQ LossStats & LCD
Recoveries for 410 leveraged syndicated term loans that defaulted between 1998
and 2015 based on LCD’s database.
©2016 RSM US LLP. All Rights Reserved.
Distribution of Recovery Rates
10
Distribution of First Lien
Recoveries
Recovery
< 50% 25.4%
50% to 70% 12.9%
70% to 90% 11.5%
90% or More 50.2%
Source: S&P Capital IQ LossStats & LCD
Recoveries for 410 leveraged syndicated term loans that defaulted between 1998
and 2015 based on LCD’s database.
©2016 RSM US LLP. All Rights Reserved.
Recovery Rates for Balance Sheet Assets
11
Example:
• Cash – 100% recoverable
• Accounts Receivable – 75% to 85% recoverable
• Inventory – 50% to 80% recoverable
• Fixed assets – 50% recoverable
• Intangible assets – 0%
• Prepaid assets – 0%
• Other assets – 0%
The rates above are for illustrative purposes only. Recovery rates vary by
industry and by company.
©2016 RSM US LLP. All Rights Reserved.
Example 1 – Plant Nursery Business
12
Balance Low High Low High
Current Assets:
Cash & Cash Equivalents 3,040$ 0% 0% -$ -$
Accounts Receivable 2,973 70% 80% 2,081 2,378
Prepaids 5,225 0% 0% - -
Inventory 250,257 15% 25% 37,539 62,564
Other Current Assets - 0% 0% - -
Total Current Assets 261,495$ 39,620$ 64,943$
Net Fixed Assets 18,368 40% 60% 7,347 11,021
Intangible Assets 12,667 0% 0% - -
Total Other Assets 12,667$ -$ -$
Total Assets Supporting Debt 292,530$ 46,967$ 75,963$
Less: Revolver 31,035 31,035 31,035
Collateral Supporting First Lien 261,495 15,932 44,928
First Lien Term Loan A 75,000$ 75,000$ 75,000$
First Lien Coverage 21.2% 59.9%
©2016 RSM US LLP. All Rights Reserved.
Example 2: Sun Block Retail (Part I of II)
13
($ in thousands) Low Range High Range
Valuation Valuation
Balance Adjustments Adjustments Low High
Current Assets:
Cash 80$ 100% 100% 80$ 80$
Accounts Receivable 6,990 75% 85% 5,243 5,942
Inventories 6,018 90% 90% 5,416 5,416
Other Current Assets 2,065 0% 0% - -
Total Current Assets 15,153$ 10,739$ 11,438$
Net Fixed Assets 1,445$ 45% 55% 650$ 795$
Intangible Assets 16,564 0% 0% - -
Brands - N/A N/A 12,496 14,995
Other Assets 964 0% 0% - -
Total Other Assets 17,528$ 12,496$ 14,995$
Total Assets 34,126$ 23,885$ 27,228$
©2016 RSM US LLP. All Rights Reserved.
Example 2: Sun Block Retail (Part II of II)
14
($ in thousands)
Low -- High
Available for Paydown 23,885$ 27,228$
Less: Senior Debt 13,322 13,322
Residual Coverage 10,563$ 13,906$
Less: Subordinated Debt 17,854 17,854
Residual Value to Common -$ -$
Subordinated Debt Coverage 59.2% 77.9%
©2016 RSM US LLP. All Rights Reserved.
Considerations
• Factors behind market approach limitations.
- Choosing only distressed firms may be
problematic if there is few available.
- Adjust multiple for distress (highly challenging)
• Factors behind income approach limitations.
- Using distressed discount rates of 30% or
higher may overestimate value.
• Use multiple methods, if possible.
15
©2016 RSM US LLP. All Rights Reserved.
Example 3: Market Approach – Service Co.
16
Low -- High
Adjusted EBITDA 5,355$ 5,355$
EBITDA Multiple 6.5x 7.0x
Implied Enterprise Value 34,808$ 37,485$
Plus: Sponsor Committed Equity Infusion 2,500 5,000
Plus: Cash 248 248
Available for Paydown 37,556$ 42,733$
Less: Senior Debt 25,249 25,249
Residual Value For Subordinated Debt 12,307 17,485
Less: Subordinated Debt 29,045 29,045
Subordinated Debt Coverage 42% 60%
Valuation Range
©2016 RSM US LLP. All Rights Reserved.
Example 3: Income Approach – Service Co.
17
Sensitivity Analysis - Implied Price of Debt Based on Following Concluded Yields
27.00% 28.00% 29.00% 30.00% 31.00% 32.00% 33.00%
71.3% 69.6% 67.9% 66.3% 64.7% 63.2% 61.7%
Concluded Price of Debt (% of Par) 63.2% -- 69.6%
©2016 RSM US LLP. All Rights Reserved.©2016 RSM US LLP. All Rights Reserved.
©2016 RSM US LLP. All Rights Reserved.
This document contains general information, may be based on authorities that are subject to change, and is not a substitute for professional
advice or services. This document does not constitute audit, tax, consulting, business, financial, investment, legal or other professional
advice, and you should consult a qualified professional advisor before taking any action based on the information herein. RSM US LLP, its
affiliates and related entities are not responsible for any loss resulting from or relating to reliance on this document by any person. Internal
Revenue Service rules require us to inform you that this communication may be deemed a solicitation to provide tax services. This
communication is being sent to individuals who have subscribed to receive it or who we believe would have an interest in the topics
discussed.
RSM US LLP is a limited liability partnership and the U.S. member firm of RSM International, a global network of independent audit, tax and
consulting firms. The member firms of RSM International collaborate to provide services to global clients, but are separate and distinct legal
entities that cannot obligate each other. Each member firm is responsible only for its own acts and omissions, and not those of any other
party. Visit rsmus.com/aboutus for more information regarding RSM US LLP and RSM International.
RSM® and the RSM logo are registered trademarks of RSM International Association. The power of being understood® is a registered
trademark of RSM US LLP.
© 2016 RSM US LLP. All Rights Reserved.
RSM US LLP
1185 Avenue of the Americas
New York, New York 10036
+1 212 372 1000
www.rsmus.com

Distressed Debt Slides_Melissa Brady

  • 1.
    ©2016 RSM USLLP. All Rights Reserved.©2016 RSM US LLP. All Rights Reserved.
  • 2.
    ©2016 RSM USLLP. All Rights Reserved.©2016 RSM US LLP. All Rights Reserved. VALUATION METHODOLOGIES OF VARIOUS DEBT PRODUCTS Melissa Brady, CFA Phone: 212-372-1296 Email: Melissa.Brady@RSMUS.com Website: www.RSMUS.com September 26, 2016
  • 3.
    ©2016 RSM USLLP. All Rights Reserved. Distressed Debt Overview • What is distressed debt? • How does distressed debt differ for the middle market? • What are the underlying factors that cause inefficiencies in the distressed market? - Complexity - Illiquidity - Stigma - Information asymmetries - Investor disqualifications 2
  • 4.
    ©2016 RSM USLLP. All Rights Reserved. Causes • Aggressive lending (weak terms) • Macro conditions • Company performance • Accounting vs. Reality • Fraud / negative news • Covenants / acceleration • Maturities • Liquidity • Bankruptcy / emergence • Securities prices • Lack of confidence • Forced Sellers 3
  • 5.
    ©2016 RSM USLLP. All Rights Reserved. Distressed Debt Valuation • Traditional models breakdown and tend to overestimate value. • Valuation Approaches - Income approach using distressed rates of return - Net recovery approach in assessing collateral coverage - Weighted approaches with going concern and liquidation - Simulation / scenario approach 4
  • 6.
    ©2016 RSM USLLP. All Rights Reserved. Recovery Rates 5 • Academic papers • Studies • CEPRES Data – Private Debt & Mezzanine Market Report • S&P Global Market Intelligence & LSTA • Moody’s Annual Default & Recovery Studies • Other
  • 7.
    ©2016 RSM USLLP. All Rights Reserved. Academic Study: Recovery By Instrument 6 Instrument Type # of Obs. Mean Recovery Rate Revolvers 254 82.45% Term Loans 209 70.49% Senior Secured Bonds 218 58.90% Senior Unsecured Bonds 483 52.69% Senior Subordinate Bonds 148 28.79% Subordinate Bonds 120 25.79% Junior Bonds 17 18.36% Source: Debt Structure, Market Value of Firm, and Recovery Rate by Min Qi and Xinlei Zhao. Office of the Comptroller of the Currency. Economics Working Paper 2011-2, October 2011. Sample is from Moody’s Ultimate Recovery Rate Database.
  • 8.
    ©2016 RSM USLLP. All Rights Reserved. Syndicated Loan Study: Recovery Rates 7 Instrument Type Recovery Rate Weighted Recovery Rate First Lien Term Loans 76.6% 80.7% Second Lien Term Loans 36.9% 57.6% All Term Loans 74.4% 80.1% Secured Bonds 56.3% 55.4% Senior Unsecured Bonds 43.8% 41.4% Subordinate Bonds 29.3% 28.7% Junior Subordinate Bonds 22.8% 26.8% Source: S&P Capital IQ LossStats & LCD Recoveries for 410 leveraged syndicated term loans that defaulted between 1998 and 2015 based on LCD’s database.
  • 9.
    ©2016 RSM USLLP. All Rights Reserved. Recovery Rates by EBITDA 8 EBITDA Level First Lien Term Loan Recoveries by EBITDA (Approximate) Negative 60% Positive 77% Source: S&P Capital IQ LossStats & LCD Recoveries for 410 leveraged syndicated term loans that defaulted between 1998 and 2015 based on LCD’s database.
  • 10.
    ©2016 RSM USLLP. All Rights Reserved. Recovery Rates by Industry 9 Industry Recovery Printing & Publishing 64.8% Telecom 68.1% Gaming & Hotel 68.2% Chemicals 68.8% Healthcare 69.9% Utilities 72.9% Computers and Electronics 73.8% Automotive 85.8% Entertainment & Leisure 89.2% Radio 91.0% Source: S&P Capital IQ LossStats & LCD Recoveries for 410 leveraged syndicated term loans that defaulted between 1998 and 2015 based on LCD’s database.
  • 11.
    ©2016 RSM USLLP. All Rights Reserved. Distribution of Recovery Rates 10 Distribution of First Lien Recoveries Recovery < 50% 25.4% 50% to 70% 12.9% 70% to 90% 11.5% 90% or More 50.2% Source: S&P Capital IQ LossStats & LCD Recoveries for 410 leveraged syndicated term loans that defaulted between 1998 and 2015 based on LCD’s database.
  • 12.
    ©2016 RSM USLLP. All Rights Reserved. Recovery Rates for Balance Sheet Assets 11 Example: • Cash – 100% recoverable • Accounts Receivable – 75% to 85% recoverable • Inventory – 50% to 80% recoverable • Fixed assets – 50% recoverable • Intangible assets – 0% • Prepaid assets – 0% • Other assets – 0% The rates above are for illustrative purposes only. Recovery rates vary by industry and by company.
  • 13.
    ©2016 RSM USLLP. All Rights Reserved. Example 1 – Plant Nursery Business 12 Balance Low High Low High Current Assets: Cash & Cash Equivalents 3,040$ 0% 0% -$ -$ Accounts Receivable 2,973 70% 80% 2,081 2,378 Prepaids 5,225 0% 0% - - Inventory 250,257 15% 25% 37,539 62,564 Other Current Assets - 0% 0% - - Total Current Assets 261,495$ 39,620$ 64,943$ Net Fixed Assets 18,368 40% 60% 7,347 11,021 Intangible Assets 12,667 0% 0% - - Total Other Assets 12,667$ -$ -$ Total Assets Supporting Debt 292,530$ 46,967$ 75,963$ Less: Revolver 31,035 31,035 31,035 Collateral Supporting First Lien 261,495 15,932 44,928 First Lien Term Loan A 75,000$ 75,000$ 75,000$ First Lien Coverage 21.2% 59.9%
  • 14.
    ©2016 RSM USLLP. All Rights Reserved. Example 2: Sun Block Retail (Part I of II) 13 ($ in thousands) Low Range High Range Valuation Valuation Balance Adjustments Adjustments Low High Current Assets: Cash 80$ 100% 100% 80$ 80$ Accounts Receivable 6,990 75% 85% 5,243 5,942 Inventories 6,018 90% 90% 5,416 5,416 Other Current Assets 2,065 0% 0% - - Total Current Assets 15,153$ 10,739$ 11,438$ Net Fixed Assets 1,445$ 45% 55% 650$ 795$ Intangible Assets 16,564 0% 0% - - Brands - N/A N/A 12,496 14,995 Other Assets 964 0% 0% - - Total Other Assets 17,528$ 12,496$ 14,995$ Total Assets 34,126$ 23,885$ 27,228$
  • 15.
    ©2016 RSM USLLP. All Rights Reserved. Example 2: Sun Block Retail (Part II of II) 14 ($ in thousands) Low -- High Available for Paydown 23,885$ 27,228$ Less: Senior Debt 13,322 13,322 Residual Coverage 10,563$ 13,906$ Less: Subordinated Debt 17,854 17,854 Residual Value to Common -$ -$ Subordinated Debt Coverage 59.2% 77.9%
  • 16.
    ©2016 RSM USLLP. All Rights Reserved. Considerations • Factors behind market approach limitations. - Choosing only distressed firms may be problematic if there is few available. - Adjust multiple for distress (highly challenging) • Factors behind income approach limitations. - Using distressed discount rates of 30% or higher may overestimate value. • Use multiple methods, if possible. 15
  • 17.
    ©2016 RSM USLLP. All Rights Reserved. Example 3: Market Approach – Service Co. 16 Low -- High Adjusted EBITDA 5,355$ 5,355$ EBITDA Multiple 6.5x 7.0x Implied Enterprise Value 34,808$ 37,485$ Plus: Sponsor Committed Equity Infusion 2,500 5,000 Plus: Cash 248 248 Available for Paydown 37,556$ 42,733$ Less: Senior Debt 25,249 25,249 Residual Value For Subordinated Debt 12,307 17,485 Less: Subordinated Debt 29,045 29,045 Subordinated Debt Coverage 42% 60% Valuation Range
  • 18.
    ©2016 RSM USLLP. All Rights Reserved. Example 3: Income Approach – Service Co. 17 Sensitivity Analysis - Implied Price of Debt Based on Following Concluded Yields 27.00% 28.00% 29.00% 30.00% 31.00% 32.00% 33.00% 71.3% 69.6% 67.9% 66.3% 64.7% 63.2% 61.7% Concluded Price of Debt (% of Par) 63.2% -- 69.6%
  • 19.
    ©2016 RSM USLLP. All Rights Reserved.©2016 RSM US LLP. All Rights Reserved.
  • 20.
    ©2016 RSM USLLP. All Rights Reserved. This document contains general information, may be based on authorities that are subject to change, and is not a substitute for professional advice or services. This document does not constitute audit, tax, consulting, business, financial, investment, legal or other professional advice, and you should consult a qualified professional advisor before taking any action based on the information herein. RSM US LLP, its affiliates and related entities are not responsible for any loss resulting from or relating to reliance on this document by any person. Internal Revenue Service rules require us to inform you that this communication may be deemed a solicitation to provide tax services. This communication is being sent to individuals who have subscribed to receive it or who we believe would have an interest in the topics discussed. RSM US LLP is a limited liability partnership and the U.S. member firm of RSM International, a global network of independent audit, tax and consulting firms. The member firms of RSM International collaborate to provide services to global clients, but are separate and distinct legal entities that cannot obligate each other. Each member firm is responsible only for its own acts and omissions, and not those of any other party. Visit rsmus.com/aboutus for more information regarding RSM US LLP and RSM International. RSM® and the RSM logo are registered trademarks of RSM International Association. The power of being understood® is a registered trademark of RSM US LLP. © 2016 RSM US LLP. All Rights Reserved. RSM US LLP 1185 Avenue of the Americas New York, New York 10036 +1 212 372 1000 www.rsmus.com