Amspec Bond Writing Paper Long 20S - Department Store
DISSER~1.PDF
1. Economics of Music Copyright Piracy
and the MP3: The Whole Picture
Mahtab Mansingh
Student Number 039001795
MSc Financial Economics
Submitted in partial Fulfilment of the Requirements for the MSc in Financial
Economics at the University of Leicester
13 October 2005
2. Acknowledgements:
I would like to thank my supervisor Professor Gianni De Fraja whose
invaluable guidance put me on the right track.
I would also like to thank Eric Boorstin for his advice on getting data without
which my paper would have been unsubstantiated, a generous donor on the BPI
research team who sent me loads of data, Laura Childs from the IFPI for the IFPI
reports for 2005, and all my friends who let me crash at their place once my
accommodation contract was up and also for keeping me well fed during that period.
3. Abstract :
The dawn of the Napster era opened up a Pandora’s box of back alleys on the
internet. Most of the governments didn’t want to tax the internet in order to encourage
its development; this also meant the lack of rules and regulations which do foster
growth but also anarchy and chaos. In this chaos the economic, social and political
forces fight it out until there are a set of rules for fair play. The countries which had
the highest internet penetration are consequently the ones where the battle has been
fought. Now the war (at least for music) is almost over and a highway is being made
on this untrodden path.
In this paper I examine the arguments from both sides to see if there is any
truth in them and find that there is truth in all of them but all these pieces fit together
into the jigsaw in different ways depending on the country in question. Mp3
downloads are the future, and the Recording industry needs to accept this and act
accordingly by creating a legitimate market for the legitimate demand, not by shutting
down P2P. Also P2P has played a major role only in the countries where it has a high
penetration. This makes sense, the very reason that these countries encouraged the
adoption of the internet and broadband is to move people into the digital market place.
Now it is time for the suppliers to supply their goods in this digital market place too
where the demand is.
4. Table of Contents
Part I: Background....................................................................... 2
Section 1:........................................................................................................................ 2
(i) Introduction:........................................................................................................ 2
(ii) A Brief Time line of Developments.................................................................... 3
Section 2: The Geek Talk (Technical):........................................................................ 5
(i) The MP3 Format and Winamp: ......................................................................... 6
(ii) World Wide Web (WWW): ............................................................................... 7
(iii) Napster:............................................................................................................... 8
Part II: The Economics of Copyright Piracy ........................... 12
Phenomenon of Experience Goods:........................................................................... 12
Album Sales Decay: ................................................................................................ 12
Perfect Substitutes:................................................................................................. 13
Economic Costs of Piracy:...................................................................................... 13
Economic Benefits of Piracy: ................................................................................. 15
Estimation of Piracy:.............................................................................................. 17
Pirated and Counterfeited goods, the Difference?............................................... 18
Part III: Economic Analysis:..................................................... 19
History of the Music Industry,................................................................................... 19
The Music Industry Model Today: ........................................................................... 19
Is the Industry Overreacting?.................................................................................... 21
Factors Affecting Music Sales and Piracy:............................................................... 27
Pricing Strategies:....................................................................................................... 35
The Superstar Phenomenon: ..................................................................................... 35
Alternative Business Models:..................................................................................... 36
Summary: .................................................................................................................... 37
Part IV: Literature Review: ...................................................... 39
Part V: Model.............................................................................. 44
Model 1: ....................................................................................................................... 44
Model 2: ....................................................................................................................... 48
Part VI: Conclusion.................................................................... 50
References: .................................................................................. 52
Appendix 1: Regression Results ................................................ 56
Appendix 2: The Who’s Who of the Industry.......................... 58
Appendix 3: Late Breaking News.............................................. 60
1
5. Part I: Background
Section 1:
(i) Introduction:
“RIAA sues grandmother for downloading Snoop Dog”1
. These are the kind of
headlines that plagued the dawn of an era in which people would be able to listen to pre-
recorded music whenever and wherever they wanted on almost any device they were
using whether it was a mother on a phone at home or a soldier in a tank in Iraq. Was this
because of the growing popularity of an un-police-able new set of technologies?2
. Or was
this a new economy with a free distribution medium where there was no room for the
‘Recording Studios’3
?
According to the industry, our society was decaying to a point where anybody and
everybody should be a suspect for illegal downloading of music, software and movies.
An anarchist’s paradise in which the government had to start monitoring all traffic on the
internet and on people’s personal computers to make sure that there was no illegal
trafficking or ‘swapping’ of copyrighted digital media.
The communist rebels of the internet age believed that P2P networking meant that
there was no longer a need for the Recording Studios. Artists, they said could simply use
the internet as a marketing tool and earn their profits from concerts. They believed that
the Studios were simply lashing out at the common man in order to protect their hold
over the music industry and their gargantuan profits. There were cries that the artists were
being exploited and that they only got a meagre portion of what the album made. The
1
New York Times (date) Mrs Ward was accused of sharing the works of well known Hip-Hop artists using
KaZaA, although she uses an iMac. (iMac is a computer produced by Apple that is not capable of running
the file-swapping program, KaZaA.)
2
Namely the MP3, the internet, and the P2P networks. These technologies will be discussed and explained
in the technical section of this paper.
3
The Studios; The Recording Studios are the large corporations like Sony BMG, Universal, Warner etc.
2
6. DMCA4
was viewed as an attempt by the Recording studios and the other big companies
to defend their unfair position and to continue sucking the blood of the poor consumers
and at the same time to exploit the artists.
This sounds like the classic battle between the haves and the have nots. In this
paper I aim to explore the arguments from both sides and hope to find an answer.
I will start with a section explaining the technological advances that have given
rise to the present environment and then go on to discuss the economics and some
important literature published prior to this paper. I will then use two models to determine
the effects of certain factors such as music downloads on record sales.
(ii) A Brief Time line of Developments5
The first reproducible recording of sound was that of a human voice singing
‘Mary had a little lamb’ on a tin foil cylinder phonograph invented by Thomas Edison in
1877. The next big milestone was Emile Berliner’s early gramophone, which gradually
evolved into the LP players of today. Along the way there were many other alternative
formats that were developed few of which became a commercial reality. The magnetic
tape invented in 1928, followed by the Philip’s Compact Audio Cassette in 1963 and the
Sony Walkman in 1979.
Then came the Digital Revolution, allowing advances in the field of computers
into the Music Industry. In 1982, the Audio Compact Disc (CD) was introduced for
music and in 1985 the first CD ROMs were introduced using the same technology.
Although digital audio tapes were also introduced, they didn’t catch on and CDs had
grabbed everyone’s the attention as they were also more durable than audio cassettes.
At this point it is useful to understand this process. There are two ways to get
music onto a CD. It can either be pressed or burned. The former is the best way of doing
it as it uses a glass master. (Glass mold, “this is done by laser etching a glass disc with
4
The Digital Millennium Copyright Act of 1998, discussed in more detail in the section on the Music
Industry.
5
http://history.acusd.edu/gen/recording/notes.html
3
7. tiny holes corresponding to the digital on's and off's that code the original source… this
glass master is then electroplated with nickel or silver to form a metal negative
stamper.”6
In 1991, the MP3 was invented although it only became available as software in
1994. It was when Winamp was released in 1997 that the MP3 began to take off. The
release of Napster in 1999 launched the MP3 into stardom. In 1998 the fist hardware
MP3 player was released making the MP3 portable, this was followed in 2001 by the
iPod and then by the iTunes Music Store in 2003.
6
http://www.dynamicsun.com/ourprocess/
4
8. Section 2: The Geek Talk (Technical):
Although the title of this section implies that it is highly technical I have tried to
explain this in the simplest fashion possible so that the subject becomes lucid to non-
geeks.
The ability to reproduce a sound implies that it must first be recorded and then
must be capable of being played back. In terms of technology this is two separate
processes. Although the first device capable of recording sound the Phonautograph , was
invented in 1857 by Leon Scott there were no means by which to replay the sounds
captured by it.
To become a consumer device it must also be convenient. Murphy's Law7
has
great significance in industry. It states that, ‘If there are two or more ways of doing
something and one of those ways will result in a catastrophe then someone will do it.’
Thus it must be designed in order to minimise such an event.
It wasn’t until 1890 that Emile Berliner’s gramophone went into commercial
production in Germany. This represented the beginnings of the personal audio revolution.
A person would be able to listen to his or her own choice of recorded music while alone
as opposed to live music which had been the only option until then.
Although the Audio Tape had been invented it was inconvenient for casual use by
consumers as it had large reels of thin tape that could easily get entangled during
playback. It wasn’t until Philips invented the Compact Audio Cassette that audio cassette
usage began to grow. The invention of the Sony Walkman is thought to have really
changed things, however a glance at the sales figures for audio cassettes and LPs of the
time shows otherwise. The personal walkman may have started a new culture but it had a
negligible effect on audio cassette sales. The audio cassette although more portable than
7
http://www.waynerad.com/laws.php
5
9. the LP which was at best 9 inches wide, didn’t even reach half the popularity of the LP of
its own accord.
The dawn of the digital age ushered in the Audio Compact Disk or Music CD as it
is popularly referred to. The Audio CD was an immediate success. A look at the IFPI8
sales figures of the recording industry by format of sale, shows the LP sales falling off
drastically and the CD immediately picking up those lost sales. This sounds like a
familiar phenomenon. While the Sales of LPs crashed down to a minimal level, Audio
cassettes also picked up some of those customers who had given up the LP.
A good way to pick the next milestone is the IFPI graph of sales. The record sales
peaked at some point between 1996 and 1998. After that they inexplicably fall quite
sharply until some point between 2002 and 2004. There are two or three events that took
place around these periods. The MP3 and Winamp, the popularisation of the internet and
soon after, Napster; all coincide with the first set of dates while the formal shut down of
the Napster Service coincides with the latter dates. It is important to understand each of
these as they are of direct relevance to the central issue of this paper.
(i) The MP3 Format and Winamp:
Although the MP3 had been around since 1991 and the software encoder had been
around since 1994, there had been no user friendly way to play songs encoded in this
format. Let me explain what the MP3 is all about. A single 110 minute Audio CD if
copied onto a computer would take up around 700 Megabytes9
of space. The same CD
when encoded by an MP3 encoder to the MP3 format would take only around 70MB10
.
This translates to 1 MB of data storing approximately 1 minute of MP3 Audio data. That
is one tenth the space of the original. One of the main reasons that the MP3 is able to do
this is because it removes the data on sounds that are inaudible to the human ear. Thus to
8
International Federation of Phonographic Industry (IFPI) Recorded Music Sales 1969-2004 (The
Recording Industry in Numbers 2005)
9
Megabyte (MB) A unit of storage used in computers. 1MB = 1024 Kilobytes (KB), 1KB = 1024 Bytes of
information. As a point of reference, a regular 3.5” floppy disc stores 1.44 MB of data.
10
Depending on the quality of the encoding, Generally 128 KBPS is the standard.
6
10. us the digital MP3 sounds the same as the original analogue although the MP3 does not
contain a lot of the elements of the original. It is thus the difference between our
perception and the real occurrence in nature. It is the same phenomenon that has kept
some LP aficionados faithful to it as they prefer to hear the original as it happened rather
than a digital version. This technology is used in hi-fi systems such as those made by
BOSETM
to separate the base (low frequency sounds) from the high frequency sounds and
use different speakers to play each set (Woofer and Tweeter respectively). It is a question
of perception, the detractors of digital music would compare it to the vegetarian
flavourings used in wafers which taste like beef, pork and chicken.
This format was not alone, in its category. There were many other competing
formats however the reason for its success is that the Fraunhofer Gesellschaft (A German
Society), licensed its use freely for a fixed fee. The competing formats however were
joint developments that were indecisive11
and had restrictive licensing terms12
.
As already mentioned, for any product to succeed it must be easy to produce (or
reproduce as the case may be) and easy to use. The launch of the Winamp software made
playing an MP3 as easy as opening a Microsoft Word file…a simple double click.
(ii) World Wide Web (WWW):
The Internet, or the Net as it is commonly referred to, is the worldwide system of
interconnected computer networks13
that use packet switching to transmit data by using
various protocols14
. It is made up of thousands of commercial, academic, domestic and
government networks which allow us to use a bouquet of information and services, from
email, online chat and web pages to file sharing and internet telephony.
11
The techno savvy reader will realise that many people make this mistake and the next one.
12
heavy restrictions lead to low usage whether we talk about the MP3 or today’s DRMed formats
promoted by different companies, but more on that later in the paper.
13
A Network of computers is simply a group of computers that are interconnected and can communicate
with one another.
14
Could be compared to different languages used for different purposes between different networks
7
11. It didn’t start out this way; it started as a purely academic network used to connect
different institutions to facilitate ‘the exchange of ideas’. The first few web pages
appeared in the early 1990s and the first browser in 1993. Only in 1995 was it opened to
commercial interests and by 1996 the word Internet was common knowledge although
more popularly referred to as the World Wide Web. It is said that the non-proprietary
nature of the methods used to connect individual networks together allowed organic
growth of the network and encouraged interoperability while preventing any single
company from exerting too much control over the network.
(iii) Napster:
Shawn Fanning’s Napster was the dawn of a new generation of networks on the
internet called the Peer to Peer (P2P) networks. Until Napster, individuals on the internet
would request information or files from powerful computers called servers, on this new
type of network the servers only kept a list of the files that were available on the network.
The files themselves remained on each individual user’s computer. If X was looking for a
file, then he would send a query to the server he was logged into and the server would
send back a list of computers which had the file he was looking for. If he decided to
download the file from Y, then he would establish a connection directly to Y’s computer
and Y would send him the file. The courts in the United States ruled that whoever had
that central list on his or her computer would be held liable for the copyright
infringement.
The reason that this technology was groundbreaking was because all the clients
(users) provide resources to the network. Each client contributes processing power,
bandwidth and storage space. This is known as a scalable network, which means that as
more users join the network and demand on the system increases, the total capacity of the
network also increases. This is not entirely true for the type of P2P network that Napster
used, and applies more to a ‘pure P2P network’ where there is no server at all.
Most P2P networks fall into one of the following three categories:
8
12. First Generation (P2P):
Centralised peer-to-peer model; in this type of P2P network, a user sends a key
word (also known as a search string) to a centralised server of whatever they are looking
for, be it a song, a video, or a movie. The centralised server then sends back a list of peers
that have the data and initiates the connection for downloading the file. This the type of
network that Napster falls into.
Second Generation (P2P):
Justin Frankel and his team from Nullsoft (incidentally an AOL-Time Warner
company) developed the Gnutella network to take advantage of a loophole in the law. It
was a network without a central server. Although AOL had ceased development of
Gnutella and stopped distributing it on their website, the fire had caught and it became a
raging success. Users of the dyeing Napster switched to Gnutella. However this form of
network was not very effective as all users did not have the same resources and therefore
many nodes or clients stopped functioning due to bandwidth bottlenecks as more users
joined the network.
Niklas Zennström and Janus Friis introduced the proprietary FastTrack protocol
(which powers KaZaA) in which ’supernodes’ were elected dynamically by the nodes.
This means that users with more resources than the average user were elected by the
average users’ computers to act as the indexing server, i.e. the equivalent of the
centralised server in the first generation networks.
In a short while the Gnutella protocol had been reverse engineered and limewire
among other clients was released. The new implementation of the network would follow
the same logic as the FastTrack protocol and elect some users with above average
resources to be the indexing centralised servers. Both of these networks also added two
new features. The ability to resume downloads without loss if disconnected and
downloading from multiple sources simultaneously.
9
13. These two new implementations of the second generation P2P network became a
raging success and their popularity soared like wild fires. Today they are still in the top
three most popular networks, FastTrack with 2,673,383, and Gnutella with 2,282,292
users according to http://www.slyck.com/ at 18:31 BST on the 1st
of October. There are
many other networks whose popularity soars or dips in relation to the latest antics of the
Recording studios or the Movie Studios and the general legal environment. Examples of
other popular networks are BitTorrent and eDonkey however these are less popular for
music downloads and therefore not relevant to this study.
Third Generation P2P:
Although this is the most highly evolved form of P2P, it is less popular because
the features that it introduces increase bandwidth and computer processing power. The
extra features provided by these networks provide anonymity. However the additional
cost of the anonymity is too high and therefore they have not gained in popularity.
There are many other hybrid networks that try to combine the benefits of all the
three generations of networking. Whichever flavour of P2P appeals to one, the fact
remains that P2P is here to stay. Whether it is put to a legitimate use ultimately or will
remain the back alley of the internet is still to be seen.
Problems of P2P networks:
All societies have antisocial elements. Peer to peer networks are not without their
detractors. This list from Wikipedia describes some of them.
1. Poisoning attacks (providing files whose contents are different than the description)
2. Denial of service attacks (DOS) (attacks that may make the network run very slowly or
break completely)
3. Defection attacks (users or software that make use of the network without contributing
resources to it). These are also known as leachers, people who only download from
others without offering anything to upload in return.
4. Virus, malware, or spyware infected files
5. Malware in the peer-to-peer network software itself (e.g., KaZaA)
10
14. 6. Filtering (network operators may attempt to prevent peer-to-peer network data from
being carried especially when ordered to do so by the courts)
7. Identity attacks (e.g., tracking down the users of the network and harassing or legally
attacking them)
8. Spamming (e.g., sending unsolicited information across the network- not necessarily as
a denial of service attack)
“Most attacks can be defeated or controlled by careful design of the peer-to-peer
network and through the use of encryption. P2P network defense is in fact closely related
to the "Byzantine Generals Problem". However, almost any network will fail when the
majority of the peers are trying to damage it, and many protocols may be rendered
impotent by far fewer numbers.”15
15
Wikipedia
11
15. Part II: The Economics of Copyright Piracy
Phenomenon of Experience Goods:
In today’s world there are many goods that fall under the category of experience
goods. Wikipedia16
defines Experience as follows; “Experience as a general concept
comprises knowledge of or skill in or observation of some thing or some event gained
through involvement in or exposure to that thing or event.” Accordingly an experience
good is an experience that we are willing to pay for such as a book, a movie or music. It
so happens that each of these is available today in the digital form and is therefore easily
produced as well as reproduced thus making it easy to pirate. However in comparison to
movies which most people do not like to watch a second time, people do like to listen to
music a second time and sometimes even more often. For this reason music is a more
complicated experience good to the point that the first time even has an economic name,
sampling.
Album Sales Decay:
This term applies to both music and software as software is a productivity tool
and experience actually increases the productivity of a person using it. In the case of
music we must also remember that the first experience does not necessarily lead to a
subsequent one. Experiences beyond the first one will depend entirely on the utility of the
first experience to the person. If the good had high utility then the person will be willing
to forgo something to experience it again. A single experience can be thought of as a unit
of experience. Consequently if the marginal utility of the good is not high enough then
the person may not be willing to sacrifice another experience or any other good for it. On
the other hand the marginal utility could have a curve similar to that of a production
curve, where it increases up to a point after which it has diminishing marginal utility.
This is true of most songs in the pop genre, as the utility increases at a diminishing rate
and after a point everyone is sick of hearing the song. In the music industry, this simply
means that those albums will now be soled at throw away prices.
16
www.wikipedia.org
12
16. Perfect Substitutes:
What if the marginal cost of listening to an additional unit of the good was next to
nothing? Wouldn’t one listen to it more rather than paying to listen to something else?
This brings us to the phenomenon of substitutes. Suppose we consider a situation where a
person has two choices, the first is to buy a CD for £15 while the second is to download it
for free. The only cost that the person incurs is the cost of the internet connection for the
duration of the download. Thus the downloaded copy of the music is a perfect substitute
for the purchased album as it is practically free. In his book “Copyright and Economic
Theory”, Richard Watt uses a two person two period economy to explain this
phenomenon. Although he uses very sound reasoning, we can not apply the same theory
here as he assumes that the pirate also buys the original copy. In the case of music, very
often the pirated copy is available on the internet is released a few weeks before the
release date of the original by somebody who has access to the original.
Economic Costs of Piracy:
Quality:
The first of course is the issue of quality. In the analogue days, a copy was most
definitely of a lesser quality then the original due to the addition of noise from different
sources. In the digital age one would think that this should not be a problem, however it
is. When the MP3 format was in its infancy, the software that people used was not fine
tuned enough to make perfect copies of the CD. Very often this gave rise to distortions in
the sound, or clicking or beeping sounds, commonly referred to as clicks and beeps. In
this case the user would either have to download the same file again from another user or
simply buy the original. Today this is no longer a problem as the software encoders have
been fine tuned and people are aware of the good ones and use only those. The process is
automatic so there is little margin for error.
Network Problems:
Another cost was due to the P2P networks which were still in their infancy. Users
would often get disconnected or for some reason not be able to complete the download.
When this happened they would have to start all over again. This phenomenon was
considerably higher for larger files. All the other problems of a P2P network listed in the
13
17. technical section of this paper also come under this section as costs of piracy. This
problem has since been resolved by the networks allowing one to resume a download
from wherever they got disconnected or broken off only downloading the remaining
portion of the file. Also a user can download or resume a download from more than one
person at the same time.
Narrow-Band:
At the time that Napster made its debut, the majority of internet users were on
narrow band connections, normally dial-up. These were not reliable and also very
expensive as the user would have to pay for the time that they were using the internet at
the rate of a regular voice call. Added to this the narrow band meant a longer time spent
online and more chances of getting disconnected. This is also becoming less and less of a
problem as more users make the switch to broad band internet.
Other Costs of Piracy:
The cost of getting caught is a cost of piracy, but in most cases this is very
minimal especially considering the probability of one person in a couple of million
getting caught17
. Although this is a very tempting and easy option with the recent
advances in P2P technology, it is however illegal as no royalties are being to the artist or
to the producers of the song. The reason that this medium remains un-policed is probably
that most governments are not taxing sales on the internet. If there is no source of
revenue then the government is not likely to spend money in the area. Although there are
many laws about what can or can not be done on the internet, the Digital Millennium
Copyright Act of 1998 (DMCA), almost seems to leave it to the copyright holders to fight
for their revenues, by asking them to notify the infringers, which means that they have to
be on the network and actively invest in finding out who is freeloading. In simple terms it
gives them the authority to conduct investigations to protect their interests. In many
countries the cost of piracy is not very high because the governments are not trying hard
enough to catch the perpetrators. In this kind of environment people have a tendency to
simply download the music rather than pay money to buy it.
17
The Recording Industry seems to have pursued the major sharers of these files and not necessarily the
casual downloaders.
14
18. Economic Benefits of Piracy:
When it comes to benefit then we must ask the question who is benefiting? Is the
society benefiting? Or is only a single individual benefiting? In the case of music, is the
promoter benefiting, is the consumer benefiting, or is the artist benefiting?
Social Welfare:
Social welfare is the sum (or weighted sum) of all the participants in the market
and this decides what is beneficial or harmful to the market. In this case some times if the
artist is listened to by more people instead of other artists because of piracy, it is
beneficial for the artist, because their popularity goes up even though they do not get
compensated for it.
Marshallian Measure of Social Welfare:
According to Marshal, social welfare is the sum of all monetary profits by all the
producers including the royalty income of the producers and consumer surplus.18
If we
consider this model then when a consumer buys pirated music, it is beneficial to the
market as the pirate is making some money. Also in the earlier days, when people were
on narrow band connections, downloading music meant staying online longer and this
would also constitute contribution to the market and therefore benefit to the market.
Similarly when we take a two country model, where one is the source of the
music and the other the consumer. Pirates in the consuming country are actually
contributing to their own country’s GDP. Although they do not actually produce the
software, piracy becomes their occupation and the profits from selling the music are
actually their income. This is income is no different from the income generated from a
singer singing the same tunes for money.
Although in the above paragraph I have described how the local economy does
benefit, we should also note that when the pirate sells his pirated music, he is choking the
local talent. As we will discuss later in this paper, people have a limited appetite and
18
“Copyright and Economic Theory” by Richard Watt.
15
19. budget for music. If they spend all their money on pirated music from the primary
market, then they have little or no money left to buy music produced by their on local
industry which is normally much cheaper than the music from the primary market. So at
the end of the day the net contribution of the pirates is questionable. It will depend on the
tastes and appetite for music in the local industry.
Market Share:
In the case of software like Microsoft Windows XP, the indirect benefits to Microsoft are
obvious. In the software industry, market share is everything especially when it comes to
operating systems. If Microsoft controls 90 percent of the desktop operating system
market then regardless of how many of them are pirated and how many original, they still
stand to gain. Microsoft gains more out crowding out the competition than it does by
losing money to pirates. This is because it can strike deals with hardware manufacturers
or decide on standards for the entire desktop market and everyone will follow. They can
decide how software should be written, software makers have to make sure that they
comply with the specifications set by Microsoft. This is called the ‘lock-in’ and is
explained in great detail by Varian and Shapiro in their book “Information Rules”. There
are many examples of lock-ins in the music industry. Apple’s iPod and iTunes are a
prime example. Users of the iTunes service have to have an iPod to listen to music that
they buy. Apple doesn’t however benefit from Piracy. So this is not applicable to Music.
Sampling:
Many have talked about ‘sampling’ as being the positive effect of file-sharing. One must
acknowledge that there is a definite positive effect from sampling however this probably
wouldn’t apply to those in the top five to ten singles. Sampling definitely plays a role in
the other 90 per cent of the music that is not at the top end of the charts. For example
people in China who like country music will not be subject to the onslaught of
advertising campaigns that those living in America would be. The only way that they can
sample country music is to download it off the internet and listen to it. Having heard it, if
they like it then maybe they will purchase the album. Similarly, a surfer in a small town
in India who wants to see what Elvis Presley sounds like will probably download the
16
20. track and then if he likes it purchase a CD. None of this would happen if it wasn’t for the
ability to download the music.
Another example for sampling is, some P2P applications have the ability to browse all
the shared files of a user. Say A downloads a file from B, of a particular artist and sees
some other artists that she likes in B’s collection, then she will figure that her taste is
similar to that of B. When she finds a new artist in B’s collection, she will be curious to
see what that artist sounds like and consequently might purchase that artist’s CD.
Creative Stimulation:
Artists in secondary markets such as the Latin music industry or the Chinese
music industries sometimes copy the tunes of popular western hits. They usually do not
pay any form of royalties on these tracks even though most of them make profits on these
songs. Although this is not a result of downloaded music, it is on a large scale and is very
visible. There are many other artists and DJs who do download popular songs and
actually make money from them without paying any royalties. DJs are credited with
being one of the strongest influences on the kind of music that people listen to19
. This is
evidenced by the fact that all radio stations take their cues from what the club DJs are
playing. Most DJs prefer using LPs or MP3s to CDs as CDs are more difficult to
‘handle’, when mixing, scratching or cutting a song. This is partly because, the CD is
spinning at a high speed and its difficult to jump back and fourth without buffering the
entire track. With an MP3 the entire file can be buffered in the memory of the computer
and it is easy to jump back and fourth through a song at will.
Although there maybe a positive effect due to sampling, the overall effect due to people
downloading music instead of buying it seems to have overshadowed this effect.
Estimation of Piracy:
19
http://www.dynamicsun.com/ourprocess/ Dynamic Sun is a company that makes the CDs and LPs for
some of the Record Labels.
17
21. This is a very controversial area as many feel that these figures are highly
exaggerated, as they take into account estimates of copies made or consumed. This is the
quantity consumed but is by no means an estimate of the sales lost. In other words, just
because the customers have consumed a copy does not mean that they would have bought
it. Varian’s latest paper20
appears to question the legitimacy of these estimates. If the
people in that country concerned are not going to buy the high priced CDs then they are
not in the market for the legitimate CDs and should this be discounted from the
estimation of pirated goods consumers as they do not affect the market for legitimate
goods. They could quite possibly have gone without it rather than pay for it. In that case
they can not be counted in the legitimate demand curve and their inclusion is an incorrect
assumption of consumer behaviour. Despite the inaccuracy of these estimates, they are
widely used as estimations of losses caused and damages are claimed in accordance with
them. They are also used to coerce changes in the legal system by the industrial lobbies.
Pirated and Counterfeited goods, the Difference?
Although both are against the law, there is a difference in the degree that these
two are wrong. Piracy implies that something is being used without the creator getting
paid for its use. Counterfeit however is when a person makes money by making duplicate
copies of the original and tries to pass them off as the original item. Most of Richard
Watt’s two period diagrams could be used to explain the economics of counterfeit goods.
Sometimes the counterfeiters also sell the goods without trying to pass them off as the
originals, at a much lower price than the originals. There is a lot of speculation about this
activity and there are many organised criminal gangs operating in this business21
. The
cost is next to nothing and the mark-up on investment is 800 percent while the mark-up
on heroin in 200 percent. If one is to believe that then, it would appear that the Recording
Studios are only pursuing the soft targets, the downloaders and sharers of music on the
internet. Some even go so far as to say that these organised criminals are funding
terrorism.
20
Varian, Hal R. (Copying and Copyright)
21
Christopher, Abby. (Mob Pirates: Menace or Myth?), Wired Magazine 19 Aug 2005
(http://www.wired.com/news/digiwood/0,1412,68490,00.html)
18
22. Part III: Economic Analysis:
History of the Music Industry,
Although many consider music as a universal language, the concept of music is
probably very different to us from what it was to the flautist Neanderthals 45,000 years
ago22
. Anthropologists are still not sure of the exact purpose of music in the societies of
the time. Thousands of years later, mankind’s tribal rituals have involved drums, singing
and dancing to appease the gods. The Romans credited the Greeks with introducing many
forms of music and dance around 360 BC. Even though the function of the music, and
dance of the tribals and of the advanced Roman civilisation was to appease the gods,
singing and dancing brings about a sense of release which they must most definitely have
felt. The entertainment value of music is thus quite an old development and between
Thomas Edison and Emile Berliner23
we were able to separate the performance from the
playback or enjoyment.
The Music Industry Model Today:
There are some people who ask, why a music CD costs so much more than the
price of the CD. They say that it costs next to nothing to press24
the CD and the music
CD should cost around the same. What they forget is that they are paying not for the CD
which is like a blank canvas but for the digital information on the CD which could be the
Mona Lisa on the canvas. This is an inevitable consequence of recorded music i.e. the
separation of the experience from the event. When one has only enjoyed the experience
without witnessing the event or the effort that goes into it one doesn’t realise how much
effort has gone into the production of the article, in this case a CD.
I think the music industry is best understood if looked at the same way as any
another industry. An artist has a feasible idea, their talent. They approach the venture
capitalist, the recording studio. If the venture capitalist like’s their idea, then they put in
22
http://enjoyment.independent.co.uk/music/news/article286736.ece
23
Thomas Edison and Emile Berliner’s contributions lead to the gramophone and therefore music playback
as we know it today.
24
To make the glass mould for the CD, this process is described in the introductory section. -
http://www.dynamicsun.com/ourprocess/
19
23. an investment (the sign on bonus, and recording facilities) and have a say in the
management of the firm, the career of the artist. The facilities provided include the
services of a song writer or lyricist. At each of these stages, professionals from different
fields are involved and all of them charge a fee for their services.
Once the product, a record single or album has been produced, it must be marketed and
promoted.
Its very easy for someone to say that the computers of today are powerful enough
to have a studio on a laptop, however what they don’t realise is that an artist is not a
generalist. He or she is specialised in singing and may or may not possess the skills
required to edit, or master the final CD. The computer merely replaces the equipment
used by all the professionals, not their expertise. At the same time, the software and
hardware does not come for free. Sound editing software is very expensive as is the
hardware for recording those songs. I doubt if Metallica would have been so famous had
they sung along to computer synthesised guitars.
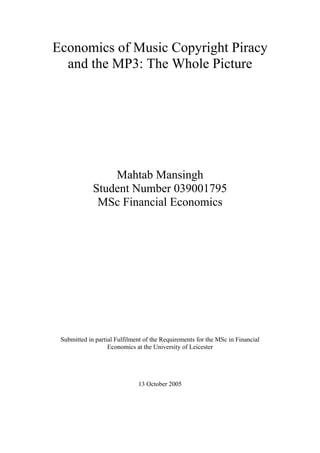
CD Prices:
From the economic perspective another point to be noted is that average music
CD prices have fallen from $21.50 in 198325
, when CDs were first introduced to about
$13.3026
in 2004, while an average album on iTunes sells for $9.99. This means that the
nominal prices of CDs have fallen an astounding 61 percent in eleven years. The graph
below shows how the real price of a CD has dropped to about 60 in 2001, when the
nominal price had only fallen by about 3- percent.
25
McCarthy, Michael. “CD prices hit sour note with retailers, buyers”, USA TODAY 8 Dec 2003.
26
“CD Price Declines are Accelerating, Says The NPD Group”,
http://www.npd.com/dynamic/releases/press_040603.htm
20
24. Figure 1 (Percent Change in CD prices and the CPI since 198327
)
Is the Industry Overreacting?
Many people feel that the Recording Industry is overreacting or that they are
simply being over protective and that P2P downloads of music are actually helping the
Industry. A quick look at the graph below should clear things up completely. Is there case
for worry?
LPs
MCs
CDs
Music
Videos
Singles
0
500
1000
1500
2000
2500
3000
3500
4000
1973
1974
1975
1976
1977
1978
1979
1980
1981
1982
1983
1984
1985
1986
1987
1988
1989
1990
1991
1992
1993
1994
1995
1996
1997
1998
1999
2000
2001
2002
2003
2004
bn$USAll
0
100
200
300
400
500
600
700
800
900
bn$USSinglesOnly
Figure 2: Singles Sales Vs All other Formats
27
Taken from http://www.azoz.com/riaa/pr/CDValueStudy2002.pdf
21
25. According to the IFPI report, which is where these figures are from, the singles
market includes vinyl, cassette singles, CD singles (2 track and Maxi) and DVD singles.
It normally consists of a single hit song with one or more versions or the song. This
appears to be the worst affected market, as the sales seem to have come crashing down.
The problem with attributing this entirely to the evolution of P2P is that it already had
crashed earlier in 1983. CDs were introduced in 1982, and possibly became widely
available by 1983. In the technology market, it is often noticed that when a new product
is announced, the customer delays his or her purchase until the new product is available.
This could be an explanation for the decline in sales in 1983 in the singles market. The
graph below shows the corresponding decline in singles sales with the introduction of the
CD. It is possible that due to the high price of CDs the customer decided to wait until the
artist entire album was available before buying it. Further it is also possible that after
many years of experience, the customer has learned that the CD single is always very
expensive and the album affords better value. This again goes against the assumption in
the two period models put fourth by Richard Watt (2000) for the average consumer. If
this is the case then it means that the consumer has decide that the single is bad value and
must have begun to download the singles as soon as they started appearing on the internet
in 1997 or prior to that. As this was a single song it would take about 20 minutes at most
on a narrow band connection, enough to harm the singles market. Downloads didn’t seem
to affect CD sales that much until 1999, when Napster could have made downloading
entire albums very convenient. It would appear that Napster was in fact responsible for
the reduced sales in singles and in CDs.
22
26. If we compare the effect of the new CD format on the singles and LP market, we see that
Singles
CDs
0
100
200
300
400
500
600
700
800
900
1973
1974
1975
1976
1977
1978
1979
1980
1981
1982
1983
1984
1985
1986
1987
1988
1989
1990
1991
1992
1993
1994
1995
1996
1997
1998
1999
2000
2001
2002
2003
2004
bn$USSingles
0
500
1000
1500
2000
2500
3000
bn$USCDs
Figure 3: World Singles and CD Sales in Billions of Units
LPs
CDs
0
200
400
600
800
1000
1200
1973
1974
1975
1976
1977
1978
1979
1980
1981
1982
1983
1984
1985
1986
1987
1988
1989
1990
1991
1992
1993
1994
1995
1996
1997
1998
1999
2000
2001
2002
2003
2004
BnsofLPs
0
500
1000
1500
2000
2500
3000
BnsofCDs
Figure 4: World LP and CD Sales in Billions of Units
23
27. there is an immediate decline as soon as CDs are introduced. If this is the effect that a
new more convenient format has on the market, should this not then be expected when
the MP3 became popular? When the CD was introduced it was popularised by the likes
of Sony and Philips and the record companies were the ones selling them, not a software
vendor. The difference here was that the MP3 was not in the hands of any of the record
labels. It appeared as this completely out of control phenomenon which they have tried to
fight at every step of the way. Instead if they had embraced it and capitalised on its
popularity then nurturing it and promoting the development of devices they could
actually have prevented the large scale downloading of illegitimate music. N. Anand and
Richard Peterson explain how industry and more specifically the music industry goes into
a tizzy the moment they can not make sense of what is happening in the market.28
According NPD’s MusicWatch Digital service29
, iTunes came in second place
along with LimeWire as the second most popular digital music service in March, 2005.
Both the music downloading applications were used by 1.7 millions households in March
2005. The top source for digital music was WinMX used by 2.1 million households in
the same period. Similar offerings from Napster and Real Networks were also in the top
ten most popular sources for digital downloads along with P2P services like iMesh and
KaZaA.
Given these estimates and the figures in the following tables, it is clear that there
are a large number of people who will support a legitimate system of music downloads as
long as it conforms to the standards such as ease of use and variety that users have come
to expect from P2P services such as eDonkey, or WinMX. The article “US downloads
beat CD sales30
”, proves the point as it was published in 2003. The tables below,
reproduced from an IFPI report, show that the iTunes service is increasing in popularity
as are the other digital download sites.
28
N. Anand and Richard Peterson – (When Market Information Constitutes Fields: Sense Making of the
Markets in the Commercial Music Industry)
29
http://www.npd.com/dynamic/releases/press_050607.html
30
http://news.bbc.co.uk/go/pr/fr/-/1/hi/entertainment/music/3237021.stm
24
28. “About 36 million Americans—or 27% of internet users—say they download
either music or video files and about half of them have found ways outside of traditional
peer-to-peer networks or paid online services to swap their files. Some 19% of current
music and video downloaders, about 7 million adults, say they have downloaded files
from someone else’s iPod or MP3 player. About 28%, or 10 million people, say they get
music and video files via email and instant messages. However, there is some overlap
between these two groups; 9% of downloaders say they have used both of these
sources.”31
0
50
100
150
200
250
300
350
400
450
Jan-04
Feb-04
M
ar-04
Apr-04
M
ay-04
Jun-04
Jul-04
Aug-04
Sep-04
Oct-04
Nov-04
Dec-04
Jan-05
Feb-05
M
ar-05
Apr-05
M
ay-05
Jun-05
mn$US
Figure 5: iTunes Monthly Global Sales
Figure 6: Global Subscribers to Music Services32
Figure 7: US Weekly Download Sales
31
“Music and video downloading moves beyond P2P”
(http://www.pewinternet.org/pdfs/PIP_Filesharing_March05.pdf)
32
“IFPI: Recording Industry in Numbers 2005”
25
30. Factors Affecting Music Sales and Piracy:
Music is a very difficult market to predict, because it depends on so many socio-
cultural, psychological and economic factors among others. Music can be a statement of
fashion or an expression of sentiment and can also influence a sentiment.33
Album Prices:
Many people make the argument that CD prices are too high. As can be seen from
Figure 1 (Percent Change in CD prices and the CPI since 1983) on page 21, while the real
price declined by 60 percent since 1983, it has been fairly constant over the past few
years although the nominal price seems to be increases at a slow but steady rate.
Obviously if the real price is not increasing, this would imply that the nominal price is
probably increasing at the inflation rate which is definitely not responsible for the drastic
decline in CD sales witnessed since 1999.
Consumer Income:
Again from the same graph in Figure 1 (Percent Change in CD prices and the CPI
since 1983) on page 21, we can see that the per capita income of the United States has
gone up 80% since 1983. Considering that income had risen 30 percent and nominal CD
prices fallen 40 percent by 1990, and that at that point the real CD price had fallen by 60
percent, I think that a single CD would cost an average American less and less every year
in real terms even though the real price is staying constant, because their income is rising
fast than the rate of inflation.
Consumer Preferences:
This is an area which is very hard to predict and every industry struggles with it.
If people like something then they want instant gratification otherwise they won’t touch
it. We already know that in the information economy, the first copy is the most
expensive, and the subsequent copies have only a nominal expense especially keeping
digital downloads in mind.
33
Mattilaa, Anna S.& Jochen Wirtzb, (Congruency of scent and music as a driver of in-store evaluations
and behaviour) The School of Hotel, Restaurant and Recreation Management, The Pennsylvania State
University
(http://www.bschool.nus.edu.sg/departments/marketing/Jochen%20papers/congruency%20scent.pdf)
27
31. Say’s law, ‘Supply creates its own demand’, definitely does not work in this
industry, simply producing a large number of albums does not guarantee sales. The
releases have to be in tune with the current preferences in music otherwise they will be
dud albums. What might be an indicator of the kind of music people are listening to as
mentioned earlier is the kind of music played by the DJs. The problem is that this is not a
quantifiable variable, but a qualitative one. The only way to use it as a standard of
measurement is to allow the recording studio talent scouts to listen to it and pick artists
that match the mood and are suited in all ways to that type of music.
Liebowitz 34
uses concert sales and radio listening as a measure of interest in
music. However he acknowledges that the defect that most concerts are well past their
recording dates. He gets a correlation coefficient of .37 between 1991 and 1997 for this
relationship which is not very high. It would probably act as a stimulant as crowd
psychology stimulates the production of adrenalin in an individual and this may result in
them wanting to listen to more of that kind of music. It would have been more useful if
he had separated the concerts into their various genres and then examined the effect of a
concert on the sales of that particular genre of music. That would have had a higher
significance.
In the same study, Liebowitz also uses number of hours people listen to the radio
as a factor for interest in music. This may not be an indicator of interest in music itself,
however radio competes with music for the user’s listening time, and therefore one would
expect a negative relationship.
There are a number of other things that compete with music for the consumer’s
spare time. The biggest rival being the television and the telephone, because a user can
not do both of these activities at the same time. Other categories of entertainment which
could take away from music listening time and therefore record purchases are reading
34
Liebowitz, S. (Will MP3 downloads Annihilate the Record Industry? The Evidence so Far.)
http://www.utdallas.edu/~liebowit/knowledge_goods/records.pdf
28
32. (though this could be done simultaneously), video or computer games, sports activities,
or any other recreational activity which requires the user to respond to sound of some sort
would compete with music.
Age:
Age plays a big role in record sales as well as in the downloading of music.
Boorstin35
claims that youths in the age group 15-19 have long been heavy purchasers
and those in the 45+ categories the lightest purchasers of music. The table below shows
the distribution of sales by age in 2004 according to Nielsen SoundScan.
10-14
9%
15-19
12%
20-24
9%
25-29
10%
30-34
10%
35-39
11%
40-44
11%
45+
28%
Figure 9: Sales in 2004 by Age
If Boorstin is correct then the age group that purchases the most amount of music
now purchases the same amount as any other group. Whether this is because the 15-19
year olds have reduced their consumption of music or the other age groups have
increased their consumptions can not be said immediately. Given the graphs of music
sales in addition to the one below, however would lead to a different conclusion. If music
sales have declined and Boorstin is right about the lowest age group being the highest
consumer of music, then we have a case. The case being that the 15-19 year olds have
reduced their consumption of legitimate music to the same level as the others. This age
group is also known to be the most familiar with the internet amongst all the others as
they are the most comfortable with new technologies. That would imply that they are
downloading music for free instead of buying records.
35
Boortin, Eric S. (Music Sales in The Age of File Sharing)
29
33. According to an NPD group press release, “NPD research shows steeper
sales declines among consumers aged 36 and over, than among younger demographic
groups. Nearly half of these adult consumers report they are purchasing less music,
because there's less music they're interested in buying. Plus, fewer than 10 percent of this
age group report purchasing less music because of downloading… Often the older
consumer is looking for deep catalog titles by artists like Paul McCartney, Bruce
Springsteen, Santana and the Rolling Stones”36
This implies that while the recording industry is spending a lot of money
promoting the new artists, they are not catering to the older generations’ tastes, as the
high-street stores as well as the Walmarts are only going to stock the fast moving albums
in this era of supply chain. The graph below shows the distribution of sales according to
the venue.
0%
10%
20%
30%
40%
50%
60%
70%
80%
90%
100%
2000 2001 2002 2003 2004
Concerts
TV/Newspaper/Mag
azine/800
Tape/Record Club
Internet
Record Store
Other Store
Figure 10: Sales by Venue
If the Walmarts and the high street stores stopped carrying their kind of music that
means that a majority of the markets would not carry their kind of music. If the only
place they were able to find music that they liked was online then they had cause to
switch to illegal downloads of copyrighted works.
36
http://www.npd.com/press/releases/press_030605.htm
30
34. Per Capita Real GDP:
Although we have discussed the effect of Per Capita Income in the US, we have
not discussed the effect of this factor in other countries in particular the less developed
countries below, which have been identified as priority areas by the IFPI.
0%
20%
40%
60%
80%
100%
Brazil
China
IndiaIndonesia
M
exico
Pakistan
Paraguay
Russia
Spain
Ukraine
Pirated
Legal
Figure 11: Pirated and Legitimate Sales by Country
The next thing we need to see is the real per capita income in these countries. The
graph below shows the rate of piracy along with the real per capita income of each of
these countries.
0
5
10
15
20
25
Brazil
C
hina
IndiaIndonesia
M
exicoPakistanParaguay
R
ussia
SpainU
kraine
U
SA
$Price(PPP)
0
0.001
0.002
0.003
0.004
0.005
0.006
0.007
CDPricePercentofInc
$PPP
$PPP Pirated
Percent of Disposable Inc
Figure 12: PPP Prices of CDs and Cost of CD as percent of Personal Disposable Income
31
35. I calculated the Ratio of Nominal GDP to PPP GDP and used it to arrive at PPP
values for the CD Price per unit ($PPP is the price for legitimate discs while $PPP Pirated
is the price for Pirated discs), in each of these countries. The Price per unit was found by
dividing the total value of the market by number of units sold. On the second Y-axis on
the right I have divided the nominal price of the CD in US Dollars by the Per capita
Personal Disposable income in each of these countries. The figures for CD sales and units
are from the IFPI, ‘The recording Industry 2005, Commercial Piracy Report’, while the
figures for GDP and disposable income are from the ‘Global Market Information
Database’. The exact value of the pirated units and the units sold in the US was not
available as was the Per Capita Disposable income for Paraguay. The first two give us an
idea of the actual price in these countries in relation to their market. The third graph gives
us an idea of how dear the original CD is to the citizens of that country.
Original music CDs are the most expensive in PPP terms in Paraguay, followed
by Ukraine, Brazil and Mexico. They are the cheapest in Pakistan where the price is
equal to the price of a pirated CD. Pirated CDs on the other hand are the cheapest in
Indonesia and then Pakistan which would back the IFPI report which says that Pakistan is
the origin of the majority of pirated CDs.
The third graph shows us that CDs are the dearest to the people of Ukraine, and
then to those of Indonesia, while they are of the lowest value to the people of the US.
There definitely appears to be some relationship between disposable income and
piracy. Also the Recording Industry is not helping at all. These figures include local
industry, which means that the international recording industry and the local industry
have an average CD price which is too high in most of these countries and the pirated CD
seems to fill the gap between. In Pakistan however the IFPI says, there is an excess of
CD-Rs floating around. Given this situation, it appears to be in a good position to exploit
its resources. Being a gateway to the world for the Afghan opium industry it already has a
well organised distribution network in place for illicit goods. It uses this to supply other
countries where the prices of CDs are too high for the local population.
32
36. The table below shows the same countries’ rates of piracy verses their internet
usage as well as broadband usage where available. The internet usage information was
not available for Pakistan, Paraguay and Ukraine. We do however see some sort of a
relationship between the countries that have high internet penetration and disc piracy
rates. There appears to be a negative relationship. This could be because the countries
that have low internet penetration have a lower income and therefore are unable to afford
the legal copies of media. Varian’s Latest paper37
would appear to support this
assumption. The other possibility is that the countries that have internet connections and
broadband connections in particular engage in online piracy rather than buying
counterfeit CDs. Figures for online music piracy are not included here. This could be why
this graph suggests that countries that have internet connections do not have a high rate of
disc piracy.
Rate of Piracy
Broad Band
Internet
0
20
40
60
80
100
120
Brazil
C
hina
India
Indonesia
M
exico
Pakistan
Paraguay
R
ussia
Spain
U
kraine
U
SA
Figure 13: Rates of Disc Piracy Vs Internet and Broadband Penetration
Ease of Use:
37
Varian, Hal R. (Copying and Copyright)
33
37. This is another factor that influences the use of any product. Just as the sales of
the Compact Music Cassette rocketed when Philips introduced it, and similarly CD sales
in 1983, MP3 downloads increased at a phenomenal pace because most people already
had the means to procure and play them i.e. their personal computers, an internet
connection and Winamp. When the cassettes and CDs were introduced their markets
would have taken a while to ignite. In this case all that was required was the installation
of Napster and Winamp. Apple’s iTunes has been so successful because it is laden with
Apple’s innovative design which blends style with simplicity just as it did with the iPod.
Today if one wants to download a song using iTunes, it is very simple. Simply
run the program, go to the store, find something you like and click on buy. If you have
told it not to ask for confirmations at every step, as soon as you click on buy, the
download begins and on a broad band connection the song has been downloaded and
begins to play within a few seconds. People are lazy by nature and the simpler it is for
them to get something the more they like it. One of the most comprehensive behaviour
models that attempts to explain peoples’ behaviour towards new technology is the
UTAUT.
Unified Theory of Acceptance and Use of Technology (UTAUT):
This theory models the determinants and moderators of users’ adoption of technology
(Venkatesh, Morris, Davis, & Davis, 2003). “It incorporates elements from other user
acceptance models, including the Theory of Reasoned Action, the Technology
Acceptance Model (Davis, 1989), and Social Cognitive Theory (Bandura, 1986) ”38
.
According to Venkatesh et al., the UTAUT is more effective at predicting behaviour than
the models it combines.
The theory is used to determine the degree to which an individual will adopt a
particular technology. It suggests that there are four deciding factors.
1. Performance expectancy: the degree to which an individual thinks the
technology will assist their work or play.
38
34
38. 2. Effort expectancy: the individual’s perception of how difficult the technology
will be to use.
3. Social Influence: the degree to which the social norm encourages or
discourages the use of the technology.
4. Facilitating Conditions: similar to effort expectancy but operate at a different
level.
Eric Overby, Mary Thewes, and Scott Hayward of Emory University, Atlanta put
forward a proposition to study this theory’s implications on mp3 downloads in
their paper “Finding the right mixture of industry strategies in the fight against
digital piracy” , in 2003. I was unable to find their final paper to read about the
results of their study.
Pricing Strategies:
We have already seen how the price plays an important role in the legitimacy of a
country’s media sourcing behaviour. If CD prices are too high then the there is a demand
for pirated CDs.
This situation can be solved by an online distribution model like iTunes. Apple’s
iTunes differentiates between customers on the basis of the country they are using the
internet in and also by the country that their registered credit card is from. The latter
determines which country website and which prices are available to a customer. This can
easily be used to provide cheaper music to people in poorer countries. This would
definitely help reduce piracy and at the same time the recording industry will earn some
revenue from the sale of these goods.
The Superstar Phenomenon:
“Stardom is a market device that economizes on learning costs.”39
This sentence
captures the economic essence of the Superstar Phenomenon. Music is regarded as a part
39
W. Mark Crain And Robert D. Tollison (Consumer Choice and the Popular Music Industry:
A Test of the Superstar Theory)
35
39. of the ‘visual and performing arts’, where the more you understand the subject, the better
you can appreciate a performance. Art being a composite good requires the contact as
well as discussion and digestion of related ideas. Put in economic terms, knowledge
increases the economic utility of an art and can be acquired either through direct
experience or through discussion with others. Discussion with others allows one to save
on learning costs in terms of time and energy and to consume the best without having
learned the qualities required to chose the best.
The critics of today’s information economy describe the same phenomenon as a
situation in which a relatively small number of people dominate the activity in question
earning enormous amounts of income when they are only marginally better than the next
best individual if at all. This may not even be the result of their place in the ability
hierarchy but instead an outcome of random consumer behaviour which results in an
erroneous judgement of the quality. Consumers making efficient use of consumption
decisions by others could easily generate a disproportionate aggregate demand for the
inferior product. Marshall40
pointed out in 1947 that, ‘the correspondence between
quality and remuneration was skewed in many fields of production in his day, but not in
music because of the inability to mass-produce sound’. However that changed once
digital music and now the MP3 hit the scene.
Alternative Business Models:
There is always another way, there will always be people who believe that it is a better
way.
Raymond Shih Ray Ku:
Associate Professor of Law, Director, Institute of Law, Seton Hall University School of
Law, New Jersey published a paper entitled, “The Creative Destruction of Copyright:
Napster and the New Economics of Digital Technology”. This paper questions the
function of the Media Industry in the post Napster world. It accuses them of being greedy
middlemen who exploit the artists and mislead the consumers with their market distorting
private property regime.
40
Marshall, A. (1947) Principles of Economics, MacMillan, London.
36
40. We have already discussed the function of the recording studios and found that they
perform many functions important to the industry and that a distribution network alone
can not replace them. In any partnership, there is always a dominate person and a
submissive one the only interference necessary is to make sure that the dominant one
doesn’t get carried away. In this case the media industries need to be kept under control,
and have to understand the content of papers like N Anand and Richard Peterson’s,
“When market information constitutes Fields: Sense Making in the Commercial Music
Industry”. This paper explains why the record industry needs to grow up and lead the
artists into the era of digital music explaining to them the requirements and the
boundaries of the new market instead of trying to row upstream in an Amazon river
brimming with music downloads.
SnoCap:
The legendary Shawn Fanning has started a new company which aims to give
independent artists an edge in the P2P era of distribution. “SNOCAP offers the first end-
to-end solution for digital licensing and copyright management services through an
innovative music registry and clearinghouse. SNOCAP enables record labels and
individual artists to make the full depth of their catalogues available through authorized
peer-to-peer networks and online retailers.” Although this might work for independent
artists, the recording industries may not be to keen on it.
There are a number of other such alternatives and the market will determine
which one will survive. The one that does survive has to be a compromise between what
the end users want to do with their music and what the creators are willing to let them do
with it.
Summary:
There are infinite ways in which the industry can go about this or could have gone
about it but most of the ways can be summarised by one of the three schools of thought
below.
37
41. There are those who feel that P2P sharing neutralises the hype created by the
recording studios and gives the independent artists a fair chance by allowing people to
choose the music that they like and buy it after listening to it, rather than paying to
sample it. This may be partially true, but it ignores the fact that the reason that whole
reason that the superstar effect came about is because people are too lazy to spend the
time learning about music or about all the artists available. They simply talk to their
friends and buy the recommended songs. This is quite apparent from the success of
Amazon’s peer recommendations technology. This is a normal pattern of behaviour in
our everyday lives and although there is nothing wrong with it, it can also go horribly
wrong. Coming back to the P2P networks, they allow people to circumvent the superstar
phenomenon, because thanks to supply chain, we don’t really have the choice not to
subscribe to the popular tastes. The P2P networks allowed one to be different, and an
online digital music store that preserves this choice will succeed.
Those who feel that music files should be freely tradable and that artists should
only make their money from live concerts, promotions etc. Although this is an unrealistic
view, it is fairly popular possibly because of all the bad publicity that the media
companies have got due to the way they reacted and handled the transition to digital
downloads.
38
42. Part IV: Literature Review:
I will discuss two Papers, both of which look at the effect of downloads on music
record sales. The model by Felix Oberholzer and Koleman Strumpf compares the
downloads of popular songs on a Napster server to record sales. The paper by Martin
Peitz and Patrick Waelbroeck also looks at the effect of downloads on record sales but is
a more general study taking into account factors such as GDP and percentage of the
population having certain consumer electronic goods. My own model is a derivation of
the Peitz – Waelbroeck paper mostly because of the absence of adequate free data in this
field for a regression.
In The Effect of File Sharing on Record Sales - An Empirical Analysis,
Oberholzer and Strumpf match a dataset containing 0.01 percent of the world’s
downloads to US sales data for a large number of albums. They instrument the
downloads using network congestion or song length as well as international school
holidays. They use the basic model:
Si = Xiß + γDi + μi
Here Si is record sales, while D is downloads. They assume that there are certain constant
album specific characteristics which will affect both downloads and sales such as
popularity of a particular band. In order to control for these album specific,
characteristics such as length, popularity etc, they estimated the fixed effects model:
Si = Xiß + γDi + Σωsts
+ vi + μi
Here vi is an album fixed effect, while t is time in weeks and the summation is to allow
for a flexible time effect. To control for unobserved heterogeneity, they instrument for Di
in both the above equations by substituting the value of D from this equation:
The valid instruments Zit, influence only file sharing but are uncorrelated with the second
stage errors.
Dit = Zit δ + Xiß2 + Σωsts
+ v2i + μ2i
Although Oberholzer and Strumpf use an elaborate system of controls to in order
to get unbiased results, there are many problems with his dataset.
39
43. The biggest problem with their study is that it is only over seventeen weeks. The
sales data that they obtained was weekly data for the period starting 8th
of September to
31 December 2002. This means only seventeen periods which is very low for this kind of
analysis.
Also this is not regular term time, it starts a month after the regular term time and
stretches into the Christmas vacations which would mean that downloads would have
been either lower or higher depending on whether students spent more time at their
computers or less during the winter vacations. Also the record sales would have been
affected by the Christmas shopping factor which drives up sales of almost everything.
Further he considers the fact that one out of every six downloads is from Germany. This
means that the supply is not fixed, and definitely is not endogenous (not determined by
the number of users logged in the US). Given that there are Christmas vacations in
Germany, how many of those students have broadband at home in addition to having it at
university becomes another factor.
Another factor concerns the size of the sample that he studied. His sample
represents 0.01 percent of the world’s downloaders in the US. It can not possibly
represent the characteristics of even all the universities in the US let alone the whole of
the United States.
Oberholzer and Strumpf have considered that large files have higher rates of
incomplete downloads because they get disconnected. They also state, “In our data
roughly a third of the clients use the WinMX client”. What they seem to have failed to
notice is that WinMX introduced a feature in their software in Jan 2002 which allowed
people to resume downloads. This means that one of their basic assumptions was wrong.
They had an r squared of 0.59, and concluded that file sharing has no statistically
significant impact on record sales. Due to excessive irregularities in the data I do not feel
that this study can be used to generalise any results back to the file sharing population.
40
44. This kind of study would have to be conducted with data on a few tens of thousands of
users for it to be considered as a general result.
“On-line Piracy and Recorded Music Sales”, a draft paper by David Blackburn, of
Harvard University has some interesting ideas which could explain Oberholzer and
Strumpf’s result. According to him the availability of songs on a P2P service has two
effects. The first effect is the substitution effect and the second is the one attributed to
sampling. In the case of Oberholzer and Strumpf’s these two effects possibly cancelled
each other out. This would also explain Boorstin’s results, his results pointed towards a
positive effect of file sharing on CD sales for older people and a negative effect of P2P
on the purchasing habits of younger people. This theory also works with the superstar
effect because it would mean that the young people who simply download the chart
topping hits as part of the superstar phenomenon, could get those songs more easily on
the internet than by buying the CDs. Record companies make their profits on the hit
albums every few years and use their superstars to get there. If the superstar effect moves
into a dimension that does not benefit the record companies, obviously they will make
severe losses.
The second paper that I will look at is “The Effect of Internet Piracy on CD Sales:
Cross-Section Evidence” Martin Peitz and Patrick Waelbroeck. This is a cross country
study that supports the claim that music downloading negatively affects record sales
made by the music industry. They use the following model to estimate CD sales in 16
countries over two periods 2000 and 2001:
yi,t − yi,t−1 = (xi,t − xi,t−1)′ β + α (zi,t − zi,t−1) + εi,t
Here y denotes the sales of CDs in log units in countries i = 1 to n at time t
(2001), while zi, denotes the level of piracy in each of these countries in logs. The variable
xi,t is a vector of dimension k x 1 of control variables also in log units in country i at time
t. The second expression in the model is the transpose of the kx1 matrix.
Dependant Variable:
41
45. They use data from 2000 and 2001 from IFPI because this is the period
immediately after Napster was released41
. Although we must keep in mind that the IFPI
gets the same kind of data as the RIAA, that is shipments to wholesalers and not actual
sales. This means that unsold goods that are returned will have a negative impact on the
sales figure. They obtain domestic download figures from IPSOS-REID, a market
research firm in Canada.
Explanatory Variables:
Variables for data on MP3 downloads, Broadband, and CD players were used in
level in the regressions as data for 2000 was unavailable.
1. They define MP3 downloads as the percentage of adult internet users who
downloaded music files in MP3 format from the Internet at least once.
2. The Broadband variable was defined as the number of people with home
connection in percentage of the total number of households.
3. The GDP data was in constant dollars from OECD and The Economist.
4. Music Cassette (MC) Sales, defined as the number of units of cassette sales
divided by the number of CD units sold times a hundred.
5. CD Players, defined as the number of CD players per household times a hundred.
Peitz and Waelbroeck are of the opinion that the fourth variable will capture cycle
effects due to replacement of MCs by CDs. In my opinion it actually represents the
consumers who are holding out against the CD either because they can’t afford it or
because they don’t find it convenient enough. Those from this population who have
internet connections would be prime candidates for the substitution effect, not for CDs as
Peitz and Waelbroeck figure, but instead for MP3s, a free substitute, available on demand
and of better quality in terms of sound and durability than a cassette.
41
Napster made its debut in the Fall of 1999
42
46. The last variable CD players is supposed to capture how easy it is for consumers
to copy and enjoy the product as they have found a positive correlation between CD
Players and CD Burners as well as CD Players and portable music players.
The highest significant r-squared was 0.86 obtained, when using GDP and Music
Cassette sales as the independent variables. They also got the same result when including
broadband, which had a negative coefficient. The coefficient for the internet piracy
variable was always significantly different from zero at the 5 percent significance level.
One significant problem with their paper is, although they have performed a
cross-sectional regression, they don’t seem to have tested for hetroskedasticity.
Hetroskedasticity is a very common phenomenon in cross-sectional data as the countries
(in this case), have significant differences which are not captured by the model. It must
however be noted that they have probably minimised the possibility of it by taking first
differences and taking only the top sixteen countries in the list as this also implies lower
rates of piracy and highest GDPs.
This is an interesting study and ties in well with the graphs I have plotted so far.
Although I do not have all the data which was available to them I will use their model as
a basis for my study.
43
47. Part V: Model
Overview:
As this is a paper about the economics of copyright piracy with an emphasis on
music downloads, it would have been most appropriate to do a regression involving
download statistics as this would be much more realistic and more relevant to the topic.
However due to financial limitations of this project data on downloads along with weekly
sales data was not available. This is not necessarily a problem as after reading ‘File-
Sharing Creative Destruction or just Plain Destruction’42
I was extremely sceptical about
the reliability of download estimates. I did manage to reverse engineer the Oberholzer –
Strumpf data to obtain the sales figures for the seventeen weeks they used and would
have then proceeded to estimate Boorstin’s model or a modified version of it without the
dummy variables. I came across another hurdle at this point, the US Census data on
computer and internet usage was not available for 2002.
I will estimate two models the first based on the Peitz and Waelbroeck model and
the second is an interesting relationship I found while trying to use alternate sources of
data.
Model 1:
Step I.
I will first try to estimate Peitz and Waelbroeck’s model with the data in the
appendix of their paper. Next I will estimate their model without the downloads variable,
using record sales per capita as the dependant variable and more recent record sales data
from the IFPI report “The Recording Industry in Numbers”.
Peitz and Waelbroeck’s model uses the following model. I will alter it slightly and
estimate it without transposing the ‘x’ matrix.
yi,t − yi,t−1 = (xi,t − xi,t−1)′ β + α (zi,t − zi,t−1) + εi,t
42
Liebowitz, Stan J. - File-Sharing Creative Destruction or just Plain Destruction (Mar 2005)
44
48. Step II.
While Peitz and Waelbroeck use value of sales as their criteria for deciding the
countries to be studied, I used per capita CDs bought as my criteria for countries to be
studied. This is because the prices of CDs are different in different countries. Using the
per capita consumption of CD units gives us a better idea of the level of consumption of
music in that country. Peitz and Waelbroeck used countries like Spain and Mexico in
their study, in these countries the only reason why the sales are high is because they have
a large population and the CD prices are so high. Note, Spain and Mexico are both on the
IFPI’s top ten list for Piracy. I do not think that those economies can be compared with
the other countries. It is also possible that the inclusion of these countries gives a positive
relationship with GDP. Although the two are related an increase in GDP will not bring
about a corresponding increase in music sales in all countries. It would only work in low
income countries. My method of selection is superior to theirs because I consequently
end up with countries whose consumer economies are in similar states of development. I
will use the following model for my data:
Per Capita Sales = PC Usage +Err
Data:
Data for the first estimation was taken from the appendix of Peitz and
Waelbroeck’s yet to be published paper. For the latter part of the estimation I used cross-
sectional data on record sales (the dependant variable), in each of the 16 countries from
the IFPI report, “The Recording Industry in Numbers 2005”. The data provided by them
is similar to the data used by the RIAA. It defines Music Sales as the estimate of total
legitimate retail sales inclusive of audio products (singles, LPs, MCs, CDs, SACD, DVD
Audio, MiniDisc and other) and music video products (VHS, DVD, and Video CDs).
Peitz – Waelbroeck’s data is from the 2000 and 2001 editions of the same report.
GDP data although taken from the IFPI report is originally from the IMF.
I obtained data for per capita personal computers in use and per capita internet
users from the Euromonitor website.
45
49. Variables:
This is an explanation of the variables I will use in the first model.
The dependant variable is CD sales. The explanatory variables are MP3 downloads,
broadband, GDP, Music Cassette sales and CD Players per household times a hundred.
In part II of the estimation, I use per capita CDs bought in the year 2004 to select
the countries for my estimation. Per capita units of CDs will be my dependant variable
and ‘personal computers in use’ and ‘per capita internet users’ will be my explanatory
variables independently.
Estimation and Results:
1 2 3 4 5 6 7 8
Variables coef. t-stat coef. t-stat coef. t-stat coef. t-stat coef. t-stat coef. t-stat coef. t-stat coef. t-stat
constant -18.5 -1.48 -1.80 -0.15 -1.79 -0.21 -17.34 -1.04 5.2 0.69 2.51 0.17 -8.28 -0.87 0.60 0.07
GDP 8.23 4.42 9.09 5.94 7.07 -1.49 8.2 4.15 7.79 7.74 8.96 5.59 7.26 6.4 7.84 7.69
Downloads .24 0.76 -.44 -1.24 -0.345 4.84 0.24 0.68 -.65 -2.84 -.49 -1.29 -0.32 -1.44 -0.61 -2.58
Broadband .92 2.84 .55 2.50 .94 2.79 0.49 2.15
MC sales .402 -0.21 .33 4.41 0.43 5.13 0.35 4.37
CD Players -.006 -0.11 -.02 -0.48 0.04 1.28 0.02 0.87
R2
0.61 0.77 0.87 0.62 0.91 0.77 0.88 0.92
Figure 14: Table of Results
None of the obtained results was significant at the 5 percent level of significance.
Estimating the model without the downloads however does give significant results, for
the 3rd
estimation. The r-squared is 0.84. The results are presented in the Appendix.
I first plotted a correlation table to see which the variables were most closely related with
one another. I found that the Per capita record sales had a high correlation with the per
capita number of computers in use. They had a slightly lower correlation with the per
capita internet users. There was also a correlation between the per capita computers in
use and per capita internet users. This could indicate he number of computer connected
to the internet, however that is beyond the scope of this paper.
46
50. PCD2000
PCD2001
PCD2002
PCD2003
PCD2004
pc1999
pc2000
pc2001
pc2002
pc2003
pc2004
PCD2000 1.00
PCD2001 0.93 1.00
PCD2002 0.85 0.96 1.00
PCD2003 0.77 0.94 0.96 1.00
PCD2004 0.79 0.92 0.95 0.97 1.00
pc1999 0.56 0.57 0.55 0.54 0.49 1.00
pc2000 0.58 0.61 0.60 0.56 0.51 0.97 1.00
pc2001 0.56 0.59 0.58 0.55 0.49 0.97 1.00 1.00
pc2002 0.48 0.51 0.50 0.47 0.41 0.97 0.98 0.99 1.00
pc2003 0.47 0.51 0.50 0.47 0.41 0.96 0.98 0.99 1.00 1.00
pc2004 0.47 0.51 0.50 0.47 0.41 0.96 0.97 0.98 1.00 1.00 1.00
www1999 0.35 0.30 0.27 0.26 0.19 0.64 0.55 0.56 0.55 0.52 0.51
www2000 0.36 0.24 0.19 0.18 0.13 0.62 0.53 0.54 0.54 0.51 0.49
www2001 0.24 0.17 0.13 0.14 0.05 0.67 0.55 0.57 0.59 0.57 0.56
www2002 0.22 0.16 0.13 0.16 0.06 0.69 0.57 0.59 0.63 0.61 0.60
www2003 0.17 0.12 0.09 0.13 0.03 0.68 0.54 0.57 0.62 0.60 0.59
www2004 0.14 0.10 0.09 0.13 0.03 0.66 0.53 0.55 0.60 0.59 0.58
Next I ran the regressions on STATA
for CD unit sales per capita on PCs in use per capita and internet users. There was a very
weak relationship between the number of internet users per capita and per capita CD
sales. However there was a moderately strong relationship between the number of PCs in
use and the CD sales per capita. The results for the estimations are presented below:
Figure 15: Summary of Correlations
PCD2000 PCD2001 PCD2002 PCD2003 PCD2004
Variables r2
Coef. t-stat r2
Coef. t-stat r2
Coef. t-stat r2
Coef. t-stat r2
Coef. t-stat
pc1999 .31 3.38 2.87 .33 3.1 2.98 .3 2.90 2.81 .29 2.69 2.71 .24 2.58 2.39
pc2000 .33 2.79 3 .37 2.63 3.25 .35 2.50 3.14 .32 2.25 2.89 .26 2.14 2.5
pc2001 .35 2.47 3.12 .33 2.33 2.98 .30 2.12 2.79 .23 1.98 2.37
pc2002 .25 1.82 2.45 .22 1.64 2.27 .16 1.5 1.92
pc2003 .22 1.57 2.26 .17 1.44 1.9
pc2004 .17 1.44 1.91
www1999 .12 2.4 1.6 .09 1.8 1.31 .07 1.58 1.18 .07 1.48 1.15 .04 1.12 .43
www2000 .13 2.59 1.62 .06 1.55 1.04 .04 1.19 .81 .03 1.08 0.78 .02 .80 .55
www2001 .03 1.13 0.71 .02 .87 .57 .02 .87 .6 .003 .36 .23
www2002 .02 .81 .57 .03 .92 .68 .00 .38 .27
www2003 .02 .78 .56 .00 .16 .11
www2004 .00 .177 .12
Figure 16: Summary of Regression Results
47
51. Results:
All of these results were significant at the 5 percent level. The highest r-squared
value was obtained for the per capita CD units bought in 2001 when regressed on the per
capita number of computers in use in 2000. These results suggest a positive relationship
between the number of computers in use per capita and the number of CDs purchased per
capita. This could be a demonstration of the dual effects that Blackburn suggests in his
research. If the number of CDs purchased increases when a person has access to a
computer, this could be due to online sales, websites, or due to sampling.
Note: Of those computers that are being used we don’t know how many have
internet access. Also when I tried a multivariable regression using PCs in use and internet
usage per capita, then I didn’t get significant results.
Model 2:
The second model I estimate is an investigation of the relationship between per
capita recreation expenditure on internet service providers and average hourly earnings of
musical groups & artists in the United States. I use the following model in my estimation:
Inc = PCE Internet + Napster
Here, Inc is the variable representing average hourly earnings of musical groups & artists
in the United States, PCE Internet is Per Capita Recreational Expenditure on Internet
service providers and Napster is a dummy variable that has the value of one for the
months that the Napster servers were up and running.
Data:
Monthly data on per capita recreation expenditure on internet service providers
and average hourly earnings of musical groups & artists in the United States was obtained
from Datastream43
from January 1990 until July 2005.
43
Source: Datastream, Thompson Financial.
48
52. The years that Napster was running were referred from Wikipedia.org.
Results:
The r-squared obtained was very high at 0.81 and was significant at the 5 percent
level of significance.44
In order to better interpret the results, I converted the first two
quantitative variables into logs.
On re-estimating the model I got the following result:
Lminc = 1.96 + 0.1 lPCERec + -0.11Napster
(.0432) (.0055) (.0273)
The r-squared was lower at 0.64, however the log linear model makes it possible for me
to conclude that a 1 percent increase in Per Capita Recreational Expenditure on internet
leads to a 0.1 percent increase in the average hourly earnings of artists and musical
groups in the United States. The coefficient on the Napster variable means that during the
time that Napster was active, the artists and music groups in the United States lost about
11 percent of their income. These results are significant at the 5 percent level of
significance.
44
The regression output can be viewed in the appendix.
49
53. Part VI: Conclusion
When I started this dissertation I believed in the ideas of Professor Raymond Ku.
I believed that the internet was a new distribution medium that made the Recording
Industries redundant. After my research my opinion has changed completely and I now
believe that the Recording Industries do serve a purpose. Those who accuse them of
cheating the artists need to remember that there is no such thing as a free ride and this
applies to everything in life.
From the first model I analysed it is clear that there is a positive effect of
computers on the sales figures, this could be because people find out about new music or
buy music to play it on their computers. There is a very weak positive effect of the
internet on music sales. Both of these results were highest for the sales in 2001 on
penetration of computers and internet in 2000. (A more robust model will lend a stronger
argument)
From the second model I estimated, it is clear that Napster had a negative effect
on the wages of artists and musical groups in the US. We must keep in mind that these
are not just the superstars but the average musicians that we are talking about. (Although
at the same time the superstar’s incomes will be included in these figures increasing the
average figure). Although the result supports the theory, more relevant data will better
support the argument.
A look at the BPI figures on sales by media in Appendix 3 Figure 17: BPI
Statistical Handbook 2005” on page 60, shows that although CD sales had a few hiccups
in the Napster period, the average trend is still increasing. This CD Sales have been
affected but not that much. Also there may be a net positive effect when the negative
effect is reduced by Civil Lawsuits. As this data came in just before submission I haven’t
had time to check the dates, but it would be interesting to see if the dates that the sales got
back on track in the UK coincide with the filing of any law suits by the RIAA, BPI or
IFPI.
50
54. Figure 18 on page 61 shows the Per capita purchases of CD units, internet and PC
penetration for the world’s twenty highest per capita consumers of music CDs. It appears
that with the exception of Switzerland, all the other countries that had a high
consumption of music CDs and internet penetration have suffered losses in the sales. This
could mean that those countries that had a high consumption of music and internet, were
faster adopters of new technologies, possibly because of the internet. The remaining
countries have still not embraced the MP3.
I conclude that MP3 downloading is rampant in areas where there is high internet
density. This downloading has substituted record sales and since those countries were
high purchasers of music a small change in per capita consumption will have a big impact
on overall record sales. The remainder of the world had still not made the switch to
digital downloads and there is scope for expanding the consumer base in these countries
perhaps with cheaper downloads displacing the pirates.
51
55. References:
Alvisi, Matteo and Elena Argentesi (2003) “Piracy and Quality Choice in Monopolistic
Markets”, German Working Papers in Law and Economics Volume 2003
Alvisi, Matteo, Elena Argentesi and Emanuela Carbonara (2002) “Piracy and Quality
Choice in Monopolistic Markets”, JEL Classification Numbers: L12, L15, L82, L86.
Anand, N and Richard A. Peterson (2000) “When Market Information Constitutes Fields:
Bach, David (2004) “The Double Punch of Law and Technology: Fighting Music Piracy
or Remaking Copyright in a Digital Age?”, Volume 6, Issue 2 2004 Article 3
Business and Politics, The Berkeley Electronic Press.
Belleflamme, Paul and Pierre M. Picard (2004) “Piracy And Competition”,CESIFO
Working Paper No. 1350 Category 9: Industrial Organisation
Blackburn, David (2004) “On-line Piracy and Recorded Music Sales”, unpublished.
Available at: “http://www.economics.harvard.edu/%7Edblackbu/papers.html”
Boorstin, Eric S. (unknown) “Music Sales in the Age of File Sharing”, unpublished
Princeton University
Caldas, Charles (date unknown) “The Evolution of the Music Industry Model Bad
Behaviour, Destroying Deals and Exploiting Talent. Not Much Has Changed”,
themusic.com.au “http://www.themusic.com.au/im_m/archive/2005/050712-
463_guests.php”
Christian, Jason E. (1994) “Endogenous Process Innovation under Piracy and
Multinational Enterprise”, unpublished
Chung, Kee H. and Raymond A K Cox (1994) “A Stochasitc Model of Superstardom: An
Application of the Yule Distribution”, The Review of Economics and Statistics, Vol.
76, No. 4 (Nov.,1994), 771-775
Cooper, Jon and Daniel M Harrison (2001) “The social organization of audio piracy on
the Internet”, Media, Culture & Society, SAGE Publications (London, Thousand
Oaks and New Delhi)
Coover, James (1985) “Music Publishing Copyright and Piracy in Victorian England”,
Mansel Publishing Limited (London, UK)
Crain, W. Mark and Robert D. Tollison (2002) “Consumer Choice and the Popular Music
Industry: A Test of the Superstar Theory”, Empirica 29: 1–9, 2002.
Digital Media Project team (2005) “Content and Control: Assessing the Impact of Policy
Choices on Potential Online Business Models in the Music and Film Industries”,
Harvard Law School (Cambridge, USA)
Doctorow, Cory (2004) “Digital Rights Management”, ChangeThis
http://changethis.com/4.DRM
Dougherty, Christopher (2002) “Introduction to Econometrics”, Oxgford University Press
(New York, USA)
Dynamic Sun (2005). “Our Process” http://www.dynamicsun.com/ourprocess/
ECONOMIC CITIZENSHIP a key stage 4 teacher resource.(unknown date) Report
Published by Institute for Citizenship, London. ISBN: 1-902482-14-X
Girma, Sourafel and Anja Shortland (2005) “The Political Economy Of Financial
Liberalisation”, Working Paper No. 05/12 May 2005
52