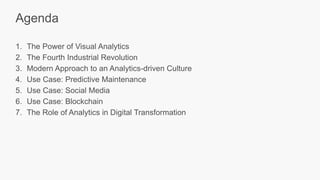
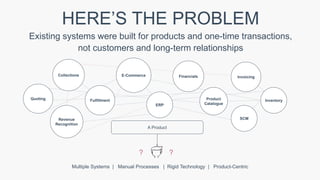
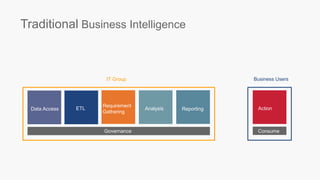
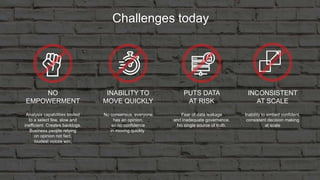
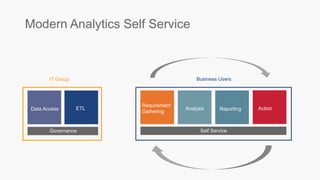
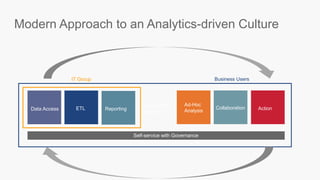
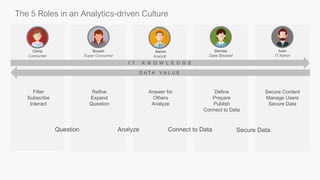
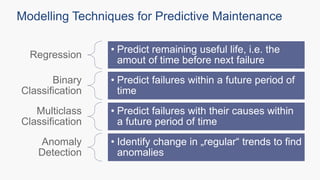
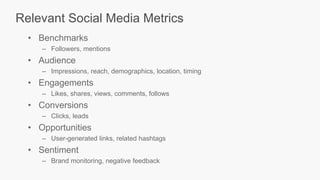
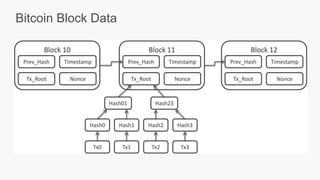
Digital Transformation:
How to Build an Analytics-Driven Culture
Alexander Loth, Digital Strategist
@xlth
Executive Talk
Frankfurt School of Finance & Management
8 December 2017
2009
2017
We help people see and understand dataWe help see and understand datapeople
Digital Transformation:
How to Build an Analytics-Driven Culture
Alexander Loth, Digital Strategist
@xlth
Executive Talk
Frankfurt School of Finance & Management
8 December 2017
1. The Power of Visual Analytics
2. The Fourth Industrial Revolution
3. Modern Approach to an Analytics-driven Culture
4. Use Case: Predictive Maintenance
5. Use Case: Social Media
6. Use Case: Blockchain
7. The Role of Analytics in Digital Transformation
Agenda
The Power of Visual Analytics
old school
old school
Supercharge your employees by supporting their creativity and curiosity
with facts
The Fourth Industrial Revolution
Exploding Data Growth
4.4
ZETABYTES
44
ZETABYTES
180
ZETABYTES
2013 2020 2025
Source: IDG
“The world’s most valuable resource
is no longer oil, but data”
Source: http://www.economist.com/news/leaders/21721656-data-economy-demands-new-approach-antitrust-rules-worlds-most-valuable-resource
May 6, 2017
When did data become so complicated?
Branch
Banking
Web
Banking
Mobile
Banking
Context
Banking
Increased data centricity
HERE’S THE PROBLEM
Existing systems were built for products and one-time transactions,
not customers and long-term relationships
Multiple Systems | Manual Processes | Rigid Technology | Product-Centric
A Product
? ?
Quoting Fulfillment
E-Commerce
Revenue
Recognition
Financials
ERP
SCM
InventoryProduct
Catalogue
Collections Invoicing
Modern Approach to an Analytics-
driven Culture
IT Group Business Users
ReportingData Access ETL
Requirement
Gathering
Analysis
Traditional Business Intelligence
Governance Consume
Action
NO
EMPOWERMENT
Challenges today
INABILITY TO
MOVE QUICKLY
PUTS DATA
AT RISK
INCONSISTENT
AT SCALE
Analysis capabilities limited
to a select few, slow and
inefficient. Creates backlogs.
Business people relying
on opinion not fact,
loudest voices win.
No consensus, everyone
has an opinion,
so no confidence
in moving quickly
Fear of data leakage
and inadequate governance.
No single source of truth.
Inability to embed confident,
consistent decision making
at scale
Modern Analytics Self Service
Governance Self Service
Requirement
Gathering
ReportingData Access ETL
Requirement
Gathering
Analysis Action
IT Group Business Users
True analytic leadership requires an ability to empower
users to be autonomous without creating a state of disorder.
Two Different Platforms
Governance Self-Service
Needs of IT
Protect data assets
Needs of Business
Generate value from data assets
Traditionally a Tradeoff
Ad-Hoc
AnalysisReporting Collaboration
Modern Approach to an Analytics-driven Culture
Self-service with Governance
Requirement
Gathering
Data Access ETL Action
IT Group Business Users
The 5 Roles in an Analytics-driven Culture
Aaron
Analyst
Ivan
IT Admin
Chris
Consumer
Denise
Data Steward
Susan
Super Consumer
Filter
Subscribe
Interact
Question
Refine
Expand
Question
Analyze
Answer for
Others
Analyze
Connect to Data
Define
Prepare
Publish
Connect to Data
Secure Data
Secure Content
Manage Users
Secure Data
I T K N O W L E D G E
D A T A V A L U E
Use Case: Predictive Maintenance
Modelling Techniques for Predictive Maintenance
Regression
• Predict remaining useful life, i.e. the
amout of time before next failure
Binary
Classification
• Predict failures within a future period of
time
Multiclass
Classification
• Predict failures with their causes within
a future period of time
Anomaly
Detection
• Identify change in „regular“ trends to find
anomalies
Demo
http://alexloth.com/2016/10/30/predictive-maintenance-hilft-ihnen-
wartungsmasnahmen-effizient-zu-gestalten/
Deutsche Bahn, presenting at CeBIT 2017, https://twitter.com/xlth/status/845279463483068417
13 December 2017: DB Skydeck, Silberturm, Jürgen-Ponto-Platz, Frankfurt
Sign up: http://bit.ly/tab-ffm
Use Case: Social Media
Who is on
Social Media?
That means you
are the data!
The Customer-centric Social Media Strategy
Relevant Social Media Metrics
• Benchmarks
– Followers, mentions
• Audience
– Impressions, reach, demographics, location, timing
• Engagements
– Likes, shares, views, comments, follows
• Conversions
– Clicks, leads
• Opportunities
– User-generated links, related hashtags
• Sentiment
– Brand monitoring, negative feedback
Demo
http://alexloth.com/2016/08/01/7-fragen-die-unternehmen-helfen-ihr-ergebnis-
mit-social-media-zu-steigern/
Use Case: Blockchain
Bitcoin Block Data
Demo
http://alexloth.com/2017/01/31/price-sentiment-
analysis-bitcoin-going/
Quinten Miller, Deutsche Bank, presenting at „Future of Enterprise Analytics“, https://twitter.com/xlth/status/938435474347233283
The Role of Analytics in Digital
Transformation
Analytics is Key to Digital Transformation
People Process
Technology
01000100
01000001
01010100
01000001
Analytics
Software should be
designed for deeper thinking
This is not a
Technology Problem
People who know the data
should ask the questions
Marketing
FinanceSales
IT
Product Operations
The new rule for an
analytics-driven culture:
Wrap your analytics around
your customers
to create business value
An analytics-driven culture applies to every
stage of a decision
Report
Awareness
ContextPrediction
Decision
Support and Amplify your
Company’s Anayltics-driven
Culture
Digital Transformation:
How to Build an Analytics-Driven Culture
Alexander Loth, Digital Strategist
@xlth
Executive Talk
Frankfurt School of Finance & Management
8 December 2017

Digital Transformation: How to Build an Analytics-Driven Culture

Editor's Notes

  • #2 - Good Afternoon! It‘s my pleasure to give you a more detailed overview for the modern analytics Platform Tableau! My name is Alexander Loth and working for Tableau since almost 3 years! Before joining Tableau, I was working in Switzerland… …not in Zurich! …but in Genava!
  • #3 I spent four years working at CERN, the European Organisation for Nuclear Research! CERN hosts several Petabyte of data! Huge part of my time, I was writing scripts to process and analyze this data. Writing Python and GNU Plot scripts that run in a batch environment was my daily business. The plots, of course, were not interactive and did not refresh automatically! Then I discovered Tableau and was immedatly falling in love! Tableau saved me hours of time, and the graphs were interactive and connected directly to our Hadoop appliances and the Oracle Real Application Cluster!
  • #4 Well, Analytics could look as scientific as this…
  • #5 Well, Analytics could look as scientific as this…
  • #6 To kick things off – lets start with what it is the vision statement that has been driving Tableau since our start back in 2003 – and in all its simplicity then it is to help people see and understand data. We look at this mission statement regularly and I have had the fun of challenging my teams on what it is that was most important in that statement. Now – could be data – I mean – you can hardly discuss that without data there would be no Tableau. But that is too obvious. So what about “seeing” – we have been very vocal about the power of using our brains strength in digesting enormous amounts of complex data by using visualisations. So is that it? Or rather understanding? Well – none of these answers are necessarily wrong but to me the most important part is …….click……..People – so all of us here in the room. We actually think people are the single most important thing to focus on when talking Business Intelligence. And why do we think so? ……………….click…………………
  • #7 - Good Afternoon! It‘s my pleasure to give you a more detailed overview for the modern analytics Platform Tableau! My name is Alexander Loth and working for Tableau since almost 3 years! Before joining Tableau, I was working in Switzerland… …not in Zurich! …but in Genava!
  • #10 I like to start these sessions off with a game I call “count the nines.” So, count the nines. Raise your hand when you think you know how many nines there are on here. [pause] In fact, just go ahead and shout it out. If you know how many nines are on here, shout out the answer. [pause]
  • #11 NOW count the nines. How many nines do you see? Raise your hand when you know. (There are 10 nines) It’s amazing how much easier it is to find and see the nines as soon as they’re picked out in red.
  • #12 Which product subcategory is the most unprofitable?
  • #13 Now … which product subcategory is the most unprofitable? You can instantaneously see that Tables for the Home Office customer segment are the least profitable. In this instance, there are visual analysis cues that supported human’s nature perception triggers – in this case, both color and size comparison. While the previous data set helped us hone in on the important numbers through color, in this case, we aren’t being asked to do any number comparisons – and remember, numbers are actually very complex and largely theoretical, in this instance we are able to visually perceive insights without having to do any numerical comparison or in-depth processing. The comparisons we are doing are around the relative length of the bars in the chart, the color differences. And as with the math problem, when we’re given the right tools, our ability to get to the “answer” in this case –the analysis – is much, much faster. In fact, I’m sure for most of you, the answer to which product category is the most unprofitable you’ve already moved on to thoughts like, wow, office machines for the corporate segment are doing really well! Or, technology is by far our most profitable product category regardless of customer segment.
  • #14 People are smart- people are creative We believe data only becomes valuable when it is in the hands of the people who know the business. The people I meet who work with data are smart, curious, creative. Millions of dollars each year are spend hiring them, training them, keeping them happy, and productive. If these people get empowered with data – then we can move our organizations ahead. And talking about data – Let me start with a really powerful example.
  • #15 This: one of my favourites. South China Morning Post Simon Scarr Multi-award winning Shows deaths from start to beginning end US soldiers in Iraq Each bar = deaths per month, 2003-2011 (beginning of withdrawal)
  • #16 Objective: to portray the heavy cost of life in Iraq in this period How? What do you see?
  • #17 let’s look at visual design choices. Bar down. Colour red. Evocative title. GESTURE: you see blood smearing down the screen
  • #18 Incredibly powerful. PAUSE TEASE: can we transform the viz and therefore change the message? Let’s see. Bars. Colour. Now I see decline Change title. PAUSE
  • #19 Isn’t this incredible. Using visual attributes I CHANGED THE POINT OF VIEW. NOT DECEPTIVELY
  • #20 convey completely different messages same data, same chart, even. power we wield when share our visualisations: we can change people’s point of view. can use the features of data visualisation as an expressive language. Pause MORE.
  • #21 Why Is this important?
  • #23 The World Economic Forum says start of the 4th industrial revolution. YOU the drivers Journey and Destination
  • #24  It’s no longer a topic of debate how important data is to the modern enterprise. The sheer volume of data that you and other organizations are spending millions of dollars to capture, store and organize is growing at a staggering rate. In this age of data, all of a sudden, all companies are data companies. So no doubt there is a lot of data out there – but why actually bother? To answer that question “The Economist” recently released an article …………………….click………………..
  • #25 In the article “The Economist” stated that the value locked in the data now outshines the value of the worlds oil. Not difficult to understand why CEO’s are having Data Analytics front and center – I mean – they have the data – it is just about finding ways in which data can be used as a competitive differentiator But how are Enterprises actually going about this high value asset? And why are they doing the way they are?
  • #26 Wenn wir ein Blick auf die Banken werfen, sieht man schnell warum Daten so kompliziert werden. Wir haben Daten aus den Filialen, aus dem Online-Banking, Mobile-Banking und kontextbezogenem Banking
  • #27 Und hier ist das Problem mit den vielen Daten: Exisiterende Systeme sind oft ungeeignet widerkehrende Transaktionen und übergreifende Beziehungen darzustellen. Stellen Sie sich vor Sie haben 44 Systeme, keine zentrale Sicht auf die Daten. Ein komplettes Chaos! --- HERE’S THE PROBLEM with all the data Existing systems weren’t built to manage recurring transactions and relationships; this is the cause of chaos, pain and headaches all over your organization Now You have 44 different systems. No single view. Complete Chaos. “We want our systems to tell us ___________, but they cant” “We want our systems to do __________” WE WANT TO DO all these things but we can’t: 17 different systems can’t piece things together even with your CRM stuck in the middle of an upgrade costs spiraling out of control takes 6 months Whether you have 1 ERP system or a bunch of point solutoins No single customer view Operational inefficiencies Inhibits innovation Can’t support recurring revenues Compliance risks Lack of scalability Poor user experience
  • #29 Historically BI solutions has been driven by IT – simply because BI products back then were made for IT so they could program answers to the questions that Business Users had. The upside to this was that IT was in control. And as IT has Governance running deep in its DNA, then the way these BI Products got implemented were very much aligned with best practices around Governance. Only this approach comes at a cost. The way these traditional BI products work is that answering a question from business will kick off a small IT project with gathering requirements and kick off some waterfall based programming. That takes time and the amount of question that can be answered are limited by the programming capacity – and the time to get an answer is typically measured in weeks or even months. Strangely enough not all Business Leaders found that very satisfying and that lead to this other situation that we have seen over recent years ……. (klick)
  • #30 There’s been different approaches to try and extract value and insight from data, especially at scale. Traditional BI took a specific approach, and gave a subset of people the tools and access to explore data. This approach left the business relying on report generators for insight, but this proved to be costly, inefficient, and cumbersome.    Tableau takes a different approach. To understand our approach, it’s important to first understand our foundational beliefs. 
  • #31 And that situation is that Business has taken over and started Self Service Projects on their own – Shadow BI departments starting outside the IT departments - and boy – was that a great experience for business to get so much faster answers to their questions – minutes and seconds instead of months or weeks. But when you look at the picture – then it also obvious that cutting the IT Group out is not ideal – they have deep knowledge around Data Access and Data Management processes so not to leverage these skills is simply not effective. And while nobody would ever intend it then Governance could be compromised in a free wheeling Self Service environment. Which is why we think that the Modern Approach to Enterprise Analytics looks like this ……………….click…………….
  • #32 Historically, you had to choose between governance OR self service – a compromise – and governance would take precedence So how do you enable this new shift to self-service while still satisfying the need for security? This shift is what Garter – the leading industry analyst firm – is focusing their Global theme for 2016 – Empowerment without Anarchy. Tableau allows your entire company to have self-service at scale. Governance is good for the self-service. (business users feel safe to explore and analyze thanks to the governance setup by IT)
  • #33 In the new definition of the market, the evaluation was split into two separate reports. The Magic quadrant for BI and Analytics now asses vendors based on a more “modern” evaluation of these platforms and second report called The market guide for enterprise reporting based platforms which covers the traditional BI platforms. This means that products like Oracle Business Intelligences Enterprise Edition, Business Object, Crystal Reports, and Cognos are no longer considered in the magic quadrant but are evaluated in the enterprise-reporting platform repot. This table helps illustrate how the each of the platforms are now defined. The difference between Enterprise reporting vs modern BI is Upfront modeling required vs not required IT produced vs IT enabled Developed by IT vs authored by the business Structured reporting vs free form exploration Scheduled distribution vs sharing and collaboration The main theme here is that in a Modern platform, the dynamic between IT and the business, a dynamic where the business sends a request, and IT produces a report are going away. In the modern platform, both IT and the business are more deeply engaged in the entire analytic process. Let’s look at a high level view of how the analytic process typically plays to help put this in context. According to Gartner's “How to Modernize Your Business Intelligence and Analytics Platform for Agility, Without Chaos” self-service and analytics and governance must find a way to co-exist and Business Intelligence and Analytics leaders need to start thinking about how they will transition to a easy-to-use, fast and agile modern platforms. Before we talk about what the modern platform looks like and how to transition there, I want to first look at where organizations are today
  • #35 A modern approach to BI must be able to BOTH enable self service for business users WHILE making sure that this can happen in a governed manner. We have over recent years had a lot of quality input from our customer on what they would like to see not just of new business user feature but as important of new Governance features to satisfy the IT Groups justified demands. And we have taken that input and build it into what now is the Tableau Platform. And lets doubleclick on the Tableau Platform to see what it is …..click…….
  • #36 Let’s evaluate the 5 roles in Modern Enterprise Analytics/BI The landscape is evolving to far more than producers to consumers. click  click The roles blend across each other.
  • #45 Who else is on Twitter? Lift your hand! Keep your hands up! Who of you is on LinkedIn? Keep your hands up! Xing? Facebook? Instagram?
  • #46 Data that we will analyse today Data is accessible Powerful and easy
  • #47 My name is Alexander Loth, and I‘m also on Twitter.
  • #48 Apple has officially joined Instagram on 7th August 2017. The numbers are just from one day later. And I am not showing that for fun. Apple is the most valuable company in the world because the apply a customer-centric data strategy and culture! And there are plenty take-aways for every business: Wrap your data around your customers, in order to create business value Interact with your customer in a natural way Understand your customer and customer behaviour better by analyzing social media data And how do we get every employee to empathize with our customers – put their needs first?
  • #49 Financial Revenue Sheet vs. Retweets
  • #50 benchmark von kanälen, wie häufig sharen prospects zu customer, was sagen diese im Unterschied, social roi Choose your top 3 KPIs - can't be too much for one dashboard!
  • #55 One of the most disruptive Technologies!!
  • #60 Today every industry is talking about Digital Transformation and affected by technologies like the Internet of Things, Blockchain, Microservices and Cloud. Every company like Apple, Nike, and Nestle, better known for their brand products have now become Technology Company. However, for every technology the powerhouse behind the success is Analytics. However, for every technology the powerhouse behind the success is Analytics.
  • #61 Software should be designed for deeper thinking. In fact software should do the heavy lifting for you, not ask you even more questions.
  • #62 Let‘s have a look on various software components! There is plenty available! But don‘t get it wrong!
  • #63 This is not a Technology Problem! 8 years ago we applied a huge Hadoop Cluster at CERN, it‘s the second biggest in the world! The only bigger one is installed at Facebook. That means the technology is already there!
  • #64 It’s all about the people! And the Analytics-Driven Culture! People who know the data should ask the questions. Get the tools in the hands of those with the context, questions and greatest need!
  • #65 THE NEW RULE FOR a data-centric strategy and CULTRE Wrap your data around your customers, in order to create business value These CEOs are trying to build a subscription culture; become a subscriber-centric company; Make sure subscriptions part of their Thinking about how how do we change finance, IT, culture, enable this new formula for growth? How do we get every employee to empathize with our customers – put their needs first? How do we turn vision into reality and place subscribers in the center of our operating model?? NOW WE HAVE CAREY BUTLER CTO OF SEATTLE TIMES, UNIQUE ROLE THAT CAN TALK ABOUT A LOT OF THESE THINGS – DELIVERING AGILITY, BUILDING A SUBSCRIPTION CULTURE
  • #66 Dabei spielt Analytics in jedem Schritt vom Report bis zur Entscheidung eine Rolle.
  • #67 Analytics at scale can drive change. Data is one of the greatest assets. don’t know – advantage Your customer’s organizations need to change to harness the potential of their data. Not one dashboard, everybode - changing processes , relationships , yes, even the power structure Analytics, and the quest for facts can rapidly drive that change.
  • #69 - Good Afternoon! It‘s my pleasure to give you a more detailed overview for the modern analytics Platform Tableau! My name is Alexander Loth and working for Tableau since almost 3 years! Before joining Tableau, I was working in Switzerland… …not in Zurich! …but in Genava!