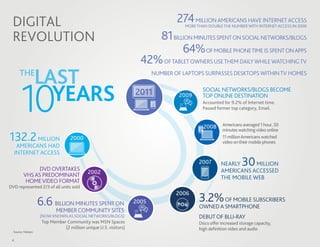
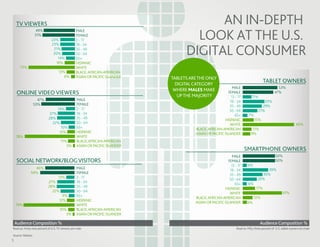
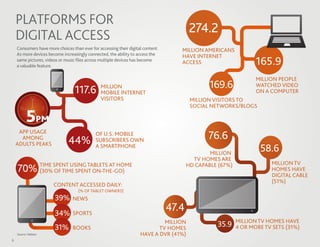
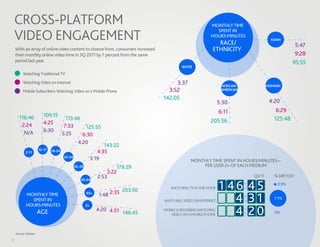
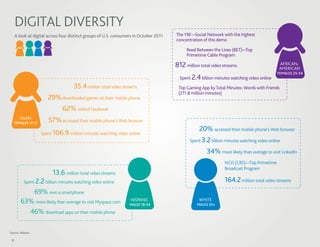
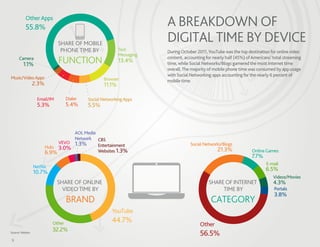
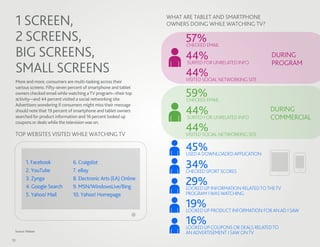
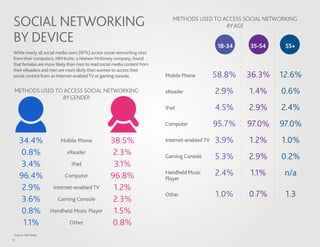
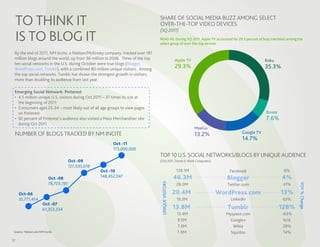
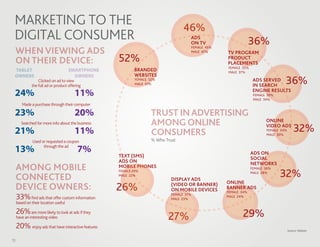
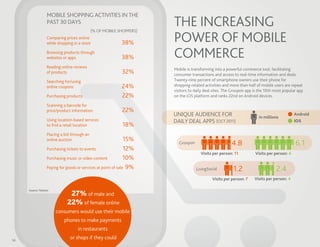
SlideShare a Scribd company logo
1 of 20
Download to read offline
The Digital Revolution:
A Look Through the Marketer’s Lens
April 2012


STATE OF THE MEDIA: U.S. Digital Consumer Report Q3-Q4, 2011
Contents
    EXECUTIVE SUMMARY	                                 3

    DIGITAL REVOLUTION	                                4

    AN IN-DEPTH LOOK AT THE U.S. DIGITAL CONSUMER	     5

    PLATFORMS FOR DIGITAL ACCESS	                      6

    CROSS-PLATFORM VIDEO ENGAGEMENT	                    7

    DIGITAL DIVERSITY	                                 8

    A BREAKDOWN OF DIGITAL TIME BY DEVICE	             9

    1 SCREEN, 2 SCREENS, BIG SCREENS, SMALL SCREENS	   10

    SOCIAL NETWORKING BY DEVICE	                       11

    TO THINK IT IS TO BLOG IT	                         12

    MARKETING TO THE DIGITAL CONSUMER	                 13

    THE INCREASING POWER OF MOBILE COMMERCE	           14

    THE IN-HOME STREAMING EXPERIENCE	                  15

    DAILY VIDEO VIEWING AROUND THE WORLD	              16

    THE GLOBAL ONLINE PERSPECTIVE	                     17

    SOURCES	18


2
EXECUTIVE SUMMARY
    Over the past ten years, the digital revolution has accelerated at an eye-opening pace. There are more platform choices than ever before, and Americans are consuming
    more content on more devices—often simultaneously. 274 million Americans now have Internet access—more than double the number with Internet access in 2000.
    Consumers have developed an insatiable appetite for social content, spending 81 billion minutes interacting with social networks and blogs in 2011. Apps have become
    all the rage, consuming 64 percent of consumers’ time on mobile devices. And multi-tasking has been taken to new levels, with 42 percent of tablet owners using them
    daily while watching television.

    With so many device choices and increased consumption levels, marketers and advertisers alike are faced with more complex decisions when it comes to maximizing
    their sales and advertising ROI. Determining the devices consumers are using, how receptive they are to ads, types of ads that resonate, and trust in advertising among
    online consumers are top of mind questions for today’s marketers. This report takes an in-depth look at the U.S. digital consumer and aims to answer the relevant
    questions marketers and advertisers need to know in order to succeed in today’s complex digital world.


3
DIGITAL                                                                         274 MILLION AMERICANS HAVE INTERNET ACCESS
                                                                                    MORE THAN DOUBLE THE NUMBER WITH INTERNET ACCESS IN 2000


 REVOLUTION                                                            81 BILLION MINUTES SPENT ON SOCIAL NETWORKS/BLOGS
                                                                               64%OF MOBILE PHONE TIME IS SPENT ON APPS
                                                                    42% OF TABLET OWNERS USE THEM DAILY WHILE WATCHING TV
      THE
                    LAST                                                 NUMBER OF LAPTOPS SURPASSES DESKTOPS WITHIN TV HOMES


       10                 YEARS                                   2011            2009
                                                                                            SOCIAL NETWORKS/BLOGS BECOME
                                                                                            TOP ONLINE DESTINATION
                                                                                            Accounted for 9.2% of Internet time.
                                                                                            Passed former top category, Email.


                                                                                            2008      Americans averaged 1 hour, 50
                                                                                                      minutes watching video online
132.2 MILLION                      2000                                                               11 million Americans watched
                                                                                                      video on their mobile phones
      AMERICANS HAD
     INTERNET ACCESS

               DVD OVERTAKES
                                                                                          2007       NEARLY      30
                                                                                                                 MILLION
                                            2002                                                     AMERICANS ACCESSED
         VHS AS PREDOMINANT                                                                          THE MOBILE WEB
          HOME VIDEO FORMAT
DVD represented 2/3 of all units sold
                                                                                 2006
                    6.6 BILLION MINUTES SPENT ON                  2005                    3.2% OF MOBILE SUBSCRIBERS
                                                                                          OWNED A SMARTPHONE
                            MEMBER COMMUNITY SITES
                    (NOW KNOWN AS SOCIAL NETWORKS/BLOGS)                                  DEBUT OF BLU-RAY
                     Top Member Community was MSN Spaces                                  Discs offer increased storage capacity,
                               (2 million unique U.S. visitors)                           high definition video and audio
  Source: Nielsen

 4
TV VIEWERS                                                                             AN IN-DEPTH
                                                                                       LOOK AT THE U.S.
                  49%                             MALE
                  51%                             FEMALE
                               23%                2 - 17


                                                                                     DIGITAL CONSUMER
                               23%                18 - 34
                                21%               35 - 49
                                20%               50 - 64
                                  14%             65+
                                 16%              HISPANIC
      73%                                         WHITE
                                    13%           BLACK, AFRICAN-AMERICAN
                                       6%         ASIAN OR PACIFIC ISLANDER    TABLETS ARE THE ONLY
                                                                                 DIGITAL CATEGORY
                                                                                                                                        TABLET OWNERS
                                                                                                                MALE                               53%
                                                                                WHERE MALES MAKE
     ONLINE VIDEO VIEWERS                                                         UP THE MAJORITY
                                                                                                             FEMALE                              47%
                                                                                                               13 - 17         11%
                    47%                            MALE                                                       18 - 34                  33%
                  53%                              FEMALE                                                     35 - 49                 29%
                                 14%               2 - 17                                                     50 - 64               21%
                             27%                   18 - 34                                                       65+        7%
                            28%                    35 - 49                                                 HISPANIC              15%
                               22%                 50 - 64                                                    WHITE                                                60%
                                   10%             65+                                   BLACK, AFRICAN-AMERICAN               11%
                                  12%              HISPANIC                              ASIAN OR PACIFIC ISLANDER            9%
    78%                                            WHITE
                                      11%          BLACK, AFRICAN-AMERICAN
                                         3%        ASIAN OR PACIFIC ISLANDER
                                                                                                                         SMARTPHONE OWNERS
                                                                                                                MALE                              50%
    SOCIAL NETWORK/BLOG VISITORS                                                                             FEMALE                               50%
                                                                                                               13 - 17      6%
                46%                                MALE                                                                                  39%
                                                                                                              18 - 34
              54%                                  FEMALE                                                                             30%
                                                                                                              35 - 49
                                 13%               2 - 17                                                                           20%
                                                                                                              50 - 64
                            27%                    18 - 34                                                                  6%
                                                                                                                 65+
                            28%                    35 - 49                                                                        17%
                                                                                                           HISPANIC
                              22%                  50 - 64                                                                                              61%
                                                                                                              WHITE
                                    9%             65+                                                                           12%
                                                                                         BLACK, AFRICAN-AMERICAN
                                  12%              HISPANIC
                                                                                         ASIAN OR PACIFIC ISLANDER         6%
    79%                                            WHITE
                                     10%           BLACK, AFRICAN-AMERICAN
                                        3%         ASIAN OR PACIFIC ISLANDER

    Audience Composition %                                                                                                           Audience Composition %
Read as: Forty-nine percent of U.S. TV viewers are male                                                            Read as: Fifty-three percent of U.S. tablet owners are male

Source: Nielsen
5
PLATFORMS FOR
                                                                                         274.2
    DIGITAL ACCESS
    Consumers have more choices than ever for accessing their digital content.      MILLION AMERICANS
    As more devices become increasingly connected, the ability to access the        HAVE INTERNET
    same pictures, videos or music files across multiple devices has become
    a valuable feature.
                                                                                    ACCESS                        165.9
                                                                                                                  MILLION PEOPLE

                                  117.6        MILLION                                          169.6             WATCHED VIDEO
                                                                                                                  ON A COMPUTER
                                               MOBILE INTERNET
             12                                VISITORS                                  MILLION VISITORS TO
      9               3                                                                  SOCIAL NETWORKS/BLOGS

          5PM 6

     APP USAGE
      AMONG
                               44%
                                             OF U.S. MOBILE
                                             SUBSCRIBERS OWN                                   76.6
    ADULTS PEAKS                             A SMARTPHONE
                                                                                                MILLION
                                                                                                                   58.6
                                                                                          TV HOMES ARE
                      TIME SPENT USING TABLETS AT HOME                                                                  MILLION TV
    70%               (30% OF TIME SPENT ON-THE-GO)
                                                                                        HD CAPABLE (67%)
                                                                                                                        HOMES HAVE
                                                                                                                        DIGITAL CABLE
                                                                                                                        (51%)
                          CONTENT ACCESSED DAILY:
                                    (% OF TABLET OWNERS)
                           39%   NEWS

                           34%   SPORTS
                                                                                 47.4
                                                                             MILLION                       MILLION TV HOMES HAVE
                           31%   BOOKS                                     TV HOMES
                                                                                                  35.9     4 OR MORE TV SETS (31%)
    Source: Nielsen                                                 HAVE A DVR (41%)
6
CROSS-PLATFORM                                                                                         MONTHLY TIME

    VIDEO ENGAGEMENT
                                                                                                             SPENT IN
                                                                                                           HOURS:MINUTES
                                                                                                                                       ASIAN
                                                                                                              RACE/                                5:47
    With an array of online video content to choose from, consumers increased                               ETHNICITY
    their monthly online video time in 3Q 2011 by 7 percent from the same                                                                          9:28
    period last year.                                                                                                                             95:55
                                                                                            WHITE
         Watching Traditional TV
         Watching Video on Internet                                                     3:37                      AFRICAN-           HISPANIC
         Mobile Subscribers Watching Video on a Mobile Phone                         3:52                         AMERICAN

                                                                                   142:05
                                                                                                                 5:30                 4:20
                                                                                                                 6:11                     6:29
      116:46             109:15
                                        113:46                                                             205:56                        125:48
       2:24              4:25
                                       7:33      125:55
        N/A              6:30
                                      5:25     6:30
                                             4:20
                                                                 143:22
                      12-17
           2-11               18-24                           4:35
                                      25-34
                                                           3:19                                  MONTHLY TIME SPENT IN HOURS:MINUTES—
                                              35-49                   178:29                         PER USER 2+ OF EACH MEDIUM
                                                                  3:22
                                                              2:53                                                           Q3 11       % Diff YOY

                                                                                                                 1 4 6:4 5
                                                 50-64
                                                                                                                                           0.9%
                                                                                      WATCHING TV IN THE HOME
                                                                          203:50
                                                              1:48 2:35
                                                                                                                     4 :3 1
           MONTHLY TIME                               65+
             SPENT IN                                                                                                                    7.1%
                                                                                   WATCHING VIDEO ON INTERNET
           HOURS:MINUTES
                                                                                                                     4 :2 0
                                                      2+
                      AGE                                    4:20 4:31             MOBILE SUBSCRIBERS WATCHING
                                                                       146:45         VIDEO ON A MOBILE PHONE
                                                                                                                                         0%


    Source: Nielsen

7
DIGITAL DIVERSITY
     A look at digital across four distinct groups of U.S. consumers in October 2011   The YBF—Social Network with the highest
                                                                                       concentration of this demo

                                                                                            Reed Between the Lines (BET)—Top
                                                                                            Primetime Cable Program

                                                                                       812 million total video streams                      AFRICAN-
                                                                                                                                            AMERICAN
                                                                                                                                           FEMALES 25-54
                                                                                         Spent 2.4 billion minutes watching video online
                                     35.4 million total video streams                   Top Gaming App by Total Minutes: Words with Friends
                                                                                        (211.8 million minutes)
                        29% downloaded games on their mobile phone
                            62% visited Facebook
       ASIAN
     FEMALES 12-17      57% accessed their mobile phone’s Web browser
                                                                                                   20% accessed their mobile phone’s Web browser
                     Spent 106.9 million minutes watching video online
                                                                                              Spent 3.2 billion minutes watching video online

                                                                                                      34% more likely than average to visit LinkedIn
                                                                                                                NCIS (CBS)—Top Primetime
                                                                                                                Broadcast Program
                          13.6 million total video streams
          Spent 2.2 billion minutes watching video online                                                       164.2 million total video streams
           69% own a smartphone
        63% more likely than average to visit Myspace.com         HISPANIC
                                                                  MALES 18-34
                                                                                                  WHITE
                                                                                                 MALES 55+

          46% download apps on their mobile phone

Source: Nielsen

 8
Other Apps
           55.8%                                                         A BREAKDOWN OF
                                SHARE OF MOBILE
                                                                         DIGITAL TIME BY DEVICE
                                 PHONE TIME BY               Text        During October 2011, YouTube was the top destination for online video
                                                             Messaging
      Camera
         1.1%                   FUNCTION                     13.4%
                                                                         content, accounting for nearly half (45%) of Americans’ total streaming
                                                                         time, while Social Networks/Blogs garnered the most Internet time
                                                                         overall. The majority of mobile phone time was consumed by app usage
                                                                         with Social Networking apps accounting for the nearly 6 percent of
Music/Video Apps                                     Browser             mobile time.
                  2.3%                               11.1%

                   Email/IM         Dialer    Social Networking Apps
                   5.3%             5.4%      5.5%


                                         AOL Media
                                         Network CBS
                                VEVO     1.3%                                        Social Networks/Blogs
                         Hulu                      Entertainment
                                3.0%               Websites 1.3%                                   21.3%             Online Games
                         6.9%
                                                                                                                     7.7%
                                                                                                                             E-mail
                  Netflix
                  10.7%                                                                                                      6.5%
                                                                                                                                 Videos/Movies
                                SHARE OF ONLINE                                               SHARE OF INTERNET                  4.3%
                                  VIDEO TIME BY                                                    TIME BY                       Portals
                                                                                                                                 3.8%
                                    BRAND                                                       CATEGORY
                                                         YouTube
                            Other
                                                         44.7%
                                                                                          Other
                            32.2%
Source: Nielsen
                                                                                          56.5%
9
1 SCREEN,                                                       WHAT ARE TABLET AND SMARTPHONE
                                                                 OWNERS DOING WHILE WATCHING TV?

 2 SCREENS,                                                            57%EMAIL
                                                                       CHECKED
 BIG SCREENS,                                                          44% UNRELATED INFO             DURING
                                                                                                      PROGRAM
 SMALL SCREENS
                                                                       SURFED FOR

                                                                       44% NETWORKING SITE
                                                                       VISITED SOCIAL
 More and more, consumers are multi-tasking across their
 various screens. Fifty-seven percent of smartphone and tablet
 owners checked email while watching a TV program—their top
 activity—and 44 percent visited a social networking site.
                                                                       59%EMAIL
                                                                       CHECKED
 Advertisers wondering if consumers might miss their message
 should note that 19 percent of smartphone and tablet owners
 searched for product information and 16 percent looked up
                                                                       44% UNRELATED INFO
                                                                       SURFED FOR
                                                                                                      DURING
                                                                                                      COMMERCIAL
 coupons or deals while the television was on.

 TOP WEBSITES VISITED WHILE WATCHING TV
                                                                       44% NETWORKING SITE
                                                                       VISITED SOCIAL

                                                                       45%
                                                                       USED A DOWNLOADED APPLICATION
         1. Facebook
         2. YouTube
                               6. Craigslist
                               7. eBay
                                                                       34%SPORT SCORES
                                                                       CHECKED
         3. Zynga
         4. Google Search
                               8. Electronic Arts (EA) Online
                               9. MSN/WindowsLive/Bing
                                                                       29% INFORMATION RELATED TO THE TV
                                                                       LOOKED UP
         5. Yahoo! Mail        10. Yahoo! Homepage                     PROGRAM I WAS WATCHING

                                                                       19% PRODUCT INFORMATION FOR AN AD I SAW
                                                                       LOOKED UP

                                                                       16% COUPONS OR DEALS RELATED TO
                                                                       LOOKED UP
 Source: Nielsen
                                                                       AN ADVERTISEMENT I SAW ON TV
10
SOCIAL NETWORKING                                                             METHODS USED TO ACCESS SOCIAL NETWORKING
                                                                                                BY AGE

 BY DEVICE                                                                                         18-34   35-54    55+
 While nearly all social media users (97%) access social networking sites
 from their computers, NM Incite, a Nielsen McKinsey company, found
 that females are more likely than men to read social media content from
 their eReaders and men are more likely than women to access their
 social content from an Internet-enabled TV or gaming console.              Mobile Phone          58.8%    36.3%   12.6%
 METHODS USED TO ACCESS SOCIAL NETWORKING                                   eReader               2.9%     1.4%    0.6%
                BY GENDER
                                                                            iPad                  4.5%     2.9%    2.4%
                                                                            Computer              95.7%    97.0%   97.0%
     34.4%                Mobile Phone              38.5%                   Internet-enabled TV   3.9%     1.2%    1.0%
     0.8%                    eReader                 2.3%                   Gaming Console        5.3%     2.9%    0.2%
      3.4%                     iPad                  3.1%
     96.4%                  Computer                96.8%                   Handheld Music        2.4%     1.1%     n/a
                                                                            Player
      2.9%            Internet-enabled TV            1.2%
                                                                            Other                 1.0%     0.7%     1.3
      3.6%              Gaming Console               2.3%
     0.8%            Handheld Music Player           1.5%
      1.1%                    Other                 0.8%
 Source: NM Incite
11
TO THINK IT                                                                SHARE OF SOCIAL MEDIA BUZZ AMONG SELECT
                                                                                OVER-THE-TOP VIDEO DEVICES

     IS TO BLOG IT
                                                                                (3Q 2011)
                                                                                READ AS: During 3Q 2011, Apple TV accounted for 29.3 percent of buzz mentions among the
                                                                                select group of over-the-top devices

 By the end of 2011, NM Incite, a Nielsen/McKinsey company, tracked over 181
 million blogs around the world, up from 36 million in 2006. Three of the top                     Apple TV                                     Roku
 ten social networks in the U.S. during October were true blogs (Blogger,
 WordPress.com, Tumblr), with a combined 80 million unique visitors. Among
                                                                                                  29.3%                                        35.3%
 the top social networks, Tumblr has shown the strongest growth in visitors,
 more than doubling its audience from last year.

 Emerging Social Network: Pinterest
 • 4.5 million unique U.S. visitors during Oct 2011 – 37 times its size at
   the beginning of 2011
 • Consumers ages 25-34 – most likely out of all age groups to view pages
   on Pinterest                                                                                                                                 Boxee
 • 92 percent of Pinterest’s audience also visited a Mass Merchandiser site                                                                     7.6%
   during Oct 2011
                                                                                                             MeeGo
 NUMBER OF BLOGS TRACKED BY NM INCITE                                                                        13.2%                Google TV
                                                                                                                                  14.7%
                                                            Oct -11
                                                            173,000,000
                                                                                TOP 10 U.S. SOCIAL NETWORKS/BLOGS BY UNIQUE AUDIENCE
                                        Oct -09                                 (Oct 2011, Home & Work Computers)
                                        127,035,018
                                                      Oct -10                                      139.1M                 Facebook                         6%
                           Oct -08                    148,452,047                                 46.3M                 Blogger                           4%
                           78,703,197
                                                                                UNIQUE VISITORS


                                                                                                   26.0M                Twitter.com                       41%


                                                                                                                                                                     YOY % Change
     Oct-06                                                                                       20.4M              WordPress.com                       13%
     35,771,454                                                                                    19.3M                   LinkedIn                       63%
                      Oct -07
                      61,353,334                                                                  13.8M                  Tumblr                         128%
                                                                                                   13.4M                Myspace.com                       -63%
                                                                                                   9.5M                  Google+                           N/A
                                                                                                    7.6M                   Wikia                           28%
 Source: Nielsen and NM Incite                                                                     7.0M                   Squidoo                          14%
12
MARKETING TO THE                                                                     46%
 DIGITAL CONSUMER                                                                        ADS
                                                                                         ON TV                         36%
 WHEN VIEWING ADS
                                                                                             FEMALE 45%
                                                                                             MALE 47%     TV PROGRAM
 ON THEIR DEVICE:                                      52%                                                PRODUCT
                                                                                                          PLACEMENTS
                                                                                                          FEMALE 35%
 TABLET                              SMARTPHONE               BRANDED                                     MALE 37%
 OWNERS                                OWNERS                 WEBSITES
                  Clicked on ad to view
              the full ad or product offering
                                                               FEMALE 52%
                                                               MALE 51%
                                                                                                                        ADS SERVED
                                                                                                                        IN SEARCH
                                                                                                                                       36%
 24%                                     11%                                                                            ENGINE RESULTS
                                                                                                                        FEMALE 39%
                                                                                                                        MALE 34%
        Made a purchase through their computer

 23%                                     20%                           TRUST IN ADVERTISING
        Searched for more info about the business                      AMONG ONLINE                                           ONLINE

 21%                                     11%                           CONSUMERS
                                                                                                                              VIDEO ADS
                                                                                                                              FEMALE 34%
                                                                                                                              MALE 30%
                                                                                                                                               32%
               Used or requested a coupon                              % Who Trust

 13%                 through the ad
                                           7%                                                                          ADS ON
                                                       TEXT (SMS)                                                      SOCIAL
                                                       ADS ON                                                          NETWORKS
     AMONG MOBILE                                      MOBILE PHONES                                                   FEMALE 36%

     CONNECTED
                                                       FEMALE 29%
                                                       MALE 22%
                                                                                DISPLAY ADS
                                                                                                                       MALE 28%
                                                                                                                                     32%
                                                                                                          ONLINE
     DEVICE OWNERS:                                    26%                      (VIDEO OR BANNER)
                                                                                ON MOBILE DEVICES         BANNER ADS
                                                                                                          FEMALE 34%
     33%      find ads that offer custom information
                                                                                FEMALE 31%
                                                                                MALE 23%
                                                                                                          MALE 24%
     based on their location useful

     26%                                                                                                         29%
                                                                              27%
              are more likely to look at ads if they
     have an interesting video

     20% enjoy ads that have interactive features                                                                                          Source: Nielsen


13
MOBILE SHOPPING ACTIVITIES IN THE
                  PAST 30 DAYS                                        THE INCREASING
                                                                      POWER OF MOBILE
                                             (% OF MOBILE SHOPPERS)
                  Comparing prices online
                  while shopping in a store                38%
                  Browsing products through
                  websites or apps                         38%        COMMERCE
                  Reading online reviews
                                                                      Mobile is transforming into a powerful commerce tool, facilitating
                  of products                              32%        consumer transactions and access to real-time information and deals.
                  Searching for/using                                 Twenty-nine percent of smartphone owners use their phone for
                  online coupons                           24%        shopping-related activities and more than half of mobile users are repeat
                                                                      visitors to daily deal sites. The Groupon app is the 10th most popular app
                  Purchasing products                      22%        on the iOS platform and ranks 22nd on Android devices.

                  Scanning a barcode for
                  price/product information                22%
                                                                      UNIQUE AUDIENCE FOR                             in millions
                                                                                                                                           Android
                  Using location-based services                       DAILY DEAL APPS (OCT 2011)                                           iOS
                  to find a retail location                 18%
                  Placing a bid through an
                  online auction                               15%      Groupon                        4.8                                 6.1
                  Purchasing tickets to events                 12%
                                                                                     Visits per person: 11          Visits per person: 6
                  Purchasing music or video content            10%
                  Paying for goods or services at point of sale 9%                LivingSocial          1.2                     2.4
                                                                                           Visits per person: 7     Visits per person: 4

     Source: Nielsen
                              27% of male and
                             22% of female online
                       consumers would use their mobile
                           phones to make payments
                                   in restaurants

14
                               or shops if they could
THE IN-HOME STREAMING
 EXPERIENCE
                                                                                                 33%
                                                                                                                         OF CONSUMERS STREAMED A MOVIE
                                                                                                                         OR TV SHOW FROM THE INTERNET
                                                                                                                         THROUGH A SUBSCRIPTION SERVICE
     The home entertainment landscape is becoming increasingly complex                                                   LIKE NETFLIX OR HULU PLUS
     as consumers are presented with a greater variety of ways to consume
     content, especially with the addition of digital streaming and movie
     downloads via the Internet.

      AUDIENCE COMPOSITION %
      FROM HOME COMPUTERS                                                                        FEMALES          ACCOUNT FOR    64%     OF TOTAL TIME SPENT
                   Male
                                                           43                                          WATCHING VIDEO CONTENT ON NETFLIX AND HULU
                                                          41
                Female
                                                                  57
                                                                   59                                         HISPANICS               ARE MUCH MORE LIKELY

                                                                                                                                          NETFLIX
                  2 - 17                 18
                               9                                                                                      TO WATCH VIDEO ON
                18 - 34                                  40
                                                    31                                                                                         THAN ON HULU
                                               26
                35 - 49                        26

                                                                                                   ASIANS
                                   13
                50 - 64                       23                          NETFLIX
                           4                                                                                        STREAM MORE VIDEOS ON

                                                                                                                               HULU
                    65+        11                                         HULU
              Hispanic                  16                                                                                                    THAN ON NETFLIX
                                   11
                                                                             76

                                                                                                  HULU
                White                                                         79
     Black or African-         10                                                                             VIEWERS ARE MORE LIKELY
            American            11
      Asian or Pacific
              Islander
                           3
                           3                                                                         BACHELOR'S OR
                                                                                                  TO HAVE A


                                                                                                     POST-GRAD DEGREE
                                                                18%                                                                  THAN NETFLIX VIEWERS

      PAID TO DOWNLOAD                                          downloaded
                                                                to rent
                                                                                    14%
                                                                                    downloaded     MORE THAN A THIRD
      A MOVIE OR TV SHOW                                                            to own         OF HULU'S AUDIENCE IS OVER THE AGE OF 50
      FROM THE INTERNET
      (% OF CONSUMERS)

      Source: Nielsen


15
%     Mobile Phone
                       Online Consumers
            Who Watch Video

           Handheld Multimedia Device
                                        On Device Daily
                                                       In-Home Video Game System
                                                       INDEX V. GLOBAL AVERAGE
                                                                                                 DAILY VIDEO VIEWING
                                                                                                 AROUND THE WORLD
                                                                                                 Nielsen’s survey of more than 25,000 online respondents from 56 countries
                                                                                                 around the world reveals consumers’ multi-screen video habits.


                                                                                                                GLOBAL
           Tablet Device
      Index reads as: During 3Q 2011, online consumers in Asia Pacific were 46 percent
      more likely than the average global consumer to watch video on their mobile phone daily.


     EUROPE

        15%            6%         4%    3%                                                                   28%            11%          8%      6%
           54
                       55         50    43


      NORTH AMERICA
                                                                                                          LATIN AMERICA
          20%            13%            8%          6%
            71
                                                                                                              29%            10%         6%     6%
                            118         100          86
                                                                                                               104
                                                                                                                              91         75         86
      MIDDLE EAST,
      AFRICA, PAKISTAN
                                                                                                          ASIA PACIFIC

            37%                   12%         11%            9%
              132                                                                                              41%                 15%        9%         9%
                                  109          138            129                                                146
                                                                                                                                   136        113        129
     Source: Nielsen

16
THE GLOBAL                                                                                  SWITZERLAND                                           US
ONLINE                                                                     # 1   GOOGLE
                                                                                            2
                                                                                            3
                                                                                            4
                                                                                                 Facebook
                                                                                                 YouTube
                                                                                                 MSN/WindowsLive/Bing
                                                                                                                                 1
                                                                                                                                 #      GOOGLE    2 Facebook
                                                                                                                                                  3
                                                                                                                                                  4
                                                                                                                                                       Yahoo!
                                                                                                                                                       MSN/WindowsLive/Bing
                                                                                                                                                  5    YouTube

PERSPECTIVE
                                                                                            5    Microsoft
                                                                                            6    Bluewin                                          6    Microsoft
                                                                                            7    Wikipedia                                        7    AOL Media Network
                                                                                            8    Apple                                            8    Wikipedia


                                                                       1
                                                                                                                                                  9    Apple
TOP 10 WEB BRANDS BY UNIQUE                                                                 9    Local.ch
                                                                                                                                                  10   Ask Search Network
                                                                                            10   search.ch
AUDIENCE (Oct 2011, Home & Work Computers )                           #    GOOGLE
                                                                                                            YOUTUBE is a top ten
                   GERMANY                                 BRAZIL                                           online destination in all
                        2    Facebook                       2    MSN/WindowsLive/Bing                       of the countries

          1
                        3    YouTube

      #
                        4
                        5
                             eBay
                             Microsoft
                                                            3
                                                            4
                                                                 Facebook
                                                                 UOL                                                                                       JAPAN

                                                                                                   1
            GOOGLE                                          5    YouTube


                                                                                                                                            1
                        6    Amazon                                                                                                                        2    Google
                                                            6    Microsoft                                                                                 3    FC2
                        7    MSN/WindowsLive/Bing           7    Terra
                        8    Wikipedia                      8    Globo.com                         #   GOOGLE                              #     YAHOO!    4    YouTube
                        9    T-Online                                                                                                                      5    Rakuten
                                                            9    Orkut                                                                                     6    Wikipedia
                        10   Web.de                         10   Yahoo!                                                                                    7    Microsoft
                                                                                            AUSTRALIA                                                      8    goo


                                                                                                                         1
                         FACEBOOK is among the top three sites in every                     2 Facebook
                                                                                                                                                           9    Ameba
                                                                                                                                                           10   Amazon


      1
                         country except Japan (the country's top two social networking      3    NineMSN/MSN
                         sites, FC2 and Ameba, are among the top 10 most-visited overall)   4    YouTube                 #   GOOGLE
     #     GOOGLE                                                                           5    Microsoft
                                                                                            6
                                                                                            7
                                                                                                 Yahoo!7
                                                                                                 Wikipedia                           SPAIN
                                                 1
                                                                                            8    Apple                               2    MSN/WindowsLive/Bing
 ITALY
 2 Facebook
                                               #     GOOGLE
                                                                                            9
                                                                                            10
                                                                                                 eBay
                                                                                                 Blogger
                                                                                                                                     3
                                                                                                                                     4
                                                                                                                                          Facebook
                                                                                                                                          YouTube
     3    YouTube                                                                                                                    5    Microsoft
     4    MSN/WindowsLive/Bing                                                                                                       6    Blogger
     5    Virgilio                                                                                                                   7    Yahoo!
     6    Libero                     FRANCE                                                  UK                                      8    Wikipedia


                                                                              1
     7    Microsoft                                                                                                                  9    Elmundo.es
                                     2    Facebook                                           2    Facebook                           10   WordPress.com
     8    Yahoo!
                                     3    MSN/WindowsLive/Bing
     9    Wikipedia
                                     4    Microsoft
                                                                             #    GOOGLE     3
                                                                                             4
                                                                                                  MSN/WindowsLive/Bing
                                                                                                  BBC
     10   Blogger
                                     5    YouTube                                            5    YouTube
                                     6    Orange                                             6    Yahoo!                       GOOGLE is the top Web brand
                                     7    Wikipedia                                          7    Amazon
                                     8    Free                                               8    eBay                         in each country except Japan
 Source: Nielsen
                                     9    PagesJaunes                                        9    Microsoft
                                     10   Yahoo!                                             10   Wikipedia
17
SOURCES
     Originally Issued as State of the Media: U.S. Digital Consumer Report
                                                                                8    • Online Video Streams and Total Minutes: VideoCensus (Total),
                                                                                       Oct 2011
                                                                                     • Social Networking: NetView (Total), Oct 2011
                                                                                     • TV Programs: NPOWER, Oct 2011, Live+SD. Excludes Breakouts,
     Q3-Q4, 2011 in March 2012                                                         specials, Sports, programs less than 5 minutes in duration and

     4   • 2000: NetView (Home & Work), Jan 2000
                                                                                       programs with less than three telecasts
         •
         •
           2002: VideoScan, 2002
           2005: NetView (Home & Work), Oct 2005
                                                                                9    • Mobile Phone: Smartphone Analytics, Oct 2011
                                                                                     • Online Video: VideoCensus (Total), Oct 2011
         • 2006: Mobile Insights, 3Q 2006                                            • Internet: NetView (Total), Oct 2011
         • 2007: Mobile Insights, Jan 2007
         • 2008: VideoCensus (Home & Work), Jan 2008                            10   • Activities while watching TV: Mobile Connected Device Report,
                                                                                       3Q 2011
                 Mobile Media Marketplace, 3Q 2008
         • 2009: NetView (Home & Work), May 2009                                     • Top sites visited while watching TV: NPOWER (Cross-Platform
                 “The Switch from Analog to Digital TV,” Nov 2009                      Homes), Oct 2011
         • 2011: NetView (Total), Oct 2011
                 Smartphone Analytics, Oct 2011
                                                                                11   • NM Incite, State of Social Media Survey, April 2011

                 Mobile Connected Device Report, 3Q 2011
                 NPOWER (NPM Sample), Aug 2011
                                                                                12   • Top U.S. Social Networks/Blogs and Pinterest: NetView
                                                                                       (Home & Work), Oct 2011
                                                                                     • Blog trend: NM Incite, Oct 2006-2011
     5   •   TV Viewers: National UEs and MarketBreaks 2012
                                                                                     • Over-the-Top device buzz: NM Incite, 3Q 2011
         •   Online Video Viewers: VideoCensus (Total), Oct 2011
         •
         •
             Social Network/Blog Visitors: NetView (Total), Oct 2011
             Tablet Owners: Mobile Insights, 3Q 2011
                                                                                13   • Trust in Advertising: Nielsen Global Survey, 3Q 2011
                                                                                     • Among smartphone, tablet and connected mobile device owners:
         •   Smartphone Owners: Mobile Insights, 3Q 2011                               Mobile Connected Device Report, 3Q 2011

 6       Mobile                                                                 14   • Mobile Shopping Activities: Mobile Insights, Oct 2011
         • Mobile Internet Visitors: Mobile Insights, 3Q 2011                        • Daily Deal Apps: Smartphone Analytics, Oct 2011
         • Smartphone Penetration: Mobile Insights, Oct 2011                         • Mobile Payments (red circle): Nielsen Global Survey, 3Q 2011 (U.S.)
         • Peak App Usage: Smartphone Analytics (Android), Oct 2011
         Internet
         • Internet Access and Social Network/Blog Visitors: NetView (Total),
                                                                                15   • Netflix/Hulu: VideoCensus (Home), Oct 2011
                                                                                     • Downloading and streaming behaviors: New Media Tracking, Jan 2012
            Oct 2011
         • Video Viewers: VideoCensus (Total), Oct 2011
         TV                                                                     16   • Nielsen Global Survey, 3Q 2011
         • National Media Related UEs, Nov 2011
                                                                                17   • Nielsen NetView (Home & Work), Oct 2011
     7   • Cross-Platform Report 3Q 2011.


18
ABOUT NIELSEN
 Nielsen Holdings N.V. (NYSE: NLSN) is a global information and measurement company with leading market positions in marketing and consumer
 information, television and other media measurement, online intelligence, mobile measurement, trade shows and related properties. Nielsen has a
 presence in approximately 100 countries, with headquarters in New York, USA and Diemen, the Netherlands. For more information, visit www.nielsen.com.


19
Copyright © 2012 The Nielsen Company. All rights reserved. Nielsen and the Nielsen logo are trademarks or registered trademarks of CZT/
 ACN Trademarks, L.L.C. Other product and service names are trademarks or registered trademarks of their respective companies. 12/4377

20

More Related Content

What's hot

The Cross Platform Report Q4-2011 (Nielsen) -May12
The Cross Platform Report Q4-2011 (Nielsen) -May12The Cross Platform Report Q4-2011 (Nielsen) -May12
The Cross Platform Report Q4-2011 (Nielsen) -May12Retelur Marketing
 
Helix - Media Delivery Platform
Helix - Media Delivery PlatformHelix - Media Delivery Platform
Helix - Media Delivery PlatformInteract
 
WC14 business opportunities for mobile operators
WC14 business opportunities for mobile operatorsWC14 business opportunities for mobile operators
WC14 business opportunities for mobile operatorsValter Wolf
 
Health 2 0 & ultrabook services
Health 2 0 & ultrabook servicesHealth 2 0 & ultrabook services
Health 2 0 & ultrabook servicesifa2012
 
Annina Svensson - What Luxury May Learn from Entertainment - HUBFORUM MOSCOW ...
Annina Svensson - What Luxury May Learn from Entertainment - HUBFORUM MOSCOW ...Annina Svensson - What Luxury May Learn from Entertainment - HUBFORUM MOSCOW ...
Annina Svensson - What Luxury May Learn from Entertainment - HUBFORUM MOSCOW ...HUB INSTITUTE
 
A brave new consumer world gerzema 2012_retailcanada
A brave new consumer world gerzema 2012_retailcanadaA brave new consumer world gerzema 2012_retailcanada
A brave new consumer world gerzema 2012_retailcanadaZoltán Vasvári
 
The digital meta-dissemination of fear in music videos. A transdisciplinary t...
The digital meta-dissemination of fear in music videos. A transdisciplinary t...The digital meta-dissemination of fear in music videos. A transdisciplinary t...
The digital meta-dissemination of fear in music videos. A transdisciplinary t...João Pedro da Costa
 
Infrastructure for mobile communities
Infrastructure for mobile communitiesInfrastructure for mobile communities
Infrastructure for mobile communitiesClaude Florin
 

What's hot (10)

The Cross Platform Report Q4-2011 (Nielsen) -May12
The Cross Platform Report Q4-2011 (Nielsen) -May12The Cross Platform Report Q4-2011 (Nielsen) -May12
The Cross Platform Report Q4-2011 (Nielsen) -May12
 
Helix - Media Delivery Platform
Helix - Media Delivery PlatformHelix - Media Delivery Platform
Helix - Media Delivery Platform
 
Computers in libraries: Information fluency
Computers in libraries: Information fluencyComputers in libraries: Information fluency
Computers in libraries: Information fluency
 
WC14 business opportunities for mobile operators
WC14 business opportunities for mobile operatorsWC14 business opportunities for mobile operators
WC14 business opportunities for mobile operators
 
Health 2 0 & ultrabook services
Health 2 0 & ultrabook servicesHealth 2 0 & ultrabook services
Health 2 0 & ultrabook services
 
Annina Svensson - What Luxury May Learn from Entertainment - HUBFORUM MOSCOW ...
Annina Svensson - What Luxury May Learn from Entertainment - HUBFORUM MOSCOW ...Annina Svensson - What Luxury May Learn from Entertainment - HUBFORUM MOSCOW ...
Annina Svensson - What Luxury May Learn from Entertainment - HUBFORUM MOSCOW ...
 
A brave new consumer world gerzema 2012_retailcanada
A brave new consumer world gerzema 2012_retailcanadaA brave new consumer world gerzema 2012_retailcanada
A brave new consumer world gerzema 2012_retailcanada
 
The digital meta-dissemination of fear in music videos. A transdisciplinary t...
The digital meta-dissemination of fear in music videos. A transdisciplinary t...The digital meta-dissemination of fear in music videos. A transdisciplinary t...
The digital meta-dissemination of fear in music videos. A transdisciplinary t...
 
The Mobile Revolution
The Mobile RevolutionThe Mobile Revolution
The Mobile Revolution
 
Infrastructure for mobile communities
Infrastructure for mobile communitiesInfrastructure for mobile communities
Infrastructure for mobile communities
 

Viewers also liked

Moz: Beginners guide to Social Media Marketing
Moz: Beginners guide to Social Media MarketingMoz: Beginners guide to Social Media Marketing
Moz: Beginners guide to Social Media MarketingNaveen Srikantaiah
 
Four trends in digital publishing
Four trends in digital publishingFour trends in digital publishing
Four trends in digital publishingMichael Bhaskar
 
SEO for Beginners-- What is Search Engine Optimization (SEO) ?
SEO for Beginners-- What is Search Engine Optimization (SEO) ?SEO for Beginners-- What is Search Engine Optimization (SEO) ?
SEO for Beginners-- What is Search Engine Optimization (SEO) ?Naveen Srikantaiah
 
Consumer revolution
Consumer revolutionConsumer revolution
Consumer revolutionDavid Merzel
 
The Digital PR Revolution
The Digital PR Revolution The Digital PR Revolution
The Digital PR Revolution Mynewsdesk
 

Viewers also liked (7)

Google plus for nonprofits
Google plus for nonprofitsGoogle plus for nonprofits
Google plus for nonprofits
 
Social media for non profits
Social media for non profitsSocial media for non profits
Social media for non profits
 
Moz: Beginners guide to Social Media Marketing
Moz: Beginners guide to Social Media MarketingMoz: Beginners guide to Social Media Marketing
Moz: Beginners guide to Social Media Marketing
 
Four trends in digital publishing
Four trends in digital publishingFour trends in digital publishing
Four trends in digital publishing
 
SEO for Beginners-- What is Search Engine Optimization (SEO) ?
SEO for Beginners-- What is Search Engine Optimization (SEO) ?SEO for Beginners-- What is Search Engine Optimization (SEO) ?
SEO for Beginners-- What is Search Engine Optimization (SEO) ?
 
Consumer revolution
Consumer revolutionConsumer revolution
Consumer revolution
 
The Digital PR Revolution
The Digital PR Revolution The Digital PR Revolution
The Digital PR Revolution
 

Similar to Digital consumer - Digital Marketing Revolution

The Digital Revolution: A Look Throu gh the Marketer’s Lens
The Digital Revolution: A Look Throu gh the Marketer’s LensThe Digital Revolution: A Look Throu gh the Marketer’s Lens
The Digital Revolution: A Look Throu gh the Marketer’s LensHabemus Digital Consultants
 
Nielsen digital consumer_report_final
Nielsen digital consumer_report_finalNielsen digital consumer_report_final
Nielsen digital consumer_report_finalankitsuchanti
 
Flurry Mobile App Industry Trends Presentation, Business Insider Mobile Adver...
Flurry Mobile App Industry Trends Presentation, Business Insider Mobile Adver...Flurry Mobile App Industry Trends Presentation, Business Insider Mobile Adver...
Flurry Mobile App Industry Trends Presentation, Business Insider Mobile Adver...Flurry, Inc.
 
A Conversation with Alison Lewis, SVP Marketing for North America, The Coca-C...
A Conversation with Alison Lewis, SVP Marketing for North America, The Coca-C...A Conversation with Alison Lewis, SVP Marketing for North America, The Coca-C...
A Conversation with Alison Lewis, SVP Marketing for North America, The Coca-C...Signal Chicago 2012
 
Mobile Recruiting (October 2011)
Mobile Recruiting (October 2011)Mobile Recruiting (October 2011)
Mobile Recruiting (October 2011)David Lee
 
We Are Social's Guide to Social, Digital, and Mobile in The Philippines, Dec ...
We Are Social's Guide to Social, Digital, and Mobile in The Philippines, Dec ...We Are Social's Guide to Social, Digital, and Mobile in The Philippines, Dec ...
We Are Social's Guide to Social, Digital, and Mobile in The Philippines, Dec ...We Are Social Singapore
 
Live Mobile: "An Audience Of Billions - Just How Big Can The Mobile Market Ge...
Live Mobile: "An Audience Of Billions - Just How Big Can The Mobile Market Ge...Live Mobile: "An Audience Of Billions - Just How Big Can The Mobile Market Ge...
Live Mobile: "An Audience Of Billions - Just How Big Can The Mobile Market Ge...Андрей Акимов
 
Презентация Flurry на Live Mobile
Презентация Flurry на Live MobileПрезентация Flurry на Live Mobile
Презентация Flurry на Live MobileElena Pikunova
 
TheTrendWatch #04
TheTrendWatch #04TheTrendWatch #04
TheTrendWatch #04damoncb
 
Digital and Social trends in 2013
Digital and Social trends in 2013Digital and Social trends in 2013
Digital and Social trends in 2013Nitin Karkara
 
Digital landscape tr march 2013 english distributable
Digital landscape tr march 2013 english distributableDigital landscape tr march 2013 english distributable
Digital landscape tr march 2013 english distributableBaris Yilmaz
 
thinkLA Mobile 101 presentation - Deborah Lammon
thinkLA Mobile 101 presentation - Deborah LammonthinkLA Mobile 101 presentation - Deborah Lammon
thinkLA Mobile 101 presentation - Deborah LammonthinkLA
 
Terra London 2011
Terra London 2011Terra London 2011
Terra London 2011Juan Varela
 
Some inspirational trends for today
Some inspirational trends for todaySome inspirational trends for today
Some inspirational trends for todayMediaCom France
 
Some significant and inspirational media trends for today
Some significant and inspirational media trends for todaySome significant and inspirational media trends for today
Some significant and inspirational media trends for todayFrancoise Fassin
 
The Digital Consumer Report 2014 Nielsen
The Digital Consumer Report 2014 NielsenThe Digital Consumer Report 2014 Nielsen
The Digital Consumer Report 2014 NielsenDung Tri
 
Faction Media Digital Media Workshop
Faction Media Digital Media WorkshopFaction Media Digital Media Workshop
Faction Media Digital Media WorkshopConcise Path
 
The digital-consumer-report-feb-2014 (1)
The digital-consumer-report-feb-2014 (1)The digital-consumer-report-feb-2014 (1)
The digital-consumer-report-feb-2014 (1)Sumit Roy
 
nielsen-thedigitalconsumerreport-feb-2014-140211210707-phpapp02
nielsen-thedigitalconsumerreport-feb-2014-140211210707-phpapp02nielsen-thedigitalconsumerreport-feb-2014-140211210707-phpapp02
nielsen-thedigitalconsumerreport-feb-2014-140211210707-phpapp02Imran Quraishi
 

Similar to Digital consumer - Digital Marketing Revolution (20)

The Digital Revolution: A Look Throu gh the Marketer’s Lens
The Digital Revolution: A Look Throu gh the Marketer’s LensThe Digital Revolution: A Look Throu gh the Marketer’s Lens
The Digital Revolution: A Look Throu gh the Marketer’s Lens
 
12 Trends from Cannes 2011
12 Trends from Cannes 201112 Trends from Cannes 2011
12 Trends from Cannes 2011
 
Nielsen digital consumer_report_final
Nielsen digital consumer_report_finalNielsen digital consumer_report_final
Nielsen digital consumer_report_final
 
Flurry Mobile App Industry Trends Presentation, Business Insider Mobile Adver...
Flurry Mobile App Industry Trends Presentation, Business Insider Mobile Adver...Flurry Mobile App Industry Trends Presentation, Business Insider Mobile Adver...
Flurry Mobile App Industry Trends Presentation, Business Insider Mobile Adver...
 
A Conversation with Alison Lewis, SVP Marketing for North America, The Coca-C...
A Conversation with Alison Lewis, SVP Marketing for North America, The Coca-C...A Conversation with Alison Lewis, SVP Marketing for North America, The Coca-C...
A Conversation with Alison Lewis, SVP Marketing for North America, The Coca-C...
 
Mobile Recruiting (October 2011)
Mobile Recruiting (October 2011)Mobile Recruiting (October 2011)
Mobile Recruiting (October 2011)
 
We Are Social's Guide to Social, Digital, and Mobile in The Philippines, Dec ...
We Are Social's Guide to Social, Digital, and Mobile in The Philippines, Dec ...We Are Social's Guide to Social, Digital, and Mobile in The Philippines, Dec ...
We Are Social's Guide to Social, Digital, and Mobile in The Philippines, Dec ...
 
Live Mobile: "An Audience Of Billions - Just How Big Can The Mobile Market Ge...
Live Mobile: "An Audience Of Billions - Just How Big Can The Mobile Market Ge...Live Mobile: "An Audience Of Billions - Just How Big Can The Mobile Market Ge...
Live Mobile: "An Audience Of Billions - Just How Big Can The Mobile Market Ge...
 
Презентация Flurry на Live Mobile
Презентация Flurry на Live MobileПрезентация Flurry на Live Mobile
Презентация Flurry на Live Mobile
 
TheTrendWatch #04
TheTrendWatch #04TheTrendWatch #04
TheTrendWatch #04
 
Digital and Social trends in 2013
Digital and Social trends in 2013Digital and Social trends in 2013
Digital and Social trends in 2013
 
Digital landscape tr march 2013 english distributable
Digital landscape tr march 2013 english distributableDigital landscape tr march 2013 english distributable
Digital landscape tr march 2013 english distributable
 
thinkLA Mobile 101 presentation - Deborah Lammon
thinkLA Mobile 101 presentation - Deborah LammonthinkLA Mobile 101 presentation - Deborah Lammon
thinkLA Mobile 101 presentation - Deborah Lammon
 
Terra London 2011
Terra London 2011Terra London 2011
Terra London 2011
 
Some inspirational trends for today
Some inspirational trends for todaySome inspirational trends for today
Some inspirational trends for today
 
Some significant and inspirational media trends for today
Some significant and inspirational media trends for todaySome significant and inspirational media trends for today
Some significant and inspirational media trends for today
 
The Digital Consumer Report 2014 Nielsen
The Digital Consumer Report 2014 NielsenThe Digital Consumer Report 2014 Nielsen
The Digital Consumer Report 2014 Nielsen
 
Faction Media Digital Media Workshop
Faction Media Digital Media WorkshopFaction Media Digital Media Workshop
Faction Media Digital Media Workshop
 
The digital-consumer-report-feb-2014 (1)
The digital-consumer-report-feb-2014 (1)The digital-consumer-report-feb-2014 (1)
The digital-consumer-report-feb-2014 (1)
 
nielsen-thedigitalconsumerreport-feb-2014-140211210707-phpapp02
nielsen-thedigitalconsumerreport-feb-2014-140211210707-phpapp02nielsen-thedigitalconsumerreport-feb-2014-140211210707-phpapp02
nielsen-thedigitalconsumerreport-feb-2014-140211210707-phpapp02
 

More from Naveen Srikantaiah

120 marketing-stats-charts-and-graphs : Internet Marketing,SEO,Social Media,W...
120 marketing-stats-charts-and-graphs : Internet Marketing,SEO,Social Media,W...120 marketing-stats-charts-and-graphs : Internet Marketing,SEO,Social Media,W...
120 marketing-stats-charts-and-graphs : Internet Marketing,SEO,Social Media,W...Naveen Srikantaiah
 
Don't try this at home- Stefan Kolle, Social India Conference
Don't try this at home- Stefan Kolle, Social India ConferenceDon't try this at home- Stefan Kolle, Social India Conference
Don't try this at home- Stefan Kolle, Social India ConferenceNaveen Srikantaiah
 
Rahul gandhi visited akshaya patra foundation
Rahul gandhi visited akshaya patra foundationRahul gandhi visited akshaya patra foundation
Rahul gandhi visited akshaya patra foundationNaveen Srikantaiah
 
Akshaya Patra mid day meal in government schools
Akshaya Patra mid day meal in government schoolsAkshaya Patra mid day meal in government schools
Akshaya Patra mid day meal in government schoolsNaveen Srikantaiah
 

More from Naveen Srikantaiah (6)

120 marketing-stats-charts-and-graphs : Internet Marketing,SEO,Social Media,W...
120 marketing-stats-charts-and-graphs : Internet Marketing,SEO,Social Media,W...120 marketing-stats-charts-and-graphs : Internet Marketing,SEO,Social Media,W...
120 marketing-stats-charts-and-graphs : Internet Marketing,SEO,Social Media,W...
 
Minus one- Save Forest
Minus one- Save ForestMinus one- Save Forest
Minus one- Save Forest
 
The Social Engagement Journey
The Social Engagement JourneyThe Social Engagement Journey
The Social Engagement Journey
 
Don't try this at home- Stefan Kolle, Social India Conference
Don't try this at home- Stefan Kolle, Social India ConferenceDon't try this at home- Stefan Kolle, Social India Conference
Don't try this at home- Stefan Kolle, Social India Conference
 
Rahul gandhi visited akshaya patra foundation
Rahul gandhi visited akshaya patra foundationRahul gandhi visited akshaya patra foundation
Rahul gandhi visited akshaya patra foundation
 
Akshaya Patra mid day meal in government schools
Akshaya Patra mid day meal in government schoolsAkshaya Patra mid day meal in government schools
Akshaya Patra mid day meal in government schools
 

Recently uploaded

Catalogue ONG NUOC PPR DE NHAT .pdf
Catalogue ONG NUOC PPR DE NHAT      .pdfCatalogue ONG NUOC PPR DE NHAT      .pdf
Catalogue ONG NUOC PPR DE NHAT .pdfOrient Homes
 
Grateful 7 speech thanking everyone that has helped.pdf
Grateful 7 speech thanking everyone that has helped.pdfGrateful 7 speech thanking everyone that has helped.pdf
Grateful 7 speech thanking everyone that has helped.pdfPaul Menig
 
Russian Faridabad Call Girls(Badarpur) : ☎ 8168257667, @4999
Russian Faridabad Call Girls(Badarpur) : ☎ 8168257667, @4999Russian Faridabad Call Girls(Badarpur) : ☎ 8168257667, @4999
Russian Faridabad Call Girls(Badarpur) : ☎ 8168257667, @4999Tina Ji
 
Regression analysis: Simple Linear Regression Multiple Linear Regression
Regression analysis:  Simple Linear Regression Multiple Linear RegressionRegression analysis:  Simple Linear Regression Multiple Linear Regression
Regression analysis: Simple Linear Regression Multiple Linear RegressionRavindra Nath Shukla
 
BEST Call Girls In Greater Noida ✨ 9773824855 ✨ Escorts Service In Delhi Ncr,
BEST Call Girls In Greater Noida ✨ 9773824855 ✨ Escorts Service In Delhi Ncr,BEST Call Girls In Greater Noida ✨ 9773824855 ✨ Escorts Service In Delhi Ncr,
BEST Call Girls In Greater Noida ✨ 9773824855 ✨ Escorts Service In Delhi Ncr,noida100girls
 
Mondelez State of Snacking and Future Trends 2023
Mondelez State of Snacking and Future Trends 2023Mondelez State of Snacking and Future Trends 2023
Mondelez State of Snacking and Future Trends 2023Neil Kimberley
 
VIP Call Girl Jamshedpur Aashi 8250192130 Independent Escort Service Jamshedpur
VIP Call Girl Jamshedpur Aashi 8250192130 Independent Escort Service JamshedpurVIP Call Girl Jamshedpur Aashi 8250192130 Independent Escort Service Jamshedpur
VIP Call Girl Jamshedpur Aashi 8250192130 Independent Escort Service JamshedpurSuhani Kapoor
 
Lowrate Call Girls In Laxmi Nagar Delhi ❤️8860477959 Escorts 100% Genuine Ser...
Lowrate Call Girls In Laxmi Nagar Delhi ❤️8860477959 Escorts 100% Genuine Ser...Lowrate Call Girls In Laxmi Nagar Delhi ❤️8860477959 Escorts 100% Genuine Ser...
Lowrate Call Girls In Laxmi Nagar Delhi ❤️8860477959 Escorts 100% Genuine Ser...lizamodels9
 
Lowrate Call Girls In Sector 18 Noida ❤️8860477959 Escorts 100% Genuine Servi...
Lowrate Call Girls In Sector 18 Noida ❤️8860477959 Escorts 100% Genuine Servi...Lowrate Call Girls In Sector 18 Noida ❤️8860477959 Escorts 100% Genuine Servi...
Lowrate Call Girls In Sector 18 Noida ❤️8860477959 Escorts 100% Genuine Servi...lizamodels9
 
2024 Numerator Consumer Study of Cannabis Usage
2024 Numerator Consumer Study of Cannabis Usage2024 Numerator Consumer Study of Cannabis Usage
2024 Numerator Consumer Study of Cannabis UsageNeil Kimberley
 
Monte Carlo simulation : Simulation using MCSM
Monte Carlo simulation : Simulation using MCSMMonte Carlo simulation : Simulation using MCSM
Monte Carlo simulation : Simulation using MCSMRavindra Nath Shukla
 
Call Girls In Sikandarpur Gurgaon ❤️8860477959_Russian 100% Genuine Escorts I...
Call Girls In Sikandarpur Gurgaon ❤️8860477959_Russian 100% Genuine Escorts I...Call Girls In Sikandarpur Gurgaon ❤️8860477959_Russian 100% Genuine Escorts I...
Call Girls In Sikandarpur Gurgaon ❤️8860477959_Russian 100% Genuine Escorts I...lizamodels9
 
GD Birla and his contribution in management
GD Birla and his contribution in managementGD Birla and his contribution in management
GD Birla and his contribution in managementchhavia330
 
Call Girls In Panjim North Goa 9971646499 Genuine Service
Call Girls In Panjim North Goa 9971646499 Genuine ServiceCall Girls In Panjim North Goa 9971646499 Genuine Service
Call Girls In Panjim North Goa 9971646499 Genuine Serviceritikaroy0888
 
Call Girls Navi Mumbai Just Call 9907093804 Top Class Call Girl Service Avail...
Call Girls Navi Mumbai Just Call 9907093804 Top Class Call Girl Service Avail...Call Girls Navi Mumbai Just Call 9907093804 Top Class Call Girl Service Avail...
Call Girls Navi Mumbai Just Call 9907093804 Top Class Call Girl Service Avail...Dipal Arora
 
BEST Call Girls In Old Faridabad ✨ 9773824855 ✨ Escorts Service In Delhi Ncr,
BEST Call Girls In Old Faridabad ✨ 9773824855 ✨ Escorts Service In Delhi Ncr,BEST Call Girls In Old Faridabad ✨ 9773824855 ✨ Escorts Service In Delhi Ncr,
BEST Call Girls In Old Faridabad ✨ 9773824855 ✨ Escorts Service In Delhi Ncr,noida100girls
 
Call Girls In Connaught Place Delhi ❤️88604**77959_Russian 100% Genuine Escor...
Call Girls In Connaught Place Delhi ❤️88604**77959_Russian 100% Genuine Escor...Call Girls In Connaught Place Delhi ❤️88604**77959_Russian 100% Genuine Escor...
Call Girls In Connaught Place Delhi ❤️88604**77959_Russian 100% Genuine Escor...lizamodels9
 
Call Girls Pune Just Call 9907093804 Top Class Call Girl Service Available
Call Girls Pune Just Call 9907093804 Top Class Call Girl Service AvailableCall Girls Pune Just Call 9907093804 Top Class Call Girl Service Available
Call Girls Pune Just Call 9907093804 Top Class Call Girl Service AvailableDipal Arora
 

Recently uploaded (20)

Catalogue ONG NUOC PPR DE NHAT .pdf
Catalogue ONG NUOC PPR DE NHAT      .pdfCatalogue ONG NUOC PPR DE NHAT      .pdf
Catalogue ONG NUOC PPR DE NHAT .pdf
 
Grateful 7 speech thanking everyone that has helped.pdf
Grateful 7 speech thanking everyone that has helped.pdfGrateful 7 speech thanking everyone that has helped.pdf
Grateful 7 speech thanking everyone that has helped.pdf
 
Best Practices for Implementing an External Recruiting Partnership
Best Practices for Implementing an External Recruiting PartnershipBest Practices for Implementing an External Recruiting Partnership
Best Practices for Implementing an External Recruiting Partnership
 
Russian Faridabad Call Girls(Badarpur) : ☎ 8168257667, @4999
Russian Faridabad Call Girls(Badarpur) : ☎ 8168257667, @4999Russian Faridabad Call Girls(Badarpur) : ☎ 8168257667, @4999
Russian Faridabad Call Girls(Badarpur) : ☎ 8168257667, @4999
 
Regression analysis: Simple Linear Regression Multiple Linear Regression
Regression analysis:  Simple Linear Regression Multiple Linear RegressionRegression analysis:  Simple Linear Regression Multiple Linear Regression
Regression analysis: Simple Linear Regression Multiple Linear Regression
 
BEST Call Girls In Greater Noida ✨ 9773824855 ✨ Escorts Service In Delhi Ncr,
BEST Call Girls In Greater Noida ✨ 9773824855 ✨ Escorts Service In Delhi Ncr,BEST Call Girls In Greater Noida ✨ 9773824855 ✨ Escorts Service In Delhi Ncr,
BEST Call Girls In Greater Noida ✨ 9773824855 ✨ Escorts Service In Delhi Ncr,
 
Mondelez State of Snacking and Future Trends 2023
Mondelez State of Snacking and Future Trends 2023Mondelez State of Snacking and Future Trends 2023
Mondelez State of Snacking and Future Trends 2023
 
VIP Call Girl Jamshedpur Aashi 8250192130 Independent Escort Service Jamshedpur
VIP Call Girl Jamshedpur Aashi 8250192130 Independent Escort Service JamshedpurVIP Call Girl Jamshedpur Aashi 8250192130 Independent Escort Service Jamshedpur
VIP Call Girl Jamshedpur Aashi 8250192130 Independent Escort Service Jamshedpur
 
Lowrate Call Girls In Laxmi Nagar Delhi ❤️8860477959 Escorts 100% Genuine Ser...
Lowrate Call Girls In Laxmi Nagar Delhi ❤️8860477959 Escorts 100% Genuine Ser...Lowrate Call Girls In Laxmi Nagar Delhi ❤️8860477959 Escorts 100% Genuine Ser...
Lowrate Call Girls In Laxmi Nagar Delhi ❤️8860477959 Escorts 100% Genuine Ser...
 
Lowrate Call Girls In Sector 18 Noida ❤️8860477959 Escorts 100% Genuine Servi...
Lowrate Call Girls In Sector 18 Noida ❤️8860477959 Escorts 100% Genuine Servi...Lowrate Call Girls In Sector 18 Noida ❤️8860477959 Escorts 100% Genuine Servi...
Lowrate Call Girls In Sector 18 Noida ❤️8860477959 Escorts 100% Genuine Servi...
 
2024 Numerator Consumer Study of Cannabis Usage
2024 Numerator Consumer Study of Cannabis Usage2024 Numerator Consumer Study of Cannabis Usage
2024 Numerator Consumer Study of Cannabis Usage
 
Monte Carlo simulation : Simulation using MCSM
Monte Carlo simulation : Simulation using MCSMMonte Carlo simulation : Simulation using MCSM
Monte Carlo simulation : Simulation using MCSM
 
Call Girls In Sikandarpur Gurgaon ❤️8860477959_Russian 100% Genuine Escorts I...
Call Girls In Sikandarpur Gurgaon ❤️8860477959_Russian 100% Genuine Escorts I...Call Girls In Sikandarpur Gurgaon ❤️8860477959_Russian 100% Genuine Escorts I...
Call Girls In Sikandarpur Gurgaon ❤️8860477959_Russian 100% Genuine Escorts I...
 
GD Birla and his contribution in management
GD Birla and his contribution in managementGD Birla and his contribution in management
GD Birla and his contribution in management
 
Call Girls In Panjim North Goa 9971646499 Genuine Service
Call Girls In Panjim North Goa 9971646499 Genuine ServiceCall Girls In Panjim North Goa 9971646499 Genuine Service
Call Girls In Panjim North Goa 9971646499 Genuine Service
 
Call Girls Navi Mumbai Just Call 9907093804 Top Class Call Girl Service Avail...
Call Girls Navi Mumbai Just Call 9907093804 Top Class Call Girl Service Avail...Call Girls Navi Mumbai Just Call 9907093804 Top Class Call Girl Service Avail...
Call Girls Navi Mumbai Just Call 9907093804 Top Class Call Girl Service Avail...
 
BEST Call Girls In Old Faridabad ✨ 9773824855 ✨ Escorts Service In Delhi Ncr,
BEST Call Girls In Old Faridabad ✨ 9773824855 ✨ Escorts Service In Delhi Ncr,BEST Call Girls In Old Faridabad ✨ 9773824855 ✨ Escorts Service In Delhi Ncr,
BEST Call Girls In Old Faridabad ✨ 9773824855 ✨ Escorts Service In Delhi Ncr,
 
Call Girls In Connaught Place Delhi ❤️88604**77959_Russian 100% Genuine Escor...
Call Girls In Connaught Place Delhi ❤️88604**77959_Russian 100% Genuine Escor...Call Girls In Connaught Place Delhi ❤️88604**77959_Russian 100% Genuine Escor...
Call Girls In Connaught Place Delhi ❤️88604**77959_Russian 100% Genuine Escor...
 
KestrelPro Flyer Japan IT Week 2024 (English)
KestrelPro Flyer Japan IT Week 2024 (English)KestrelPro Flyer Japan IT Week 2024 (English)
KestrelPro Flyer Japan IT Week 2024 (English)
 
Call Girls Pune Just Call 9907093804 Top Class Call Girl Service Available
Call Girls Pune Just Call 9907093804 Top Class Call Girl Service AvailableCall Girls Pune Just Call 9907093804 Top Class Call Girl Service Available
Call Girls Pune Just Call 9907093804 Top Class Call Girl Service Available
 

Digital consumer - Digital Marketing Revolution

  • 1. The Digital Revolution: A Look Through the Marketer’s Lens April 2012 STATE OF THE MEDIA: U.S. Digital Consumer Report Q3-Q4, 2011
  • 2. Contents EXECUTIVE SUMMARY 3 DIGITAL REVOLUTION 4 AN IN-DEPTH LOOK AT THE U.S. DIGITAL CONSUMER 5 PLATFORMS FOR DIGITAL ACCESS 6 CROSS-PLATFORM VIDEO ENGAGEMENT 7 DIGITAL DIVERSITY 8 A BREAKDOWN OF DIGITAL TIME BY DEVICE 9 1 SCREEN, 2 SCREENS, BIG SCREENS, SMALL SCREENS 10 SOCIAL NETWORKING BY DEVICE 11 TO THINK IT IS TO BLOG IT 12 MARKETING TO THE DIGITAL CONSUMER 13 THE INCREASING POWER OF MOBILE COMMERCE 14 THE IN-HOME STREAMING EXPERIENCE 15 DAILY VIDEO VIEWING AROUND THE WORLD 16 THE GLOBAL ONLINE PERSPECTIVE 17 SOURCES 18 2
  • 3. EXECUTIVE SUMMARY Over the past ten years, the digital revolution has accelerated at an eye-opening pace. There are more platform choices than ever before, and Americans are consuming more content on more devices—often simultaneously. 274 million Americans now have Internet access—more than double the number with Internet access in 2000. Consumers have developed an insatiable appetite for social content, spending 81 billion minutes interacting with social networks and blogs in 2011. Apps have become all the rage, consuming 64 percent of consumers’ time on mobile devices. And multi-tasking has been taken to new levels, with 42 percent of tablet owners using them daily while watching television. With so many device choices and increased consumption levels, marketers and advertisers alike are faced with more complex decisions when it comes to maximizing their sales and advertising ROI. Determining the devices consumers are using, how receptive they are to ads, types of ads that resonate, and trust in advertising among online consumers are top of mind questions for today’s marketers. This report takes an in-depth look at the U.S. digital consumer and aims to answer the relevant questions marketers and advertisers need to know in order to succeed in today’s complex digital world. 3
  • 4. DIGITAL 274 MILLION AMERICANS HAVE INTERNET ACCESS MORE THAN DOUBLE THE NUMBER WITH INTERNET ACCESS IN 2000 REVOLUTION 81 BILLION MINUTES SPENT ON SOCIAL NETWORKS/BLOGS 64%OF MOBILE PHONE TIME IS SPENT ON APPS 42% OF TABLET OWNERS USE THEM DAILY WHILE WATCHING TV THE LAST NUMBER OF LAPTOPS SURPASSES DESKTOPS WITHIN TV HOMES 10 YEARS 2011 2009 SOCIAL NETWORKS/BLOGS BECOME TOP ONLINE DESTINATION Accounted for 9.2% of Internet time. Passed former top category, Email. 2008 Americans averaged 1 hour, 50 minutes watching video online 132.2 MILLION 2000 11 million Americans watched video on their mobile phones AMERICANS HAD INTERNET ACCESS DVD OVERTAKES 2007 NEARLY 30 MILLION 2002 AMERICANS ACCESSED VHS AS PREDOMINANT THE MOBILE WEB HOME VIDEO FORMAT DVD represented 2/3 of all units sold 2006 6.6 BILLION MINUTES SPENT ON 2005 3.2% OF MOBILE SUBSCRIBERS OWNED A SMARTPHONE MEMBER COMMUNITY SITES (NOW KNOWN AS SOCIAL NETWORKS/BLOGS) DEBUT OF BLU-RAY Top Member Community was MSN Spaces Discs offer increased storage capacity, (2 million unique U.S. visitors) high definition video and audio Source: Nielsen 4
  • 5. TV VIEWERS AN IN-DEPTH LOOK AT THE U.S. 49% MALE 51% FEMALE 23% 2 - 17 DIGITAL CONSUMER 23% 18 - 34 21% 35 - 49 20% 50 - 64 14% 65+ 16% HISPANIC 73% WHITE 13% BLACK, AFRICAN-AMERICAN 6% ASIAN OR PACIFIC ISLANDER TABLETS ARE THE ONLY DIGITAL CATEGORY TABLET OWNERS MALE 53% WHERE MALES MAKE ONLINE VIDEO VIEWERS UP THE MAJORITY FEMALE 47% 13 - 17 11% 47% MALE 18 - 34 33% 53% FEMALE 35 - 49 29% 14% 2 - 17 50 - 64 21% 27% 18 - 34 65+ 7% 28% 35 - 49 HISPANIC 15% 22% 50 - 64 WHITE 60% 10% 65+ BLACK, AFRICAN-AMERICAN 11% 12% HISPANIC ASIAN OR PACIFIC ISLANDER 9% 78% WHITE 11% BLACK, AFRICAN-AMERICAN 3% ASIAN OR PACIFIC ISLANDER SMARTPHONE OWNERS MALE 50% SOCIAL NETWORK/BLOG VISITORS FEMALE 50% 13 - 17 6% 46% MALE 39% 18 - 34 54% FEMALE 30% 35 - 49 13% 2 - 17 20% 50 - 64 27% 18 - 34 6% 65+ 28% 35 - 49 17% HISPANIC 22% 50 - 64 61% WHITE 9% 65+ 12% BLACK, AFRICAN-AMERICAN 12% HISPANIC ASIAN OR PACIFIC ISLANDER 6% 79% WHITE 10% BLACK, AFRICAN-AMERICAN 3% ASIAN OR PACIFIC ISLANDER Audience Composition % Audience Composition % Read as: Forty-nine percent of U.S. TV viewers are male Read as: Fifty-three percent of U.S. tablet owners are male Source: Nielsen 5
  • 6. PLATFORMS FOR 274.2 DIGITAL ACCESS Consumers have more choices than ever for accessing their digital content. MILLION AMERICANS As more devices become increasingly connected, the ability to access the HAVE INTERNET same pictures, videos or music files across multiple devices has become a valuable feature. ACCESS 165.9 MILLION PEOPLE 117.6 MILLION 169.6 WATCHED VIDEO ON A COMPUTER MOBILE INTERNET 12 VISITORS MILLION VISITORS TO 9 3 SOCIAL NETWORKS/BLOGS 5PM 6 APP USAGE AMONG 44% OF U.S. MOBILE SUBSCRIBERS OWN 76.6 ADULTS PEAKS A SMARTPHONE MILLION 58.6 TV HOMES ARE TIME SPENT USING TABLETS AT HOME MILLION TV 70% (30% OF TIME SPENT ON-THE-GO) HD CAPABLE (67%) HOMES HAVE DIGITAL CABLE (51%) CONTENT ACCESSED DAILY: (% OF TABLET OWNERS) 39% NEWS 34% SPORTS 47.4 MILLION MILLION TV HOMES HAVE 31% BOOKS TV HOMES 35.9 4 OR MORE TV SETS (31%) Source: Nielsen HAVE A DVR (41%) 6
  • 7. CROSS-PLATFORM MONTHLY TIME VIDEO ENGAGEMENT SPENT IN HOURS:MINUTES ASIAN RACE/ 5:47 With an array of online video content to choose from, consumers increased ETHNICITY their monthly online video time in 3Q 2011 by 7 percent from the same 9:28 period last year. 95:55 WHITE Watching Traditional TV Watching Video on Internet 3:37 AFRICAN- HISPANIC Mobile Subscribers Watching Video on a Mobile Phone 3:52 AMERICAN 142:05 5:30 4:20 6:11 6:29 116:46 109:15 113:46 205:56 125:48 2:24 4:25 7:33 125:55 N/A 6:30 5:25 6:30 4:20 143:22 12-17 2-11 18-24 4:35 25-34 3:19 MONTHLY TIME SPENT IN HOURS:MINUTES— 35-49 178:29 PER USER 2+ OF EACH MEDIUM 3:22 2:53 Q3 11 % Diff YOY 1 4 6:4 5 50-64 0.9% WATCHING TV IN THE HOME 203:50 1:48 2:35 4 :3 1 MONTHLY TIME 65+ SPENT IN 7.1% WATCHING VIDEO ON INTERNET HOURS:MINUTES 4 :2 0 2+ AGE 4:20 4:31 MOBILE SUBSCRIBERS WATCHING 146:45 VIDEO ON A MOBILE PHONE 0% Source: Nielsen 7
  • 8. DIGITAL DIVERSITY A look at digital across four distinct groups of U.S. consumers in October 2011 The YBF—Social Network with the highest concentration of this demo Reed Between the Lines (BET)—Top Primetime Cable Program 812 million total video streams AFRICAN- AMERICAN FEMALES 25-54 Spent 2.4 billion minutes watching video online 35.4 million total video streams Top Gaming App by Total Minutes: Words with Friends (211.8 million minutes) 29% downloaded games on their mobile phone 62% visited Facebook ASIAN FEMALES 12-17 57% accessed their mobile phone’s Web browser 20% accessed their mobile phone’s Web browser Spent 106.9 million minutes watching video online Spent 3.2 billion minutes watching video online 34% more likely than average to visit LinkedIn NCIS (CBS)—Top Primetime Broadcast Program 13.6 million total video streams Spent 2.2 billion minutes watching video online 164.2 million total video streams 69% own a smartphone 63% more likely than average to visit Myspace.com HISPANIC MALES 18-34 WHITE MALES 55+ 46% download apps on their mobile phone Source: Nielsen 8
  • 9. Other Apps 55.8% A BREAKDOWN OF SHARE OF MOBILE DIGITAL TIME BY DEVICE PHONE TIME BY Text During October 2011, YouTube was the top destination for online video Messaging Camera 1.1% FUNCTION 13.4% content, accounting for nearly half (45%) of Americans’ total streaming time, while Social Networks/Blogs garnered the most Internet time overall. The majority of mobile phone time was consumed by app usage with Social Networking apps accounting for the nearly 6 percent of Music/Video Apps Browser mobile time. 2.3% 11.1% Email/IM Dialer Social Networking Apps 5.3% 5.4% 5.5% AOL Media Network CBS VEVO 1.3% Social Networks/Blogs Hulu Entertainment 3.0% Websites 1.3% 21.3% Online Games 6.9% 7.7% E-mail Netflix 10.7% 6.5% Videos/Movies SHARE OF ONLINE SHARE OF INTERNET 4.3% VIDEO TIME BY TIME BY Portals 3.8% BRAND CATEGORY YouTube Other 44.7% Other 32.2% Source: Nielsen 56.5% 9
  • 10. 1 SCREEN, WHAT ARE TABLET AND SMARTPHONE OWNERS DOING WHILE WATCHING TV? 2 SCREENS, 57%EMAIL CHECKED BIG SCREENS, 44% UNRELATED INFO DURING PROGRAM SMALL SCREENS SURFED FOR 44% NETWORKING SITE VISITED SOCIAL More and more, consumers are multi-tasking across their various screens. Fifty-seven percent of smartphone and tablet owners checked email while watching a TV program—their top activity—and 44 percent visited a social networking site. 59%EMAIL CHECKED Advertisers wondering if consumers might miss their message should note that 19 percent of smartphone and tablet owners searched for product information and 16 percent looked up 44% UNRELATED INFO SURFED FOR DURING COMMERCIAL coupons or deals while the television was on. TOP WEBSITES VISITED WHILE WATCHING TV 44% NETWORKING SITE VISITED SOCIAL 45% USED A DOWNLOADED APPLICATION 1. Facebook 2. YouTube 6. Craigslist 7. eBay 34%SPORT SCORES CHECKED 3. Zynga 4. Google Search 8. Electronic Arts (EA) Online 9. MSN/WindowsLive/Bing 29% INFORMATION RELATED TO THE TV LOOKED UP 5. Yahoo! Mail 10. Yahoo! Homepage PROGRAM I WAS WATCHING 19% PRODUCT INFORMATION FOR AN AD I SAW LOOKED UP 16% COUPONS OR DEALS RELATED TO LOOKED UP Source: Nielsen AN ADVERTISEMENT I SAW ON TV 10
  • 11. SOCIAL NETWORKING METHODS USED TO ACCESS SOCIAL NETWORKING BY AGE BY DEVICE 18-34 35-54 55+ While nearly all social media users (97%) access social networking sites from their computers, NM Incite, a Nielsen McKinsey company, found that females are more likely than men to read social media content from their eReaders and men are more likely than women to access their social content from an Internet-enabled TV or gaming console. Mobile Phone 58.8% 36.3% 12.6% METHODS USED TO ACCESS SOCIAL NETWORKING eReader 2.9% 1.4% 0.6% BY GENDER iPad 4.5% 2.9% 2.4% Computer 95.7% 97.0% 97.0% 34.4% Mobile Phone 38.5% Internet-enabled TV 3.9% 1.2% 1.0% 0.8% eReader 2.3% Gaming Console 5.3% 2.9% 0.2% 3.4% iPad 3.1% 96.4% Computer 96.8% Handheld Music 2.4% 1.1% n/a Player 2.9% Internet-enabled TV 1.2% Other 1.0% 0.7% 1.3 3.6% Gaming Console 2.3% 0.8% Handheld Music Player 1.5% 1.1% Other 0.8% Source: NM Incite 11
  • 12. TO THINK IT SHARE OF SOCIAL MEDIA BUZZ AMONG SELECT OVER-THE-TOP VIDEO DEVICES IS TO BLOG IT (3Q 2011) READ AS: During 3Q 2011, Apple TV accounted for 29.3 percent of buzz mentions among the select group of over-the-top devices By the end of 2011, NM Incite, a Nielsen/McKinsey company, tracked over 181 million blogs around the world, up from 36 million in 2006. Three of the top Apple TV Roku ten social networks in the U.S. during October were true blogs (Blogger, WordPress.com, Tumblr), with a combined 80 million unique visitors. Among 29.3% 35.3% the top social networks, Tumblr has shown the strongest growth in visitors, more than doubling its audience from last year. Emerging Social Network: Pinterest • 4.5 million unique U.S. visitors during Oct 2011 – 37 times its size at the beginning of 2011 • Consumers ages 25-34 – most likely out of all age groups to view pages on Pinterest Boxee • 92 percent of Pinterest’s audience also visited a Mass Merchandiser site 7.6% during Oct 2011 MeeGo NUMBER OF BLOGS TRACKED BY NM INCITE 13.2% Google TV 14.7% Oct -11 173,000,000 TOP 10 U.S. SOCIAL NETWORKS/BLOGS BY UNIQUE AUDIENCE Oct -09 (Oct 2011, Home & Work Computers) 127,035,018 Oct -10 139.1M Facebook 6% Oct -08 148,452,047 46.3M Blogger 4% 78,703,197 UNIQUE VISITORS 26.0M Twitter.com 41% YOY % Change Oct-06 20.4M WordPress.com 13% 35,771,454 19.3M LinkedIn 63% Oct -07 61,353,334 13.8M Tumblr 128% 13.4M Myspace.com -63% 9.5M Google+ N/A 7.6M Wikia 28% Source: Nielsen and NM Incite 7.0M Squidoo 14% 12
  • 13. MARKETING TO THE 46% DIGITAL CONSUMER ADS ON TV 36% WHEN VIEWING ADS FEMALE 45% MALE 47% TV PROGRAM ON THEIR DEVICE: 52% PRODUCT PLACEMENTS FEMALE 35% TABLET SMARTPHONE BRANDED MALE 37% OWNERS OWNERS WEBSITES Clicked on ad to view the full ad or product offering FEMALE 52% MALE 51% ADS SERVED IN SEARCH 36% 24% 11% ENGINE RESULTS FEMALE 39% MALE 34% Made a purchase through their computer 23% 20% TRUST IN ADVERTISING Searched for more info about the business AMONG ONLINE ONLINE 21% 11% CONSUMERS VIDEO ADS FEMALE 34% MALE 30% 32% Used or requested a coupon % Who Trust 13% through the ad 7% ADS ON TEXT (SMS) SOCIAL ADS ON NETWORKS AMONG MOBILE MOBILE PHONES FEMALE 36% CONNECTED FEMALE 29% MALE 22% DISPLAY ADS MALE 28% 32% ONLINE DEVICE OWNERS: 26% (VIDEO OR BANNER) ON MOBILE DEVICES BANNER ADS FEMALE 34% 33% find ads that offer custom information FEMALE 31% MALE 23% MALE 24% based on their location useful 26% 29% 27% are more likely to look at ads if they have an interesting video 20% enjoy ads that have interactive features Source: Nielsen 13
  • 14. MOBILE SHOPPING ACTIVITIES IN THE PAST 30 DAYS THE INCREASING POWER OF MOBILE (% OF MOBILE SHOPPERS) Comparing prices online while shopping in a store 38% Browsing products through websites or apps 38% COMMERCE Reading online reviews Mobile is transforming into a powerful commerce tool, facilitating of products 32% consumer transactions and access to real-time information and deals. Searching for/using Twenty-nine percent of smartphone owners use their phone for online coupons 24% shopping-related activities and more than half of mobile users are repeat visitors to daily deal sites. The Groupon app is the 10th most popular app Purchasing products 22% on the iOS platform and ranks 22nd on Android devices. Scanning a barcode for price/product information 22% UNIQUE AUDIENCE FOR in millions Android Using location-based services DAILY DEAL APPS (OCT 2011) iOS to find a retail location 18% Placing a bid through an online auction 15% Groupon 4.8 6.1 Purchasing tickets to events 12% Visits per person: 11 Visits per person: 6 Purchasing music or video content 10% Paying for goods or services at point of sale 9% LivingSocial 1.2 2.4 Visits per person: 7 Visits per person: 4 Source: Nielsen 27% of male and 22% of female online consumers would use their mobile phones to make payments in restaurants 14 or shops if they could
  • 15. THE IN-HOME STREAMING EXPERIENCE 33% OF CONSUMERS STREAMED A MOVIE OR TV SHOW FROM THE INTERNET THROUGH A SUBSCRIPTION SERVICE The home entertainment landscape is becoming increasingly complex LIKE NETFLIX OR HULU PLUS as consumers are presented with a greater variety of ways to consume content, especially with the addition of digital streaming and movie downloads via the Internet. AUDIENCE COMPOSITION % FROM HOME COMPUTERS FEMALES ACCOUNT FOR 64% OF TOTAL TIME SPENT Male 43 WATCHING VIDEO CONTENT ON NETFLIX AND HULU 41 Female 57 59 HISPANICS ARE MUCH MORE LIKELY NETFLIX 2 - 17 18 9 TO WATCH VIDEO ON 18 - 34 40 31 THAN ON HULU 26 35 - 49 26 ASIANS 13 50 - 64 23 NETFLIX 4 STREAM MORE VIDEOS ON HULU 65+ 11 HULU Hispanic 16 THAN ON NETFLIX 11 76 HULU White 79 Black or African- 10 VIEWERS ARE MORE LIKELY American 11 Asian or Pacific Islander 3 3 BACHELOR'S OR TO HAVE A POST-GRAD DEGREE 18% THAN NETFLIX VIEWERS PAID TO DOWNLOAD downloaded to rent 14% downloaded MORE THAN A THIRD A MOVIE OR TV SHOW to own OF HULU'S AUDIENCE IS OVER THE AGE OF 50 FROM THE INTERNET (% OF CONSUMERS) Source: Nielsen 15
  • 16. % Mobile Phone Online Consumers Who Watch Video Handheld Multimedia Device On Device Daily In-Home Video Game System INDEX V. GLOBAL AVERAGE DAILY VIDEO VIEWING AROUND THE WORLD Nielsen’s survey of more than 25,000 online respondents from 56 countries around the world reveals consumers’ multi-screen video habits. GLOBAL Tablet Device Index reads as: During 3Q 2011, online consumers in Asia Pacific were 46 percent more likely than the average global consumer to watch video on their mobile phone daily. EUROPE 15% 6% 4% 3% 28% 11% 8% 6% 54 55 50 43 NORTH AMERICA LATIN AMERICA 20% 13% 8% 6% 71 29% 10% 6% 6% 118 100 86 104 91 75 86 MIDDLE EAST, AFRICA, PAKISTAN ASIA PACIFIC 37% 12% 11% 9% 132 41% 15% 9% 9% 109 138 129 146 136 113 129 Source: Nielsen 16
  • 17. THE GLOBAL SWITZERLAND US ONLINE # 1 GOOGLE 2 3 4 Facebook YouTube MSN/WindowsLive/Bing 1 # GOOGLE 2 Facebook 3 4 Yahoo! MSN/WindowsLive/Bing 5 YouTube PERSPECTIVE 5 Microsoft 6 Bluewin 6 Microsoft 7 Wikipedia 7 AOL Media Network 8 Apple 8 Wikipedia 1 9 Apple TOP 10 WEB BRANDS BY UNIQUE 9 Local.ch 10 Ask Search Network 10 search.ch AUDIENCE (Oct 2011, Home & Work Computers ) # GOOGLE YOUTUBE is a top ten GERMANY BRAZIL online destination in all 2 Facebook 2 MSN/WindowsLive/Bing of the countries 1 3 YouTube # 4 5 eBay Microsoft 3 4 Facebook UOL JAPAN 1 GOOGLE 5 YouTube 1 6 Amazon 2 Google 6 Microsoft 3 FC2 7 MSN/WindowsLive/Bing 7 Terra 8 Wikipedia 8 Globo.com # GOOGLE # YAHOO! 4 YouTube 9 T-Online 5 Rakuten 9 Orkut 6 Wikipedia 10 Web.de 10 Yahoo! 7 Microsoft AUSTRALIA 8 goo 1 FACEBOOK is among the top three sites in every 2 Facebook 9 Ameba 10 Amazon 1 country except Japan (the country's top two social networking 3 NineMSN/MSN sites, FC2 and Ameba, are among the top 10 most-visited overall) 4 YouTube # GOOGLE # GOOGLE 5 Microsoft 6 7 Yahoo!7 Wikipedia SPAIN 1 8 Apple 2 MSN/WindowsLive/Bing ITALY 2 Facebook # GOOGLE 9 10 eBay Blogger 3 4 Facebook YouTube 3 YouTube 5 Microsoft 4 MSN/WindowsLive/Bing 6 Blogger 5 Virgilio 7 Yahoo! 6 Libero FRANCE UK 8 Wikipedia 1 7 Microsoft 9 Elmundo.es 2 Facebook 2 Facebook 10 WordPress.com 8 Yahoo! 3 MSN/WindowsLive/Bing 9 Wikipedia 4 Microsoft # GOOGLE 3 4 MSN/WindowsLive/Bing BBC 10 Blogger 5 YouTube 5 YouTube 6 Orange 6 Yahoo! GOOGLE is the top Web brand 7 Wikipedia 7 Amazon 8 Free 8 eBay in each country except Japan Source: Nielsen 9 PagesJaunes 9 Microsoft 10 Yahoo! 10 Wikipedia 17
  • 18. SOURCES Originally Issued as State of the Media: U.S. Digital Consumer Report 8 • Online Video Streams and Total Minutes: VideoCensus (Total), Oct 2011 • Social Networking: NetView (Total), Oct 2011 • TV Programs: NPOWER, Oct 2011, Live+SD. Excludes Breakouts, Q3-Q4, 2011 in March 2012 specials, Sports, programs less than 5 minutes in duration and 4 • 2000: NetView (Home & Work), Jan 2000 programs with less than three telecasts • • 2002: VideoScan, 2002 2005: NetView (Home & Work), Oct 2005 9 • Mobile Phone: Smartphone Analytics, Oct 2011 • Online Video: VideoCensus (Total), Oct 2011 • 2006: Mobile Insights, 3Q 2006 • Internet: NetView (Total), Oct 2011 • 2007: Mobile Insights, Jan 2007 • 2008: VideoCensus (Home & Work), Jan 2008 10 • Activities while watching TV: Mobile Connected Device Report, 3Q 2011 Mobile Media Marketplace, 3Q 2008 • 2009: NetView (Home & Work), May 2009 • Top sites visited while watching TV: NPOWER (Cross-Platform “The Switch from Analog to Digital TV,” Nov 2009 Homes), Oct 2011 • 2011: NetView (Total), Oct 2011 Smartphone Analytics, Oct 2011 11 • NM Incite, State of Social Media Survey, April 2011 Mobile Connected Device Report, 3Q 2011 NPOWER (NPM Sample), Aug 2011 12 • Top U.S. Social Networks/Blogs and Pinterest: NetView (Home & Work), Oct 2011 • Blog trend: NM Incite, Oct 2006-2011 5 • TV Viewers: National UEs and MarketBreaks 2012 • Over-the-Top device buzz: NM Incite, 3Q 2011 • Online Video Viewers: VideoCensus (Total), Oct 2011 • • Social Network/Blog Visitors: NetView (Total), Oct 2011 Tablet Owners: Mobile Insights, 3Q 2011 13 • Trust in Advertising: Nielsen Global Survey, 3Q 2011 • Among smartphone, tablet and connected mobile device owners: • Smartphone Owners: Mobile Insights, 3Q 2011 Mobile Connected Device Report, 3Q 2011 6 Mobile 14 • Mobile Shopping Activities: Mobile Insights, Oct 2011 • Mobile Internet Visitors: Mobile Insights, 3Q 2011 • Daily Deal Apps: Smartphone Analytics, Oct 2011 • Smartphone Penetration: Mobile Insights, Oct 2011 • Mobile Payments (red circle): Nielsen Global Survey, 3Q 2011 (U.S.) • Peak App Usage: Smartphone Analytics (Android), Oct 2011 Internet • Internet Access and Social Network/Blog Visitors: NetView (Total), 15 • Netflix/Hulu: VideoCensus (Home), Oct 2011 • Downloading and streaming behaviors: New Media Tracking, Jan 2012 Oct 2011 • Video Viewers: VideoCensus (Total), Oct 2011 TV 16 • Nielsen Global Survey, 3Q 2011 • National Media Related UEs, Nov 2011 17 • Nielsen NetView (Home & Work), Oct 2011 7 • Cross-Platform Report 3Q 2011. 18
  • 19. ABOUT NIELSEN Nielsen Holdings N.V. (NYSE: NLSN) is a global information and measurement company with leading market positions in marketing and consumer information, television and other media measurement, online intelligence, mobile measurement, trade shows and related properties. Nielsen has a presence in approximately 100 countries, with headquarters in New York, USA and Diemen, the Netherlands. For more information, visit www.nielsen.com. 19
  • 20. Copyright © 2012 The Nielsen Company. All rights reserved. Nielsen and the Nielsen logo are trademarks or registered trademarks of CZT/ ACN Trademarks, L.L.C. Other product and service names are trademarks or registered trademarks of their respective companies. 12/4377 20