Brand Digital Asset Analysis (Facebook FansPage & Twitter)
•
5 likes•52,137 views

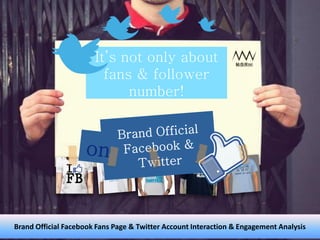
It's not only about fans and follower number. Interaction and Engagement rate are important key for brand facebook and twitter account. Understand your fans/follower can help you maximize your account. You can monitor your competitor too!

More Related Content
Viewers also liked
Viewers also liked (20)
Similar to Brand Digital Asset Analysis (Facebook FansPage & Twitter)
Similar to Brand Digital Asset Analysis (Facebook FansPage & Twitter) (6)
More from Master of Business Administration SBM-ITB
More from Master of Business Administration SBM-ITB (16)
Recently uploaded
Recently uploaded (20)
Brand Digital Asset Analysis (Facebook FansPage & Twitter)
- 1. It’s not only about fans & follower number! Brand Official Facebook Fans Page & Twitter Account Interaction & Engagement Analysis
- 2. Our Method 1. Tacking & Analyzing 3 official Twitter & Facebook automotive brand accounts in Indonesia; Toyota, Suzuki, Daihatsu 2. Catch the last 3200 twitter conversations for the following attributes : * Analyze by date of conversation, time of conversation, Follower, location and number of re-tweeted post 3. Catch in 2 weeks period of Facebook conversations for the following attributes : * Analyze by date of conversation, time of conversation, Like, Comment and Response Time •Analyze qualilatively from the social media data. Disclaimer : All analysis conduct without administrator access
- 3. research
- 4. ToyotaID SuzukiIndonesia DaihatsuInd Date of Account 2009-08-10 2010-11-12 2009-11-02 03:32:42 Creation 01:59:50 09:41:43 Number of Followers 29.115 14.488 2.867 Number of Unique 26.922 12.295 674 Followers % of Real Followers 92% 85% 24% Number of Friends 22.767 63 23 Number of Posted 14.449 2690 4.070 Status Peer Index 26 22 22 Quick Fact : 1. Toyota & Suzuki have high percentage of unique follower, strong indicator that they are the true brand loyalist 2. Suzuki and Daihatsu have fewer friends, could indicates : - They didn’t do much direct conversation with followers - They didn’t do follow back activity 3. Based on peer index, they are fairly low level of engagement
- 5. Follower statistic Quick Fact : Toyota has the highest average daily follower growth in number : 23 new, but in percentage Daihatsu is the highest : 0,4% per day
- 6. analysis Quick Fact : 1. Most of the follower comes from Jakarta, followed by Bandung, Surabaya, Yogyakarta and the rest of the city 2. Daihatsu does not have many follower outside of Jakarta
- 7. Quick Fact : 1. Most tweet about Toyota occured at 2 PM 2. Most tweet about Suzuki occured at 4 PM 3. Most tweet about Daihatsu occured at 11PM Time of Conversation Analysis
- 8. Quick Fact : 1. Toyota gets most retweet at 2 PM 2. Suzuki gets most retweet at 5 PM PM 3. Daihatsu gets most retweet at 4 AM Time of Conversation Analysis
- 9. Quick Fact : 1. Most tweet about Toyota occured on Tuesday 2. Most tweet about Suzuki occured on Friday 3. Most tweet about Daihatsu occured on Saturday Time of Conversation Analysis
- 10. Quick Fact : 1. Toyota gets most retweet on Tuesday 2. Suzuki gets most retweet on Saturday 3. Daihatsu gets most retweet on Sunday Time of Conversation Analysis
- 11. DaihatsuInd SuzukiIndonesia ToyotaID # of POST # of RT # of POST # of RT # of POST # of RT 12 AM 3 0 0 0 0 0 1 AM 5 4 0 0 0 0 2 AM 3 0 1 0 3 3 3 AM 14 2 0 0 0 0 4 AM 22 22 8 6 0 0 5 AM 37 3 4 0 0 0 6 AM 48 1 0 0 1 0 7 AM 35 1 23 11 0 0 8 AM 111 7 2 5 0 0 9 AM 143 5 48 2 0 0 10 AM 288 7 160 80 0 0 Explanation: 11 AM 174 4 89 7 0 0 • Post Value (PV) : # of RT / # 12 PM 240 9 128 19 0 0 of Post 1 PM 164 4 60 3 40 5 • # of Post : Number of 2 PM 423 12 332 19 2215 260 Conversation 3 PM 383 12 238 16 677 67 • # of RT : Number of 4 PM 145 5 771 25 17 1 Retweeted Post 5 PM 90 17 194 290 88 20 6 PM 44 1 60 0 58 0 7 PM 25 1 110 0 0 0 8 PM 65 2 52 0 0 0 9 PM 36 1 65 3 0 0 10 PM 89 2 0 0 0 0 11 PM 613 17 345 71 101 13
- 12. username ToyotaID suzukiindonesia daihatsuindonesia Name ToyotaID Suzuki Indonesia Daihatsu Indonesia Like_count 51585 25291 42042 Talking 1664 513 623 About_count Percentage 3,2% 2% 1,5% Quick Fact : 1. Toyota has the most number of fans, followed by Daihatsu and Suzuki 2. Toyota has the highest percentage of talking about this, followed by Suzuki and Daihatsu
- 13. Quick Fact : Toyota has the highest average daily follower growth in number : 136 new, with growth percentage : 0,26% per day Fans Page statistic
- 14. Quick Fact : 1. Toyota gets most Like at 7 & 8 AM 2. Suzuki rarely gets Like on the status 3. Daihatsu gets most Like at 8 AM & 5 PM
- 15. Quick Fact : 1. Toyota gets most Comment at 8 AM 2. Suzuki rarely gets Comment on the status 3. Daihatsu gets most Comment at 7 AM & 5 PM
- 16. Quick Fact : 1. Toyota gets most Like on Friday 2. Suzuki rarely gets Like on the status 3. Daihatsu gets most Like on Tuesday
- 17. Quick Fact : 1. Toyota gets most Comment on Monday & Friday 2. Suzuki rarely gets Comment on the status 3. Daihatsu gets most Comment on Tuesday & Thusday
- 18. Quick Fact : 1. Toyota gets most Like on March March 2nd, 2012 Post like 2. Suzuki rarely gets Like on the status 3. Daihatsu gets most Like on March 6th, 2012 by date
- 19. Quick Fact : Post 1. Toyota gets most Comment on March 2nd & 5th, 2012 2. Suzuki rarely gets Like on the status comments 3. Daihatsu gets most Like on Feb 28th & March 1st, 2012 by date
- 20. Quick Fact : 1. Most favorable interaction on Toyota is Status 2. Most favorable interaction on Suzuki is Talking Link 3. Daihatsu gets higher talking about than About post Toyota by type
- 21. Note : Periode 24 Februari 2012 – 10 Maret 2012 Quick Fact : 1. Average response time for fans is more than 4 hours 2. Suzuki never response their fans
- 22. Social media has changed the communication between brand and consumer. Nowadays communications are two ways communication and horizontally. The consumer's perception over your product is determined by other consumer's experience sharing about the product, not determined by your promotion material and advertising anymore. MediaWave is the first Social Media Monitoring & Analytics Platform in Indonesia. MediaWave helps you to observe and measures the consumer perception upon your brand in Social Media. We provide you the most valuable insight directly from consumer voice Find more about us at www.mediawave.biz Contact us : - contact@mediawave.co.id / @mediawave_id - yose@mediawave.co.id / @yoseazka - erik@mediawave.co.id / @erikpalupi - dwi@mediawave.co.id / @dwiwahyono
- 23. Thank you