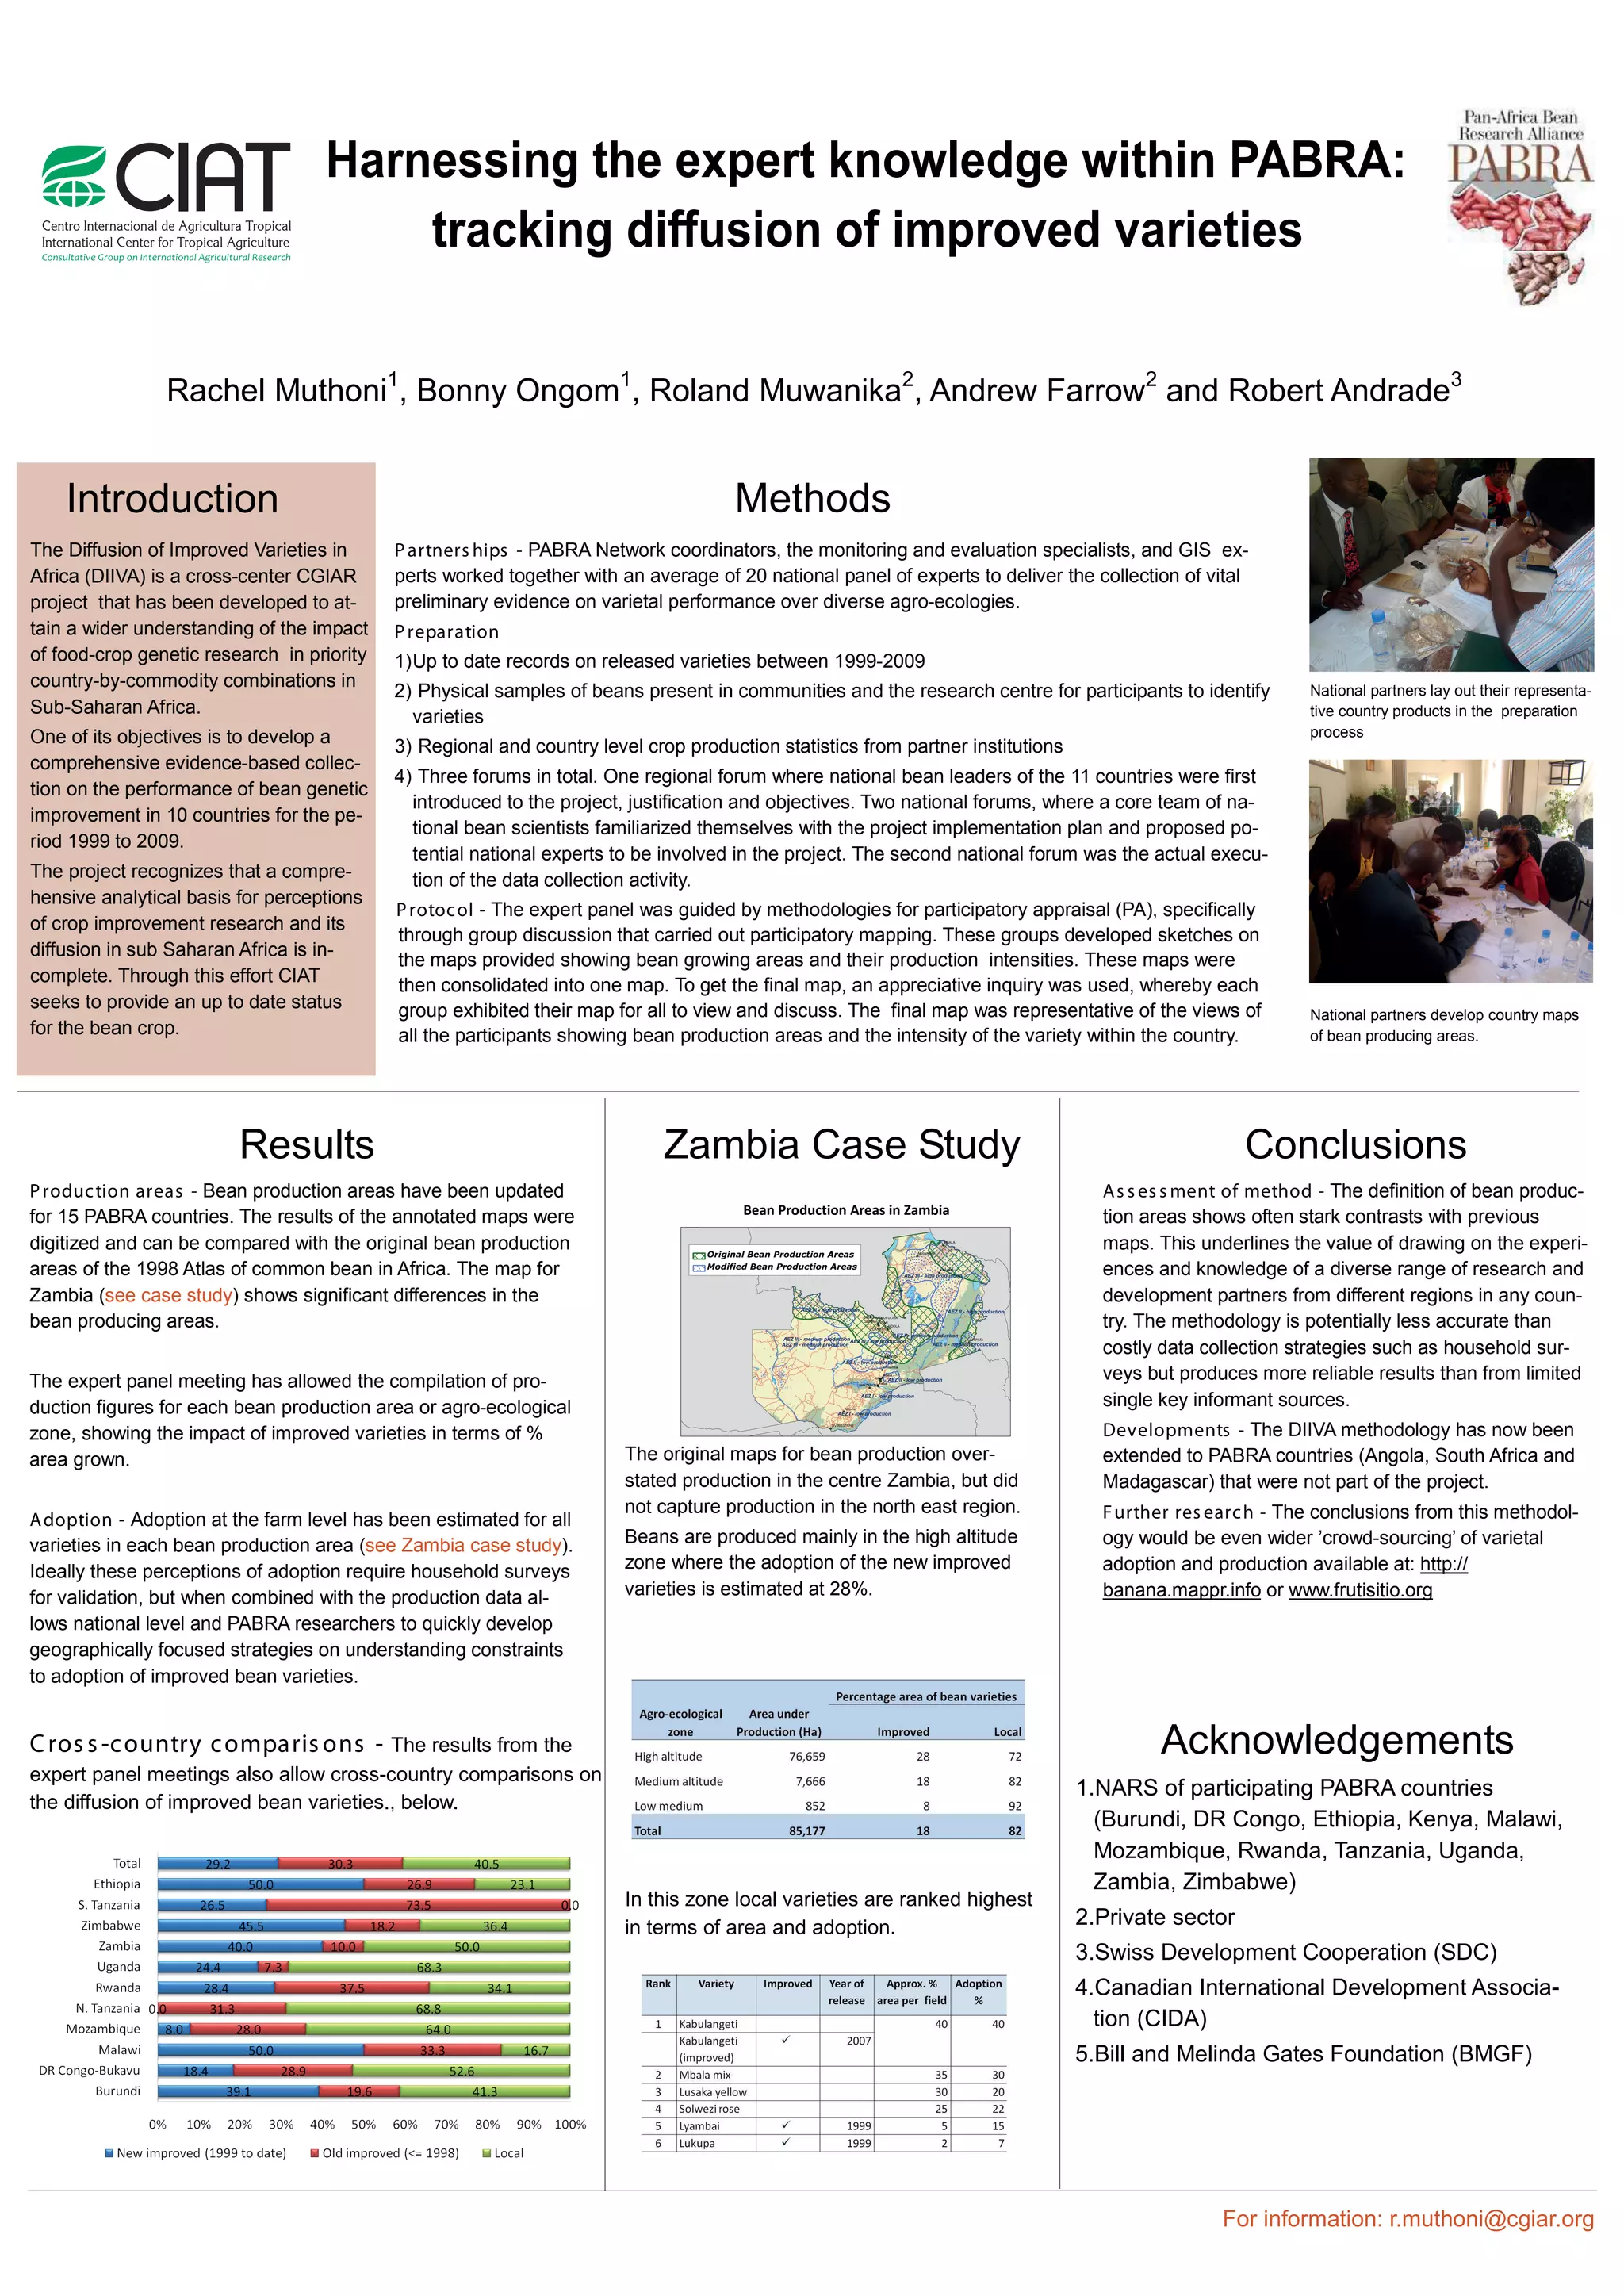
Harnessing the expert knowledge within PABRA:
                                       tracking diffusion of improved varieties

                                            1                          1                                  2                             2                                       3
                Rachel Muthoni , Bonny Ongom , Roland Muwanika , Andrew Farrow and Robert Andrade


    Introduction                                                                     Methods
The Diffusion of Improved Varieties in      P artners hips - PABRA Network coordinators, the monitoring and evaluation specialists, and GIS ex-
Africa (DIIVA) is a cross-center CGIAR      perts worked together with an average of 20 national panel of experts to deliver the collection of vital
project that has been developed to at-      preliminary evidence on varietal performance over diverse agro-ecologies.
tain a wider understanding of the impact    P reparation
of food-crop genetic research in priority   1) Up to date records on released varieties between 1999-2009
country-by-commodity combinations in
                                            2) Physical samples of beans present in communities and the research centre for participants to identify       National partners lay out their representa-
Sub-Saharan Africa.                                                                                                                                        tive country products in the preparation
                                              varieties
One of its objectives is to develop a                                                                                                                      process
                                            3) Regional and country level crop production statistics from partner institutions
comprehensive evidence-based collec-
                                            4) Three forums in total. One regional forum where national bean leaders of the 11 countries were first
tion on the performance of bean genetic
                                              introduced to the project, justification and objectives. Two national forums, where a core team of na-
improvement in 10 countries for the pe-
                                              tional bean scientists familiarized themselves with the project implementation plan and proposed po-
riod 1999 to 2009.
                                              tential national experts to be involved in the project. The second national forum was the actual execu-
The project recognizes that a compre-         tion of the data collection activity.
hensive analytical basis for perceptions
                                            P rotoc ol - The expert panel was guided by methodologies for participatory appraisal (PA), specifically
of crop improvement research and its
                                            through group discussion that carried out participatory mapping. These groups developed sketches on
diffusion in sub Saharan Africa is in-
                                            the maps provided showing bean growing areas and their production intensities. These maps were
complete. Through this effort CIAT          then consolidated into one map. To get the final map, an appreciative inquiry was used, whereby each
seeks to provide an up to date status       group exhibited their map for all to view and discuss. The final map was representative of the views of        National partners develop country maps
for the bean crop.                          all the participants showing bean production areas and the intensity of the variety within the country.        of bean producing areas.


                         Results                                            Zambia Case Study                                                       Conclusions
P roduc tion areas - Bean production areas have been updated                                                                       A s s es s ment of method - The definition of bean produc-
for 15 PABRA countries. The results of the annotated maps were                                                                     tion areas shows often stark contrasts with previous
digitized and can be compared with the original bean production                                                                    maps. This underlines the value of drawing on the experi-
areas of the 1998 Atlas of common bean in Africa. The map for                                                                      ences and knowledge of a diverse range of research and
Zambia (see case study) shows significant differences in the                                                                       development partners from different regions in any coun-
bean producing areas.                                                                                                              try. The methodology is potentially less accurate than
                                                                                                                                   costly data collection strategies such as household sur-
The expert panel meeting has allowed the compilation of pro-                                                                       veys but produces more reliable results than from limited
duction figures for each bean production area or agro-ecological                                                                   single key informant sources.
zone, showing the impact of improved varieties in terms of %                                                                       Developments - The DIIVA methodology has now been
area grown.                                                             The original maps for bean production over-                extended to PABRA countries (Angola, South Africa and
                                                                        stated production in the centre Zambia, but did            Madagascar) that were not part of the project.
                                                                        not capture production in the north east region.           F urther res earc h - The conclusions from this methodol-
A doption - Adoption at the farm level has been estimated for all
varieties in each bean production area (see Zambia case study).         Beans are produced mainly in the high altitude             ogy would be even wider ’crowd-sourcing’ of varietal
Ideally these perceptions of adoption require household surveys         zone where the adoption of the new improved                adoption and production available at: http://
for validation, but when combined with the production data al-          varieties is estimated at 28%.                             banana.mappr.info or www.frutisitio.org
lows national level and PABRA researchers to quickly develop
geographically focused strategies on understanding constraints
to adoption of improved bean varieties.


C ros s -c ountry c omparis ons - The results from the                                                                                      Acknowledgements
expert panel meetings also allow cross-country comparisons on
                                                                                                                                 1.NARS of participating PABRA countries
the diffusion of improved bean varieties., below.
                                                                                                                                   (Burundi, DR Congo, Ethiopia, Kenya, Malawi,
                                                                                                                                   Mozambique, Rwanda, Tanzania, Uganda,
                                                                                                                                   Zambia, Zimbabwe)
                                                                        In this zone local varieties are ranked highest
                                                                        in terms of area and adoption.                           2.Private sector
                                                                                                                                 3.Swiss Development Cooperation (SDC)
                                                                                                                                 4.Canadian International Development Associa-
                                                                                                                                   tion (CIDA)
                                                                                                                                 5.Bill and Melinda Gates Foundation (BMGF)


                                                                                                                                                 For information: r.muthoni@cgiar.org

Diffusion of Improved Varieties

  • 1.
    Harnessing the expertknowledge within PABRA: tracking diffusion of improved varieties 1 1 2 2 3 Rachel Muthoni , Bonny Ongom , Roland Muwanika , Andrew Farrow and Robert Andrade Introduction Methods The Diffusion of Improved Varieties in P artners hips - PABRA Network coordinators, the monitoring and evaluation specialists, and GIS ex- Africa (DIIVA) is a cross-center CGIAR perts worked together with an average of 20 national panel of experts to deliver the collection of vital project that has been developed to at- preliminary evidence on varietal performance over diverse agro-ecologies. tain a wider understanding of the impact P reparation of food-crop genetic research in priority 1) Up to date records on released varieties between 1999-2009 country-by-commodity combinations in 2) Physical samples of beans present in communities and the research centre for participants to identify National partners lay out their representa- Sub-Saharan Africa. tive country products in the preparation varieties One of its objectives is to develop a process 3) Regional and country level crop production statistics from partner institutions comprehensive evidence-based collec- 4) Three forums in total. One regional forum where national bean leaders of the 11 countries were first tion on the performance of bean genetic introduced to the project, justification and objectives. Two national forums, where a core team of na- improvement in 10 countries for the pe- tional bean scientists familiarized themselves with the project implementation plan and proposed po- riod 1999 to 2009. tential national experts to be involved in the project. The second national forum was the actual execu- The project recognizes that a compre- tion of the data collection activity. hensive analytical basis for perceptions P rotoc ol - The expert panel was guided by methodologies for participatory appraisal (PA), specifically of crop improvement research and its through group discussion that carried out participatory mapping. These groups developed sketches on diffusion in sub Saharan Africa is in- the maps provided showing bean growing areas and their production intensities. These maps were complete. Through this effort CIAT then consolidated into one map. To get the final map, an appreciative inquiry was used, whereby each seeks to provide an up to date status group exhibited their map for all to view and discuss. The final map was representative of the views of National partners develop country maps for the bean crop. all the participants showing bean production areas and the intensity of the variety within the country. of bean producing areas. Results Zambia Case Study Conclusions P roduc tion areas - Bean production areas have been updated A s s es s ment of method - The definition of bean produc- for 15 PABRA countries. The results of the annotated maps were tion areas shows often stark contrasts with previous digitized and can be compared with the original bean production maps. This underlines the value of drawing on the experi- areas of the 1998 Atlas of common bean in Africa. The map for ences and knowledge of a diverse range of research and Zambia (see case study) shows significant differences in the development partners from different regions in any coun- bean producing areas. try. The methodology is potentially less accurate than costly data collection strategies such as household sur- The expert panel meeting has allowed the compilation of pro- veys but produces more reliable results than from limited duction figures for each bean production area or agro-ecological single key informant sources. zone, showing the impact of improved varieties in terms of % Developments - The DIIVA methodology has now been area grown. The original maps for bean production over- extended to PABRA countries (Angola, South Africa and stated production in the centre Zambia, but did Madagascar) that were not part of the project. not capture production in the north east region. F urther res earc h - The conclusions from this methodol- A doption - Adoption at the farm level has been estimated for all varieties in each bean production area (see Zambia case study). Beans are produced mainly in the high altitude ogy would be even wider ’crowd-sourcing’ of varietal Ideally these perceptions of adoption require household surveys zone where the adoption of the new improved adoption and production available at: http:// for validation, but when combined with the production data al- varieties is estimated at 28%. banana.mappr.info or www.frutisitio.org lows national level and PABRA researchers to quickly develop geographically focused strategies on understanding constraints to adoption of improved bean varieties. C ros s -c ountry c omparis ons - The results from the Acknowledgements expert panel meetings also allow cross-country comparisons on 1.NARS of participating PABRA countries the diffusion of improved bean varieties., below. (Burundi, DR Congo, Ethiopia, Kenya, Malawi, Mozambique, Rwanda, Tanzania, Uganda, Zambia, Zimbabwe) In this zone local varieties are ranked highest in terms of area and adoption. 2.Private sector 3.Swiss Development Cooperation (SDC) 4.Canadian International Development Associa- tion (CIDA) 5.Bill and Melinda Gates Foundation (BMGF) For information: r.muthoni@cgiar.org