The document describes Rayleigh's equation for differential distillation and provides equations to model vapor-liquid equilibrium for different conditions. Specifically, it presents equations for:
1) Constant relative volatility where the equilibrium relationship is expressed as a function of vapor and liquid compositions.
2) An activity coefficient model where the vapor pressure is a linear function of liquid composition.
3) An activity coefficient model where the vapor pressure is a quadratic function of liquid composition.
4) A graphical integration method to use with experimental vapor-liquid equilibrium data provided in tabular form.
Beginners Guide to TikTok for Search - Rachel Pearson - We are Tilt __ Bright...
Differential distillation
1. Differential Distillation
Rayleigh Equation
dL dxi
L
( yi xi )
……… (1)
Integrating:
L1 x
dL i1 dxi
L x ( yi xi )
Lo
io
i1 x
L dxi
ln 1 ……… (2)
Lo xio ( yi xi )
Where:
Lo Initial amount of liquid in pot, moles ,
L1 Remaining amount of liquid in pot, moles ,
dL Amount of liquid vaporized in time d
dx i , dy i Change in concentration for time interval d
Solution of the relation depends on the form of the equilibrium relationship: yi f ( xi )
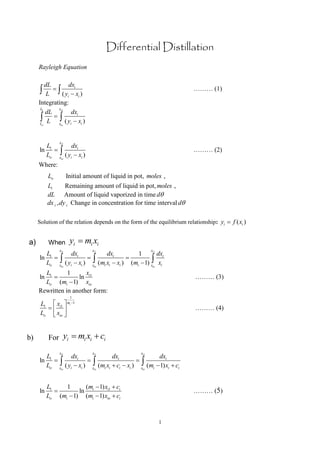
a) When yi mi xi
xi1 i1 x i1x
L dxi dxi 1 dx
ln 1 xi i
Lo xio ( yi xi ) xio (mi xi xi ) (mi 1) xio
L1 1 x
ln ln i1 ……… (3)
Lo (mi 1) xio
Rewritten in another form:
1
L1 xi1 mi 1
……… (4)
Lo xio
b) For yi mi xi ci
i1 x i1 x x
i1
L dxi dxi dxi
ln 1
Lo xio ( yi xi ) xio (mi xi ci xi ) xio (mi 1) xi ci
L1 1 (m 1) xi1 ci
ln ln i ……… (5)
Lo (mi 1) (mi 1) xio ci
1
2. c) When the relative volatility ij is constant and the equilibrium expressed is as:
ij xi
yi
1 ( ij 1) xi
i1 x i1 x
L dx i dx i
ln 1
Lo x io ( y i x i ) x io ij x i
( xi )
1 ( ij 1)x i i
xi1
(1 ( ij 1)x i )dx i xi1
(1 ( ij 1) x i )dx i
x
x io i ( ij 1 ij x i x i )
x io
x i ( ij 1)(1 x i )
xi1
dxi
xi1
(ij 1) xi dxi
xio
xi (ij 1)(1 xi ) xio xi (ij 1)(1 xi )
i1 x i1 x
1 dxi dxi
xi (1 xi ) x (1 xi )
(ij 1) xio
io
The integration becomes:
L1 1 1 xio xi1 1 xio
ln ln ln
Lo (ij 1) 1 xi1 xio 1 xi1
1 1 xio xi1 1 xio
ln (ij 1) ln
(ij 1) 1 xi1 xio 1 xi1
1 xi1 1 xio
ln ij ln
( ij 1) xio 1 xi1
And finally:
L1 1 xi1 1 xi1
ln ln ij ln ……… (6)
Lo (ij 1) xio 1 xio
2
3. d) Graphical integration is applied when the equilibrium data ( xi , yi ) is given in tabular
form:
1
For each equilibrium point ( xi , yi ) the value is calculated:
yi xi
1
xi yi yi xi
yi xi
- - - -
- - - -
- - - -
1
A plot of versus [ xi ] is then made and the area under the curve between [ xi1 ] and
yi xi
L
[ xio ] gives ln 1 .
Lo
3