Download to read offline

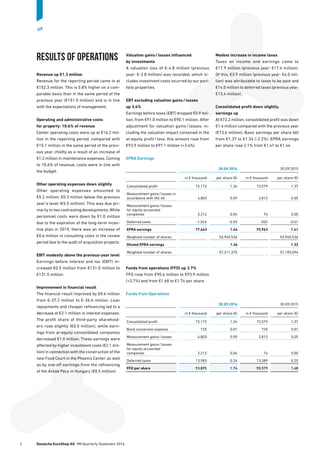
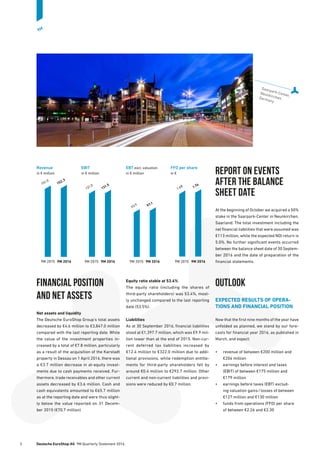
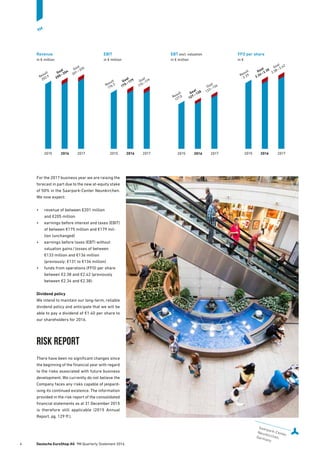
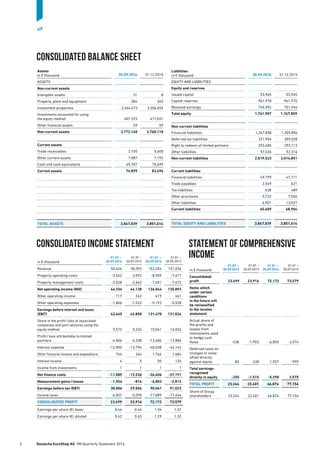
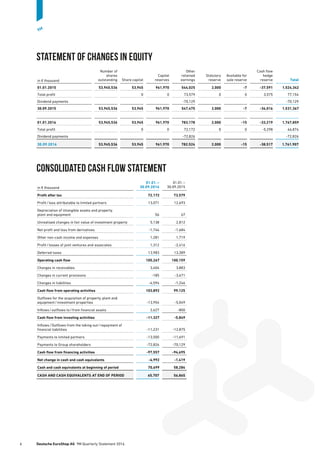
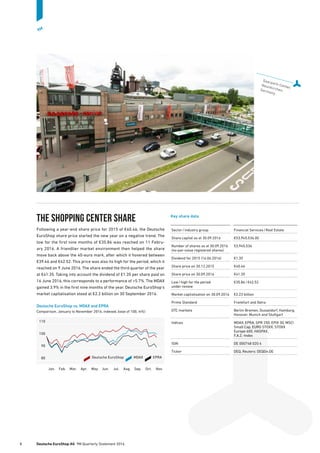

- Revenue for Deutsche EuroShop increased slightly by 0.8% to €152.3 million in the first three quarters of 2016. EBIT also increased modestly by 0.3% to €131.5 million. - Consolidated profit was down 1.9% to €72.2 million due to higher investment costs, however EPRA earnings per share rose 2.1% to €1.44. Funds from operations improved by 3.6% to €1.74 per share. - Deutsche EuroShop acquired a 50% stake in the Saarpark-Center in Neunkirchen in early October and expects revenue and FFO per share to increase slightly in 2017 from this


![[Webinar] Wyszukiwanie słów kluczowych do kampanii SEO.](https://cdn.slidesharecdn.com/ss_thumbnails/webinar-14-160114203116-thumbnail.jpg?width=640&height=640&fit=bounds)


