
Recommended
More Related Content
Viewers also liked
Similar to design kick off - Visualisierung der Megatrends bis 2100
Similar to design kick off - Visualisierung der Megatrends bis 2100 (18)
Recently uploaded
Recently uploaded (20)
design kick off - Visualisierung der Megatrends bis 2100
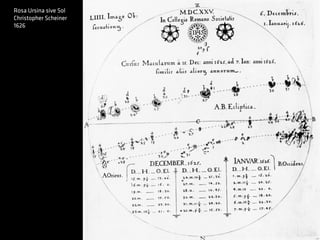
- 1. Rosa Ursina sive Sol Christopher Scheiner 1626
- 2. Commercial and Political Atlas William Playfair 1786
- 3. Rosa Ursina sive Sol Christopher Scheiner 1626
- 4. Diagram of the Causes of Mortality Florence Nightingale ~1855
- 6. Piktogrammsystem für die olympischen Spiele 1972 in München Otto Aicher 1976-1972
- 7. Visual Display of Quantitative Information Edward R Tufte 1982 link
- 9. Similar Diversity Philipp Steinweber & Andreas Koller 2008 http://similardiversity.net/project/ http://similardiversity.net/project/
- 13. Travel Time Tube Map Tom Carden 2009 http://www.tom-carden.co.uk/p5/tube_map_travel_times/applet/ http://www.tom-carden.co.uk/p5/tube_map_travel_times/applet/
- 15. Poetry On The Road 2003 Boris Müller 2003
- 16. Poetry On The Road 2003 Boris Müller 2003 http://www.esono.com/boris/projects/poetry03/visualpoetry03/visualpoetry.html
- 17. Just Landed - 36 Hours Jer Thorp 2009 https://vimeo.com/4587178 https://vimeo.com/4587178
- 18. Every Playboy Centerfold, The Decades (normalized) Jason Salavon 2002
- 19. Science and Popular Science Magazines 1872 - 1922 Lev Manovich, 2009
- 20. The Preservation of Favored Traces by Ben Fry (2009) http://benfry.com/traces/
- 21. We interrupt your regularly scheduled program… Osman Khan & Daniel Sauter 2003
- 22. a visualization of global weather conditions Cameron Beccario
- 23. Google Public Data search link
- 24. more tools, books & insides http://www.statsilk.com http://creately.com https://www.moovly.com/ http://mindthegraph.com http://www.creativeapplications.net/processing/geometry-textures-shaders-processing-tutorial/ http://www.schrockguide.net/infographics-as-an-assessment.html https://www.taschen.com/pages/en/catalogue/graphic_design/all/04984/ gallery.information_graphics.htm http://onformative.com/work/book-generative-gestaltung