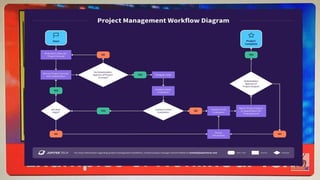
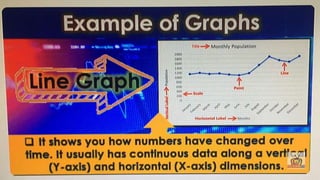
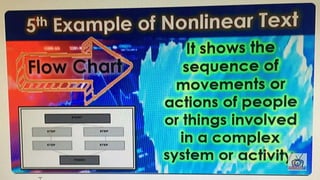
ENGLISH 8 QUARTER 2 WEEK
1: VISUAL VERBAL
RELATIONSHIP
ENGR. MICHAEL A. VILLAPAZ, RCHE/LPT-MATHEMATICS
JUNIOR HIGH SCHOOL TEACHER 1
LINABO INTEGRATED SCHOOL
BAR GRAPH
LINE GRAPH
FLOW CHART
TABLE
PIE GRAPH
A. Limay and
Mariveles
B. Silang and Carmona
C. Cainta, Binangonan,
and Tanay
D. None of the above
A. Yes, I will go
because she might
get offended if I
won’t.
B. No I will not go
because my father
will be mad at me.
C. Yes, I will go
because I will be
following the health
protocols.
D. No, I will not go
because I might get
infected considering
their area is a hot
spot.
A. It is therefore
concluded that the
highest percentage of
effectiveness of Covid-
19 prevention is tested
and seen in the
countries of US and
Germany
B. It is therefore
concluded that the
highest percentage
of effectiveness of
Covid-19 prevention
is from Russia.
C. It is therefore
concluded that the
highest percentage of
effectiveness of Covid-
19 prevention is tested
and seen in the
countries of Sweded
and Germany
D. All of the above
S.Y. 2019-
2020
S.Y. 2020-
2021
Percentage
2391 1626 68.01%
2182 1634 74.89%
2077 1655 79.68%
1853 1533 82.73%
75 33 44.00%
A. The number of
enrollees has no big
difference.
B. The enrollment for
SY 2020-2021 is less
than SY 2019-2020
due to pandemic.
C. The enrollment for
the SY 2020- is mostly
the same as SY 2019-
2020
D. All of the above
A. Online Distance
Learning
B. Modular Distance
Learning
C. Radio and Television
D. All of the above
A. Bar Graph
B. Line Graph
C. Pie Graph
D. Pictograph
A. Linear Text
B. Nonlinear Text
C. Textbook
D. None of the
above
A. Graph
B. Map
C. Caption Graphic
D. Flow Chart
A. Bar Graph
B. Table
C. Caption Graphic
D. Flow Chart
Fact Bluff
Derivative of trigonometric function.pptx

Derivative of trigonometric function.pptx

  • 1.
    ENGLISH 8 QUARTER2 WEEK 1: VISUAL VERBAL RELATIONSHIP ENGR. MICHAEL A. VILLAPAZ, RCHE/LPT-MATHEMATICS JUNIOR HIGH SCHOOL TEACHER 1 LINABO INTEGRATED SCHOOL
  • 3.
  • 4.
  • 5.
  • 6.
  • 7.
  • 41.
    A. Limay and Mariveles B.Silang and Carmona C. Cainta, Binangonan, and Tanay D. None of the above
  • 42.
    A. Yes, Iwill go because she might get offended if I won’t. B. No I will not go because my father will be mad at me. C. Yes, I will go because I will be following the health protocols. D. No, I will not go because I might get infected considering their area is a hot spot.
  • 43.
    A. It istherefore concluded that the highest percentage of effectiveness of Covid- 19 prevention is tested and seen in the countries of US and Germany B. It is therefore concluded that the highest percentage of effectiveness of Covid-19 prevention is from Russia. C. It is therefore concluded that the highest percentage of effectiveness of Covid- 19 prevention is tested and seen in the countries of Sweded and Germany D. All of the above
  • 44.
    S.Y. 2019- 2020 S.Y. 2020- 2021 Percentage 23911626 68.01% 2182 1634 74.89% 2077 1655 79.68% 1853 1533 82.73% 75 33 44.00% A. The number of enrollees has no big difference. B. The enrollment for SY 2020-2021 is less than SY 2019-2020 due to pandemic. C. The enrollment for the SY 2020- is mostly the same as SY 2019- 2020 D. All of the above
  • 45.
    A. Online Distance Learning B.Modular Distance Learning C. Radio and Television D. All of the above
  • 47.
    A. Bar Graph B.Line Graph C. Pie Graph D. Pictograph
  • 48.
    A. Linear Text B.Nonlinear Text C. Textbook D. None of the above
  • 49.
    A. Graph B. Map C.Caption Graphic D. Flow Chart
  • 50.
    A. Bar Graph B.Table C. Caption Graphic D. Flow Chart
  • 51.