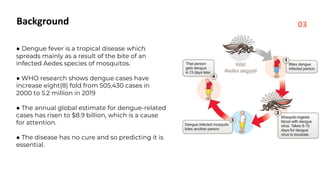
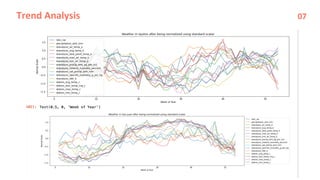
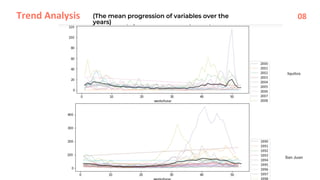
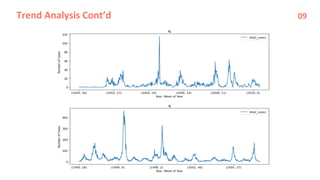
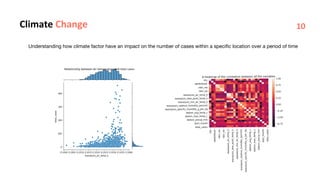
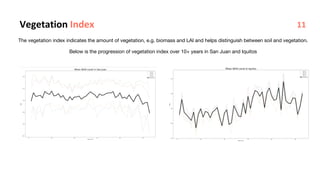
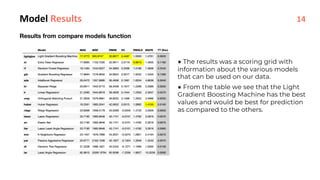
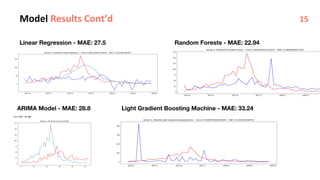
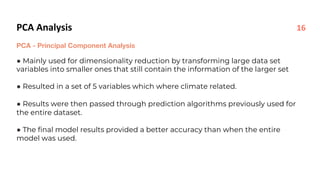
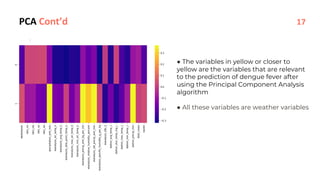
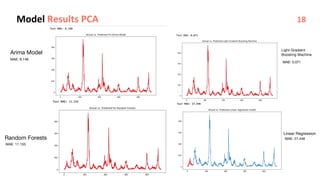
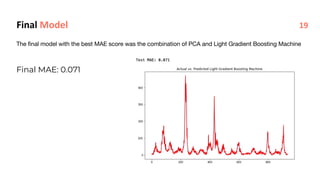
2. 02
This Project aims to understand the underlining variables that affect the spread
of dengue fever and to predict disease incidences within a specific area
Aim of Project
3. Background
● Dengue fever is a tropical disease which
spreads mainly as a result of the bite of an
infected Aedes species of mosquitos.
● WHO research shows dengue cases have
increase eight(8) fold from 505,430 cases in
2000 to 5.2 million in 2019
● The annual global estimate for dengue-related
cases has risen to $8.9 billion, which is a cause
for attention.
● The disease has no cure and so predicting it is
essential.
03
4. Breakdown of PROJECT
Trend Analysis Model Development
Understand the trends and
progressions of the disease
within a specific area
Investigate the impact of
climate change on the spread
of Dengue fever
Develop a model for predicting
the number of cases within a
specific area
Climate Change
04
5. Related Works
• A model created by the Word Health Organization to predict dengue fever in
the early 2000’s
• A model developed by Nurul et al. using Support Vector Machines (SVM)
produced a sensitivity of 14%, specificity of 95%, and precision of 56%.
• A combination of Support Vector Regression (SVR) with Baidu Search Index
allowed Gou et al. to develop a model with a higher accuracy than that
produced by the SVM model
• Research showed that exploring the impact of population density and
vegetation around the area could help improve the prediction.
05
6. • The dengue fever data was obtained from secondary research conducted by NOAA's
(National Oceanic and Atmospheric Administration) GHCN (Global historical
climatology network detail) and combined with medical records on dengue cases
from Peru and Puerto Rico.
• The dataset consisted of climate and vegetation index variables from 1990 to 2010
with 1456 entries.
• Data consists of cases from both San Juan and Iquitos
• Some variables from the data set include; Precipitation, Humidity and Air
temperature.
The Data 06
10. Climate Change
Understanding how climate factor have an impact on the number of cases within a specific location over a period of time
10
11. Vegetation Index
The vegetation index indicates the amount of vegetation, e.g. biomass and LAI and helps distinguish between soil and vegetation.
Below is the progression of vegetation index over 10+ years in San Juan and Iquitos
11
12. ● Pythons PyCaret library was used for data exploration and model development
● Data was split into training and testing sets.
● We used pythons Normalise function to normalise all rows in our dataset for more accurate
prediction
● Python's setup function, was used to initialise the training environment and create the
transformation pipeline
● Compare_models() was employed to find all possible models that could predict the number of
dengue cases
● For testing, the model was trained with data from Iquitos and then tested with data from
San Juan Puerto Rico
Model Development Process 12
13. MAE (Mean Absolute Error)
● The MAE is being used as the benchmark for determining which model performs better
because it is the average magnitude of errors in a specific forecast without considering
the direction.
● For this project, the competition site also states the MAE score should be used to
determine which model is better.
● A lower MAE score means the model is better at predicting since it means a lower
13
14. Model Results
Results from compare models function
● The results was a scoring grid with
information about the various models
that can be used on our data.
● From the table we see that the Light
Gradient Boosting Machine has the best
values and would be best for prediction
as compared to the others.
14
15. Model Results Cont’d
Linear Regression - MAE: 27.5
ARIMA Model - MAE: 28.8 Light Gradient Boosting Machine - MAE: 33.24
Random Forests - MAE: 22.94
15
16. PCA Analysis
PCA - Principal Component Analysis
● Mainly used for dimensionality reduction by transforming large data set
variables into smaller ones that still contain the information of the larger set
● Resulted in a set of 5 variables which where climate related.
● Results were then passed through prediction algorithms previously used for
the entire dataset.
● The final model results provided a better accuracy than when the entire
model was used.
16
17. PCA Cont’d
● The variables in yellow or closer to
yellow are the variables that are relevant
to the prediction of dengue fever after
using the Principal Component Analysis
algorithm
● All these variables are weather variables
17
18. Model Results PCA
Arima Model
Light Gradient
Boosting Machine
Random Forests
Linear Regression
MAE: 8.148
MAE: 0.071
MAE: 11.155
MAE: 27.446
18
19. The final model with the best MAE score was the combination of PCA and Light Gradient Boosting Machine
Final Model
Final MAE: 0.071
19
20. • Available data shows evidence of the existence of dengue in 34 African
countries, and the Aedes Aegypti mosquito, which is the primary vector
for the spread of dengue is known to be present in all but 5 African
countries
• Race may be a factor is the resilience to dengue as research done in
Cuba in 1981 shows how a significant proportion of the country’s black
people survived the dengue outbreak while white individuals were
disproportionately susceptible to the dengue infection as well as fatality
• Research also shows that travellers may be more susceptible to catching
the disease as compared to locals, but it is not clear if partial immunity
amongst the locals may be responsible for this phenomenon.
Implication on Africa 20
21. • This project could be used as the foundation for developing a real-
time malaria parasite detection system and other mosquito-related
diseases.
• Using data from Africa to test and improve the model.
• The development of an early warning system for dengue fever in a
variety of countries would help in planning and the allocation of
resources for tackling this disease.
Future Work 21