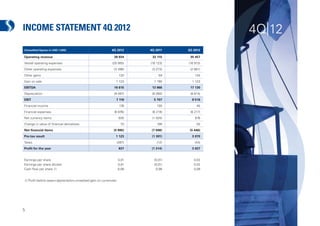
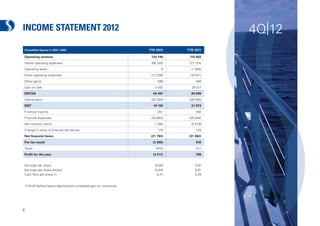
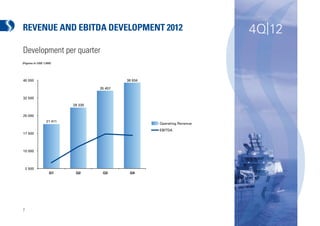
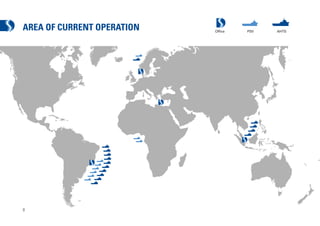
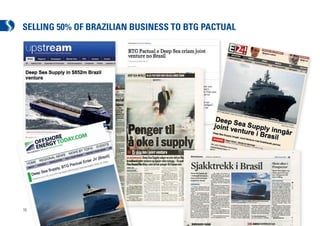
SlideShare a Scribd company logo
4Q|12
Deep Sea Supply Plc
    Presentation
  27 February 2013
HIGHLIGHTS                                                  4Q|12
•   Announcing joint venture in Brazil

•   Increased revenue, but soft North Sea spot market and
    late commencement Sea Brasil

•   New long term contracts in Asia

•   New medium term contracts in Brazil


3
SHARE PRICE DEVELOPMENT AND SHARE TURNOVER


                     Share price and total return since listing                                                                                                                                                                    2012 average monthly volume and turnover velocity


                           Close Price            Total Return
                40                                                                                                                                                                                                                             0,04                                                                                                                     50


                                                                                                                                                                                                                                                                                                                                                                             Average monthly volume in NOK million (light blue line)
                                                                                                                                                                                                                                                                                                                                                                        45


                                                                                                                                                                                       Traded shares per month / Average shares outstanding
                35                                                                                                                                                                                                                            0,035

                                                                                                                                                                                                                                                                                                                                                                        40
                30                                                                                                                                                                                                                             0,03
                                                                                                                                                                                                                                                                                                                                                                        35

                25                                                                                                                                                                                                                            0,025
                                                                                                                                                                                                                                                                                                                                                                        30
NOK per share


                20                                                                                                                                                                                                                             0,02                                                                                                                     25


                                                                                                                                                                                                                                                                                                                                                                        20
                15                                                                                                                                                                                                                            0,015

                                                                                                                                                                                                                                                                                                                                                                        15
                10                                                                                                                                                                                                                             0,01
                                                                                                                                                                                                                                                                                                                                                                        10

                 5                                                                                                                                                                                                                            0,005
                                                                                                                                                                                                                                                                                                                                                                        5


                 0Sep-05   Jan-06 May-06 Sep-06 Jan-07 May-07 Sep-07 Jan-08 May-08 Sep-08 Jan-09 May-09 Sep-09 Jan-10 May-10 Sep-10 Jan-11 May-11 Sep-11 Jan-12 May-12 Sep-12 Jan-13
                                                                                                                                                                                                                                                  0                                                                                                                     0
                                                                                                                                                                                                                                                      Deep Sea     DOF ASA   Siem Offshore      Havila         Solstad        Farstad        Eidesvik    REM Offshore
                                                                                                                                                                                                                                                      Supply PLC                 Inc.        Shipping ASA   Offshore ASA   Shipping ASA   Offshore ASA      ASA


                     4
INCOME STATEMENT 4Q 2012                                                                         4Q|12
(Unaudited figures in USD 1,000)                             4Q 2012        4Q 2011    3Q 2012

Operating revenue                                             38 934        32 115     35 457
Vessel operating expenses                                    (20 065)      (16 123)   (16 913)
Other operating expenses                                      (3 496)       (3 273)    (2 681)
Other gains                                                         120         59        143
Gain on sale                                                   1 123         1 190      1 123
EBITDA                                                        16 615        13 966     17 130
Depreciation                                                  (9 497)       (8 260)    (8 614)
EBIT                                                               7 118     5 707      8 516
Financial income                                                    176        130         45
Financial expenses                                            (6 876)       (6 219)    (6 217)
Net currency items                                                  635     (1 025)       676
Change in value of financial derivatives                              70        106         50
Net financial items                                            (5 995)      (7 008)     (5 446)
Pre-tax result                                                 1 123        (1 301)     3 070
Taxes                                                              (287)       (12)       (43)
Profit for the year                                                  837    (1 314)      3 027


Earnings per share                                                 0,01      (0,01)      0,02
Earnings per share diluted                                         0,01      (0,01)      0,02
Cash flow per share 1)                                              0,08       0,06       0,09


1) Profit before taxes+depreciation-unrealized gain on currencies


5
INCOME STATEMENT 2012                                                                      4Q|12
(Unaudited figures in USD 1,000)                                    YTD 2012    YTD 2011

Operating revenue                                                   124 140     115 902
Vessel operating expenses                                           (66 345)    (72 124)
Operating lease                                                           0      (1 684)
Other operating expenses                                            (12 356)    (10 911)
Other gains                                                             566         499
Gain on sale                                                          4 492      29 017
EBITDA                                                               50 497      60 699
Depreciation                                                        (32 304)    (28 826)
EBIT                                                                 18 193      31 873
Financial income                                                        351         392
Financial expenses                                                  (23 802)    (26 004)
Net currency items                                                    1 483      (5 579)
Change in value of financial derivatives                                 175         129
Net financial items                                                  (21 793)    (31 062)
Pre-tax result                                                       (3 599)        810
Taxes                                                                  (912)        (21)
Profit for the year                                                   (4 511)        789


Earnings per share                                                    (0,04)       0,01
Earnings per share diluted                                            (0,04)       0,01
Cash flow per share 1)                                                  0,21        0,28


1) Profit before taxes+depreciation-unrealized gain on currencies


6
REVENUE AND EBITDA DEVELOPMENT 2012                                       4Q|12
Development per quarter
(Figures in USD 1,000)


40 000                                       38 934

                                    35 457

32 500
                           28 339


25 000
                  21 411
                                                      Operating Revenue
                                                      EBITDA
17 500


10 000


    2 500
                    Q1      Q2       Q3       Q4


7
AREA OF CURRENT OPERATION   Office   PSV   AHTS


8
CASH FLOW STATEMENT                                                                  4Q|12
(Unaudited figures in USD 1,000)                              YTD 2012    YTD 2011

Cash flows from operating activities
Cash generated from operations                                 47 985      16 725


Net cash generated from operations                             47 985      16 725


Cash flows from investing activities
Acquisitions and upgrades of property, plant and equipment     -92 186     -74 410
Disposals of property, plant and equipment                          0     136 860
Net cash used in investing activities                         -92 186      62 450


Cash flows from financing activities
Interest paid                                                  -20 774    -26 559
Proceeds from borrowings                                      105 349      72 767
Repayments of borrowings                                      -40 270    -126 996
Net cash used in financing activities                           44 305     -80 788


Total changes in liquidity in the Year                            104      -1 613


Cash and cash equivalents at beginning of Year                 40 318      41 932


Cash and cash equivalents at end of Year                       40 422      40 318


9
BALANCE SHEET                                                                                                      3Q|11
(Unaudited figures in USD 1,000)       31.12.2012   31.12.2011   (Unaudited figures in USD 1,000)                    31.12.2012   31.12.2011

Non-current assets                                              Liabilities
Vessels cost                            638 977      554 935    Borrowings                                           468 579      403 299
                                                                CIRR loan                                             35 509       37 790
Construction contract                         0       17 659    Deferred gain                                         27 157       31 561
Equipment                                   822          643    Long term tax liabilities                                  0          873
Total property, plant and equipment     639 799      573 237    Other long term liabilities                              195          124
                                                                Total long term liabilities                          531 439      473 647
Deferred income tax                         605          308    Borrowings                                            40 436       38 143
Other long term receivables                 327          647    CIRR loan                                              5 215        4 839
Investment in associates                  1 194          594    Trade and other payables                              23 667       13 307
CIRR deposit                             35 558       37 796    Deferred gain                                          4 658        4 812
Total non-current assets                677 483      612 582    Tax payable                                            1 266          881
                                                                Other short term liabilities                           1 660          400
Current assets                                                  Total short term liabilities                          76 903       62 382
Inventories                               2 679        5 062    Total liabilities                                    608 342      536 029
Other short term receivables              9 541        6 468
CIRR deposit                              5 215        4 839    Shareholders equity
Freight income not received               30 010      29 475    Share capital, share premium and treasury shares      11 445       11 205
Cash and cash equivalents                40 423       40 318    Retained earnings and other reserves                 145 564      151 510
Total current assets                     87 867       86 162    Total shareholders equity                            157 007      162 714


Total assets                            765 350      698 744    Total equity and liablities                          765 350      698 744


10
SHAREHOLDERS                                                                                      4Q|12
The largest shareholders as per 21st February 2013 registered in VPS

                                                          Citizen      No. of shares:        %

HEMEN HOLDING LIMITED                                       CYP           44 583 853    35,05%
SKAGEN KON-TIKI                                            NOR            12 229 431     9,61%
PERESTROIKA AS                                             NOR             5 453 897     4,29%
DNB NOR MARKETS                                            NOR             3 360 105     2,64%
JPMCB RE SVENSKA HANDELSBANKEN                             SWE             2 168 050     1,70%
HOLBERG NORGE                                              NOR             2 162 486     1,70%
UBS AG                                                      GBR            1 715 679     1,35%
UTHALDEN A/S                                               NOR             1 575 000     1,24%
NORDEA BANK NORGE ASA                                      NOR             1 470 000     1,16%
CENTRA INVEST AS                                           NOR             1 421 643     1,12%
PACTUM AS                                                  NOR             1 325 000     1,04%
ANAXO CAPITAL AS                                           NOR             1 220 000     0,96%
DNB NOR SMB                                                NOR             1 000 000     0,79%
SOLSTEN INVESTMENT FUND                                     GER              900 000     0,71%
DELPHI Norge                                               NOR               900 000     0,71%
MORGAN STANLEY & CO                                         USA              805 367     0,63%
BNP PARIBAS                                                 FRA              800 000     0,63%
MP PENSJON PK                                              NOR               658 800     0,52%
LØREN HOLDING                                              NOR               620 626     0,49%
VERDIPAPIRFONDET HANDELSBANKEN                             SWE               600 000     0,47%


Total 20 largest shareholders:                                            84 969 937    66,80%
Total other shareholders:                                                 42 227 257    33,20%
Total number of shares:                                                  127 197 194    100,00%


11
CONTRACT BACKLOG                                                                                         4Q|12
Contract Backlog Deep Sea Supply Fleet as per Feb 2013*
  Vessel Type                    Vessels on Term Contracts as of 01.02.13   Contract backlog

  AHTS                           10 of 14 Vessels                           USD 200M
  PSV                             9 of 9 Vessels                            USD 127M
  Total                          19 of 23 Vessels                           USD 327M

*Excluding Sea Weasel, which is owned by Malaysian J.V.


Expected revenue from term contracts per quarter
(Figures in USD 1,000)     AHTS          PSV


40 000                     40 000

35 000                     35 000

30 000                     30 000

25 000                     25 000

20 000                     20 000

15 000                     15 000

10 000                     10 000

  5000                       5000

        0                         0
                  Q1 - 13                    Q1 - 13
                                            Q2 - 13            Q2 - 13
                                                              Q3 - 13        Q3 - 13
                                                                            Q4 - 13            Q4 - 13


12
FLEET LIST & CHARTER STATUS AS PER FEBRUARY 2013
 Vessel         Type            Bhp/Dwt     Year Built   Trading Area                                             2013                            2014

 AHTS Vessels                                                                       Q1                Q2                 Q3             Q4

 Sea Lynx       KMAR 404        15000 BHP     1999       North Sea          North Sea Spot

 Sea Bear       KMAR 404        15000 BHP     1999       Brazil/North Sea                    Repsol                           North Sea Spot

 Sea Tiger      KMAR 404        15000 BHP     1999       Brazil                              Repsol

 Sea Panther    KMAR 404        15000 BHP     1999       Brazil
 Sea Leopard    KMAR 404        15000 BHP     1998       Brazil             Vanco                          Vanco

 Sea Cheetah    Khiam Chuan     15000 BHP    2007        Brazil             Petrobras

 Sea Jaguar     Khiam Chuan     15000 BHP    2007        Brazil             Petrobras

 Sea Ocelot     Khiam Chuan     10800 BHP    2007        Asia
 Sea Eagle I    Khiam Chuan     12000 BHP    2009        Malaysia           Malaysia

 Sea Weasel     Seatech P-729   6500 BHP     2009        Malaysia
 Sea Fox        Seatech P-729   6800 BHP      2011       Brazil             Petrobras

 Sea Jackal     Seatech P-729   6800 BHP      2011       Brazil             Petrobras

 Sea Badger     Seatech P-729   6800 BHP      2011       Asia               PTTEP

 Sea Vixen      Seatech P-729   6800 BHP      2011       Brazil             Petrobras

 Sea Stoat      Seatech P-729   6800 BHP      2011       Brazil             Petrobras

 PSVs
 Sea Trout      VS 470MK II     3250 DWT     2007        North Sea          EnQuest

 Sea Angler     PSV UT 755 L    3250 DWT     2007        W.Africa           ENI Congo

 Sea Halibut    PSV UT 755 L    3250 DWT     2007        Brazil             Petrobras

 Sea Pike       PSV UT 755 L    3250 DWT     2007        Brazil             Petrobras

 Sea Bass       PSV UT 755 L    3250 DWT     2008        Brazil             Petrobras

 Sea Pollock    PSV UT 755 L    3250 DWT     2008        Brazil             Petrobras

 Sea Turbot     PSV UT 755 L    3250 DWT     2008        Brazil             Petrobras

 Sea Witch      PSV UT 755 L    3250 DWT     2008        W.Africa           ENI Congo

 Sea Brasil     STX 09CD        4700 DWT      2012       Brazil             BP

                                                                                                           Firm                   Option       Spot
13
AGE DISTRIBUTION CURRENT FLEET AND ORDER BOOK
                   AHTS                                      PSV
                   Vessel > 20 years: 27 % of total fleet
                                        ,7                   Vessel > 20 years: 20,1% of total fleet
                   Vessel > 30 years: 14,9 % of total fleet   Vessel > 30 years: 13% of total fleet


              300


              250


              200
No of units


              150


              100


               50


                   0
                       68
                            69
                                 70
                                      71
                                           72
                                                   73
                                                   74


                                                   76
                                                   77
                                                   78
                                                   79
                                                   80
                                                   81
                                                   82
                                                   83
                                                   84


                                                   86
                                                   87
                                                   88
                                                   89
                                                   90
                                                   91
                                                   92
                                                   93
                                                   94


                                                   96
                                                   97
                                                   98
                                                   99
                                                   00
                                                   01
                                                   02
                                                   03
                                                   04


                                                   06
                                                   07
                                                   08
                                                   09
                                                   10
                                                   11
                                                   12


                                                                                                      13
                                                                                                           14
                                                   75


                                                   85


                                                   95


                                                   05


                                                                                                           15
                                                20
                   19
                        19
                             19
                                  19
                                       19
                                            19
                                                19


                                                19
                                                19
                                                19
                                                19
                                                19
                                                19
                                                19
                                                19
                                                19


                                                19
                                                19
                                                19
                                                19
                                                19
                                                19
                                                19
                                                19
                                                19


                                                19
                                                19
                                                19
                                                19
                                                20
                                                20
                                                20
                                                20
                                                20


                                                20
                                                20
                                                20
                                                20
                                                20


                                                20


                                                                                                      20
                                                                                                           20
                                                19


                                                19


                                                19


                                                20


                                                                                                                20
              Source: ODS Petrodata


              14
AHTS PSV
                                                                                                                                   AHTS PSV


THE RIG AND SUPPLY MARKET                                                                 800
                                                                                           800
                                                                                          700
                                                                                           700
                                                                                                    691
                                                                                                     691

                                                                                          600
                                                                                           600
                                                                                          500
                                                                                           500                     425
                                                                                                                    425
                                                                                          400
                                                                                           400

Current OSV & Rig fleet                                                                    300
                                                                                           300
                                                                                          200
                                                                                           200
                                                                                                 OSV <= 15 years, by vessel type  289
                                                                                                                                   289   269
                                                                                                                                          269
                                                                                                                                                                         163
                                                                                                                                                                          163
                                                                                                                                                          123
                                                                                                                                                           123
                                                                                          100
                                                                                           100
 Supply vessels   Total fleet                       AHTS                  PSV                00     AHTS            PSV
                                                                                                           0-5
                                                                                                             0-5                     6-10
                                                                                                                                       6-10
                                                                                                                                            AHTS        PSV    11-15
                                                                                                                                                                 11-15
 Existing fleet          2677                        1557                1120
                                                                                                  800
 Orderbook               447     17%                 148     10%         299     27%                           691
                                                                                                  700
                                                                                                  600
 Average age            12,7                         13,1                12,1                     500                       425
                                                                                                  400
                                                                                                                                           289
                                                                                                  300                                                    269
 Rig market       Total fleet             Semis/drillships            Jackups
                                                                                                  200                                                                                    163
 Existing fleet           789                         301                 488                                                                                               123
                                                                                                  100
 Orderbook               182     23%                  96     32%           86    18%
                                                                                                    0
                                                                                                                      0-5                        6-10                            11-15
Source: ODS Petrodata


Vessel term utilization:
• PSV (>3.000 DWT) currently 83% utilization globally vs 86% Nov 2012
• AHTS (>10.000 BHP) currently 72% utilization globally vs 75% in Nov 2012
   (The remaining 17% (PSV) and 28% (AHTS) is vessels trading in spot market, steaming, in yard or idle)

Delivery AHTS vs PSV
1) Last 5 years 691 AHTS vessels have been delivered from yard
    Same period 425 PSV vessels have been delivered.

2) Current orderbook is for 299 PSVs and 148 AHTS vessels


15
SELLING 50% OF BRAZILIAN BUSINESS TO BTG PACTUAL


16
BTG PACTUAL                                                 4Q|12
•    One of the largest investment banks in Latin America

•    Listed on stock exchange in Sao Paulo and Amsterdam

•    More than USD 95 bn under Asset/Wealth Management

•    Represents 30% of shareholders in Sete Brasil


17
THE TRANSACTION                                               4Q|12
•    Selling 50% of DESS’ Brazilian business to BTG Pactual
     EV = USD 578M


•    Buying 6 newbuild large PSVs
     EV = USD 274M


•    Equity injection as working capital USD 48M
     50% from each of the partners


18
THE BRAZILIAN BUSINESS                        4Q|12
• Deep Sea Supply Navegação Marítima Ltd
• Deep Sea Supply Serviços Marítimos Ltd
• 15 AHTS & PSVs operating in Brazil:

     AHTS          PSV

     Sea Panther    Sea Halibut
     Sea Leopard    Sea Bass
     Sea Tiger      Sea Pollock
     Sea Cheetah    Sea Turbot
     Sea Jaguar     Sea Pike
     Sea Fox        Sea Brasil
     Sea Jackal
     Sea Vixen
     Sea Stoat


•    6 Newbuild large PSVs – Ulstein PX 105
     – Expected delivery 2013/2014

19
THE TRANSACTION                                    4Q|12

                     Brazil


             The Brazilian business   Management
     Board
                                      agreements


                     AHTS
                       +
                     PSVs

20
STRATEGIC RATIONALE                         4Q|12
•    Local experience and know how

•    Increased local content

•    3rd largest OSV company in Brazil

•    Seeking further growth opportunities


21
DESS AFTER ESTABLISHMENT OF JV                              4Q|12
•    Modern fleet of 9 vessels with good contract coverage

     AHTS           PSV

     Sea Lynx       Sea Trout
     Sea Bear       Sea Angler
     Sea Ocelot     Sea Witch
     Sea Eagle 1
     Sea Badger
     Sea Weasel


•    Africa, Asia and North Sea the main markets

•    JV sales proceeds helps facilitate further growth


22
presis 360
COMPANY ADDRESSES

Cyprus
Deep Sea Supply Plc
John Kennedy Ave., Iris House, 7th Floor, Office no.740B
Limassol 3100
Cyprus

Deep Sea Supply Management (Cyprus) Ltd
P.O.Box 53340
CY-3302 Limassol
Cyprus


Norway
Deep Sea Supply Management AS
Tromøyveien 22
N-4841 Arendal
Norway


Singapore
Deep Sea Supply Management (Singapore) Pte.Ltd.
10 Hoe Chiang Rd
#19-03/04/05 Keppel Tower
Singapore 089315


Brazil
Deep Sea Supply Servicos Maritimos LTDA
Avenida Presidente Wilson
231, sala 1.403.
Cep:20030-021 Rio de Janeiro
RJ Brazil


                                                           www.deepseasupply.no

More Related Content

Similar to Deep Sea Supply Q4 2012 results presentation

Qll Communications
Qll CommunicationsQll Communications
Qll Communications
Qll Communications
 
Abaco smith
Abaco smithAbaco smith
Abaco smith
Carlos Barto
 
Tablets at a glance short
Tablets at a glance shortTablets at a glance short
Tablets at a glance short
Gabriella Bergaglio
 
Nokia Lifeblogging and theBlogging Phenomenon
Nokia Lifeblogging and theBlogging PhenomenonNokia Lifeblogging and theBlogging Phenomenon
Nokia Lifeblogging and theBlogging Phenomenon
BSI
 
Taxes transfersandredistributionnoralusitgfinal
Taxes transfersandredistributionnoralusitgfinalTaxes transfersandredistributionnoralusitgfinal
Taxes transfersandredistributionnoralusitgfinal
Centro de Competitividad e Innovación
 
Acg 124 cortes a
Acg 124 cortes a Acg 124 cortes a
Acg 124 cortes a
ambiental
 
BOV, Abu Dhabi, U.A.E.
BOV, Abu Dhabi, U.A.E.BOV, Abu Dhabi, U.A.E.
BOV, Abu Dhabi, U.A.E.
Starckn
 
Fools garden lemon tree
Fools garden   lemon treeFools garden   lemon tree
Fools garden lemon tree
Sah Ya
 
Building a better web
Building a better webBuilding a better web
Building a better web
Ben Schwarz
 
Ip 2011 Some Projects
Ip 2011 Some ProjectsIp 2011 Some Projects
Ip 2011 Some Projects
Angela Koch
 
Intercultural cities
Intercultural citiesIntercultural cities
Intercultural cities
sapience
 
09 01 27 Web 2.0 Weekly
09 01 27 Web 2.0 Weekly09 01 27 Web 2.0 Weekly
09 01 27 Web 2.0 Weekly
David Shore
 
December 17
December 17December 17
December 17
tgeorgiy
 
Sic 'Em Portfolio
Sic 'Em PortfolioSic 'Em Portfolio
Sic 'Em Portfolio
DavidZeitman
 
Smith ZY ESPOL
Smith ZY ESPOLSmith ZY ESPOL

Similar to Deep Sea Supply Q4 2012 results presentation (15)

Qll Communications
Qll CommunicationsQll Communications
Qll Communications
 
Abaco smith
Abaco smithAbaco smith
Abaco smith
 
Tablets at a glance short
Tablets at a glance shortTablets at a glance short
Tablets at a glance short
 
Nokia Lifeblogging and theBlogging Phenomenon
Nokia Lifeblogging and theBlogging PhenomenonNokia Lifeblogging and theBlogging Phenomenon
Nokia Lifeblogging and theBlogging Phenomenon
 
Taxes transfersandredistributionnoralusitgfinal
Taxes transfersandredistributionnoralusitgfinalTaxes transfersandredistributionnoralusitgfinal
Taxes transfersandredistributionnoralusitgfinal
 
Acg 124 cortes a
Acg 124 cortes a Acg 124 cortes a
Acg 124 cortes a
 
BOV, Abu Dhabi, U.A.E.
BOV, Abu Dhabi, U.A.E.BOV, Abu Dhabi, U.A.E.
BOV, Abu Dhabi, U.A.E.
 
Fools garden lemon tree
Fools garden   lemon treeFools garden   lemon tree
Fools garden lemon tree
 
Building a better web
Building a better webBuilding a better web
Building a better web
 
Ip 2011 Some Projects
Ip 2011 Some ProjectsIp 2011 Some Projects
Ip 2011 Some Projects
 
Intercultural cities
Intercultural citiesIntercultural cities
Intercultural cities
 
09 01 27 Web 2.0 Weekly
09 01 27 Web 2.0 Weekly09 01 27 Web 2.0 Weekly
09 01 27 Web 2.0 Weekly
 
December 17
December 17December 17
December 17
 
Sic 'Em Portfolio
Sic 'Em PortfolioSic 'Em Portfolio
Sic 'Em Portfolio
 
Smith ZY ESPOL
Smith ZY ESPOLSmith ZY ESPOL
Smith ZY ESPOL
 

More from TradeWindsnews

Olympic Shipping investor presentation 27 May 2014
Olympic Shipping investor presentation 27 May 2014Olympic Shipping investor presentation 27 May 2014
Olympic Shipping investor presentation 27 May 2014
TradeWindsnews
 
Ship Finance International Q1 2014 results presentation
Ship Finance International Q1 2014 results presentationShip Finance International Q1 2014 results presentation
Ship Finance International Q1 2014 results presentation
TradeWindsnews
 
Hoegh LNG Q1 2014 results presentation
Hoegh LNG Q1 2014 results presentationHoegh LNG Q1 2014 results presentation
Hoegh LNG Q1 2014 results presentation
TradeWindsnews
 
Siem Offshore presentation
Siem Offshore presentationSiem Offshore presentation
Siem Offshore presentation
TradeWindsnews
 
Dorian LPG IPO prospectus
Dorian LPG IPO prospectusDorian LPG IPO prospectus
Dorian LPG IPO prospectus
TradeWindsnews
 
Jinhui Shipping Q4 2013 results presentation
Jinhui Shipping Q4 2013 results presentationJinhui Shipping Q4 2013 results presentation
Jinhui Shipping Q4 2013 results presentation
TradeWindsnews
 
Maersk Drilling FY2013 results presentation
Maersk Drilling FY2013 results presentationMaersk Drilling FY2013 results presentation
Maersk Drilling FY2013 results presentation
TradeWindsnews
 
Teekay Corp group presentation September 2013
Teekay Corp group presentation September 2013Teekay Corp group presentation September 2013
Teekay Corp group presentation September 2013
TradeWindsnews
 
GasLog investor day presentation September 2013
GasLog investor day presentation September 2013GasLog investor day presentation September 2013
GasLog investor day presentation September 2013
TradeWindsnews
 
Siem Offshore Pareto Securities Oil & Offshore Conferences Sept 2013
Siem Offshore Pareto Securities Oil & Offshore Conferences Sept 2013Siem Offshore Pareto Securities Oil & Offshore Conferences Sept 2013
Siem Offshore Pareto Securities Oil & Offshore Conferences Sept 2013
TradeWindsnews
 
SeaBird Exploration Pareto Securities Oil & Offshore Conference Sept 2013
SeaBird Exploration Pareto Securities Oil & Offshore Conference Sept 2013SeaBird Exploration Pareto Securities Oil & Offshore Conference Sept 2013
SeaBird Exploration Pareto Securities Oil & Offshore Conference Sept 2013
TradeWindsnews
 
Polarcus Pareto Securities Oil & Offshore Conference Sept 2013
Polarcus Pareto Securities Oil & Offshore Conference Sept 2013Polarcus Pareto Securities Oil & Offshore Conference Sept 2013
Polarcus Pareto Securities Oil & Offshore Conference Sept 2013
TradeWindsnews
 
Oceanteam Shipping Pareto Securities Oil & Offshore Conference Sept 2013
Oceanteam Shipping Pareto Securities Oil & Offshore Conference Sept 2013Oceanteam Shipping Pareto Securities Oil & Offshore Conference Sept 2013
Oceanteam Shipping Pareto Securities Oil & Offshore Conference Sept 2013
TradeWindsnews
 
BW Offshore Pareto Securities Oil & Offshore Conference Sept 2013
BW Offshore Pareto Securities Oil & Offshore Conference Sept 2013BW Offshore Pareto Securities Oil & Offshore Conference Sept 2013
BW Offshore Pareto Securities Oil & Offshore Conference Sept 2013
TradeWindsnews
 
Atwood Oceanics Pareto Securities Oil & Offshore conferences Sept 2013
Atwood Oceanics Pareto Securities Oil & Offshore conferences Sept 2013Atwood Oceanics Pareto Securities Oil & Offshore conferences Sept 2013
Atwood Oceanics Pareto Securities Oil & Offshore conferences Sept 2013
TradeWindsnews
 
Globus Maritime Q2 2013 results presentation
Globus Maritime Q2 2013 results presentationGlobus Maritime Q2 2013 results presentation
Globus Maritime Q2 2013 results presentation
TradeWindsnews
 
Golar LNG Q2 2013 results presentation
Golar LNG Q2 2013 results presentationGolar LNG Q2 2013 results presentation
Golar LNG Q2 2013 results presentation
TradeWindsnews
 
Golar LNG Partners Q2 2013 results presentation
Golar LNG Partners Q2 2013 results presentationGolar LNG Partners Q2 2013 results presentation
Golar LNG Partners Q2 2013 results presentation
TradeWindsnews
 
Seadrill Q2 2013 results presentation
Seadrill Q2 2013 results presentationSeadrill Q2 2013 results presentation
Seadrill Q2 2013 results presentation
TradeWindsnews
 
Lamprell Q2 2013 results presentation
Lamprell Q2 2013 results presentationLamprell Q2 2013 results presentation
Lamprell Q2 2013 results presentation
TradeWindsnews
 

More from TradeWindsnews (20)

Olympic Shipping investor presentation 27 May 2014
Olympic Shipping investor presentation 27 May 2014Olympic Shipping investor presentation 27 May 2014
Olympic Shipping investor presentation 27 May 2014
 
Ship Finance International Q1 2014 results presentation
Ship Finance International Q1 2014 results presentationShip Finance International Q1 2014 results presentation
Ship Finance International Q1 2014 results presentation
 
Hoegh LNG Q1 2014 results presentation
Hoegh LNG Q1 2014 results presentationHoegh LNG Q1 2014 results presentation
Hoegh LNG Q1 2014 results presentation
 
Siem Offshore presentation
Siem Offshore presentationSiem Offshore presentation
Siem Offshore presentation
 
Dorian LPG IPO prospectus
Dorian LPG IPO prospectusDorian LPG IPO prospectus
Dorian LPG IPO prospectus
 
Jinhui Shipping Q4 2013 results presentation
Jinhui Shipping Q4 2013 results presentationJinhui Shipping Q4 2013 results presentation
Jinhui Shipping Q4 2013 results presentation
 
Maersk Drilling FY2013 results presentation
Maersk Drilling FY2013 results presentationMaersk Drilling FY2013 results presentation
Maersk Drilling FY2013 results presentation
 
Teekay Corp group presentation September 2013
Teekay Corp group presentation September 2013Teekay Corp group presentation September 2013
Teekay Corp group presentation September 2013
 
GasLog investor day presentation September 2013
GasLog investor day presentation September 2013GasLog investor day presentation September 2013
GasLog investor day presentation September 2013
 
Siem Offshore Pareto Securities Oil & Offshore Conferences Sept 2013
Siem Offshore Pareto Securities Oil & Offshore Conferences Sept 2013Siem Offshore Pareto Securities Oil & Offshore Conferences Sept 2013
Siem Offshore Pareto Securities Oil & Offshore Conferences Sept 2013
 
SeaBird Exploration Pareto Securities Oil & Offshore Conference Sept 2013
SeaBird Exploration Pareto Securities Oil & Offshore Conference Sept 2013SeaBird Exploration Pareto Securities Oil & Offshore Conference Sept 2013
SeaBird Exploration Pareto Securities Oil & Offshore Conference Sept 2013
 
Polarcus Pareto Securities Oil & Offshore Conference Sept 2013
Polarcus Pareto Securities Oil & Offshore Conference Sept 2013Polarcus Pareto Securities Oil & Offshore Conference Sept 2013
Polarcus Pareto Securities Oil & Offshore Conference Sept 2013
 
Oceanteam Shipping Pareto Securities Oil & Offshore Conference Sept 2013
Oceanteam Shipping Pareto Securities Oil & Offshore Conference Sept 2013Oceanteam Shipping Pareto Securities Oil & Offshore Conference Sept 2013
Oceanteam Shipping Pareto Securities Oil & Offshore Conference Sept 2013
 
BW Offshore Pareto Securities Oil & Offshore Conference Sept 2013
BW Offshore Pareto Securities Oil & Offshore Conference Sept 2013BW Offshore Pareto Securities Oil & Offshore Conference Sept 2013
BW Offshore Pareto Securities Oil & Offshore Conference Sept 2013
 
Atwood Oceanics Pareto Securities Oil & Offshore conferences Sept 2013
Atwood Oceanics Pareto Securities Oil & Offshore conferences Sept 2013Atwood Oceanics Pareto Securities Oil & Offshore conferences Sept 2013
Atwood Oceanics Pareto Securities Oil & Offshore conferences Sept 2013
 
Globus Maritime Q2 2013 results presentation
Globus Maritime Q2 2013 results presentationGlobus Maritime Q2 2013 results presentation
Globus Maritime Q2 2013 results presentation
 
Golar LNG Q2 2013 results presentation
Golar LNG Q2 2013 results presentationGolar LNG Q2 2013 results presentation
Golar LNG Q2 2013 results presentation
 
Golar LNG Partners Q2 2013 results presentation
Golar LNG Partners Q2 2013 results presentationGolar LNG Partners Q2 2013 results presentation
Golar LNG Partners Q2 2013 results presentation
 
Seadrill Q2 2013 results presentation
Seadrill Q2 2013 results presentationSeadrill Q2 2013 results presentation
Seadrill Q2 2013 results presentation
 
Lamprell Q2 2013 results presentation
Lamprell Q2 2013 results presentationLamprell Q2 2013 results presentation
Lamprell Q2 2013 results presentation
 

Deep Sea Supply Q4 2012 results presentation

  • 1. 4Q|12 Deep Sea Supply Plc Presentation 27 February 2013
  • 2. HIGHLIGHTS 4Q|12 • Announcing joint venture in Brazil • Increased revenue, but soft North Sea spot market and late commencement Sea Brasil • New long term contracts in Asia • New medium term contracts in Brazil 3
  • 3. SHARE PRICE DEVELOPMENT AND SHARE TURNOVER Share price and total return since listing 2012 average monthly volume and turnover velocity Close Price Total Return 40 0,04 50 Average monthly volume in NOK million (light blue line) 45 Traded shares per month / Average shares outstanding 35 0,035 40 30 0,03 35 25 0,025 30 NOK per share 20 0,02 25 20 15 0,015 15 10 0,01 10 5 0,005 5 0Sep-05 Jan-06 May-06 Sep-06 Jan-07 May-07 Sep-07 Jan-08 May-08 Sep-08 Jan-09 May-09 Sep-09 Jan-10 May-10 Sep-10 Jan-11 May-11 Sep-11 Jan-12 May-12 Sep-12 Jan-13 0 0 Deep Sea DOF ASA Siem Offshore Havila Solstad Farstad Eidesvik REM Offshore Supply PLC Inc. Shipping ASA Offshore ASA Shipping ASA Offshore ASA ASA 4
  • 4. INCOME STATEMENT 4Q 2012 4Q|12 (Unaudited figures in USD 1,000) 4Q 2012 4Q 2011 3Q 2012 Operating revenue 38 934 32 115 35 457 Vessel operating expenses (20 065) (16 123) (16 913) Other operating expenses (3 496) (3 273) (2 681) Other gains 120 59 143 Gain on sale 1 123 1 190 1 123 EBITDA 16 615 13 966 17 130 Depreciation (9 497) (8 260) (8 614) EBIT 7 118 5 707 8 516 Financial income 176 130 45 Financial expenses (6 876) (6 219) (6 217) Net currency items 635 (1 025) 676 Change in value of financial derivatives 70 106 50 Net financial items (5 995) (7 008) (5 446) Pre-tax result 1 123 (1 301) 3 070 Taxes (287) (12) (43) Profit for the year 837 (1 314) 3 027 Earnings per share 0,01 (0,01) 0,02 Earnings per share diluted 0,01 (0,01) 0,02 Cash flow per share 1) 0,08 0,06 0,09 1) Profit before taxes+depreciation-unrealized gain on currencies 5
  • 5. INCOME STATEMENT 2012 4Q|12 (Unaudited figures in USD 1,000) YTD 2012 YTD 2011 Operating revenue 124 140 115 902 Vessel operating expenses (66 345) (72 124) Operating lease 0 (1 684) Other operating expenses (12 356) (10 911) Other gains 566 499 Gain on sale 4 492 29 017 EBITDA 50 497 60 699 Depreciation (32 304) (28 826) EBIT 18 193 31 873 Financial income 351 392 Financial expenses (23 802) (26 004) Net currency items 1 483 (5 579) Change in value of financial derivatives 175 129 Net financial items (21 793) (31 062) Pre-tax result (3 599) 810 Taxes (912) (21) Profit for the year (4 511) 789 Earnings per share (0,04) 0,01 Earnings per share diluted (0,04) 0,01 Cash flow per share 1) 0,21 0,28 1) Profit before taxes+depreciation-unrealized gain on currencies 6
  • 6. REVENUE AND EBITDA DEVELOPMENT 2012 4Q|12 Development per quarter (Figures in USD 1,000) 40 000 38 934 35 457 32 500 28 339 25 000 21 411 Operating Revenue EBITDA 17 500 10 000 2 500 Q1 Q2 Q3 Q4 7
  • 7. AREA OF CURRENT OPERATION Office PSV AHTS 8
  • 8. CASH FLOW STATEMENT 4Q|12 (Unaudited figures in USD 1,000) YTD 2012 YTD 2011 Cash flows from operating activities Cash generated from operations 47 985 16 725 Net cash generated from operations 47 985 16 725 Cash flows from investing activities Acquisitions and upgrades of property, plant and equipment -92 186 -74 410 Disposals of property, plant and equipment 0 136 860 Net cash used in investing activities -92 186 62 450 Cash flows from financing activities Interest paid -20 774 -26 559 Proceeds from borrowings 105 349 72 767 Repayments of borrowings -40 270 -126 996 Net cash used in financing activities 44 305 -80 788 Total changes in liquidity in the Year 104 -1 613 Cash and cash equivalents at beginning of Year 40 318 41 932 Cash and cash equivalents at end of Year 40 422 40 318 9
  • 9. BALANCE SHEET 3Q|11 (Unaudited figures in USD 1,000) 31.12.2012 31.12.2011 (Unaudited figures in USD 1,000) 31.12.2012 31.12.2011 Non-current assets Liabilities Vessels cost 638 977 554 935 Borrowings 468 579 403 299 CIRR loan 35 509 37 790 Construction contract 0 17 659 Deferred gain 27 157 31 561 Equipment 822 643 Long term tax liabilities 0 873 Total property, plant and equipment 639 799 573 237 Other long term liabilities 195 124 Total long term liabilities 531 439 473 647 Deferred income tax 605 308 Borrowings 40 436 38 143 Other long term receivables 327 647 CIRR loan 5 215 4 839 Investment in associates 1 194 594 Trade and other payables 23 667 13 307 CIRR deposit 35 558 37 796 Deferred gain 4 658 4 812 Total non-current assets 677 483 612 582 Tax payable 1 266 881 Other short term liabilities 1 660 400 Current assets Total short term liabilities 76 903 62 382 Inventories 2 679 5 062 Total liabilities 608 342 536 029 Other short term receivables 9 541 6 468 CIRR deposit 5 215 4 839 Shareholders equity Freight income not received 30 010 29 475 Share capital, share premium and treasury shares 11 445 11 205 Cash and cash equivalents 40 423 40 318 Retained earnings and other reserves 145 564 151 510 Total current assets 87 867 86 162 Total shareholders equity 157 007 162 714 Total assets 765 350 698 744 Total equity and liablities 765 350 698 744 10
  • 10. SHAREHOLDERS 4Q|12 The largest shareholders as per 21st February 2013 registered in VPS Citizen No. of shares: % HEMEN HOLDING LIMITED CYP 44 583 853 35,05% SKAGEN KON-TIKI NOR 12 229 431 9,61% PERESTROIKA AS NOR 5 453 897 4,29% DNB NOR MARKETS NOR 3 360 105 2,64% JPMCB RE SVENSKA HANDELSBANKEN SWE 2 168 050 1,70% HOLBERG NORGE NOR 2 162 486 1,70% UBS AG GBR 1 715 679 1,35% UTHALDEN A/S NOR 1 575 000 1,24% NORDEA BANK NORGE ASA NOR 1 470 000 1,16% CENTRA INVEST AS NOR 1 421 643 1,12% PACTUM AS NOR 1 325 000 1,04% ANAXO CAPITAL AS NOR 1 220 000 0,96% DNB NOR SMB NOR 1 000 000 0,79% SOLSTEN INVESTMENT FUND GER 900 000 0,71% DELPHI Norge NOR 900 000 0,71% MORGAN STANLEY & CO USA 805 367 0,63% BNP PARIBAS FRA 800 000 0,63% MP PENSJON PK NOR 658 800 0,52% LØREN HOLDING NOR 620 626 0,49% VERDIPAPIRFONDET HANDELSBANKEN SWE 600 000 0,47% Total 20 largest shareholders: 84 969 937 66,80% Total other shareholders: 42 227 257 33,20% Total number of shares: 127 197 194 100,00% 11
  • 11. CONTRACT BACKLOG 4Q|12 Contract Backlog Deep Sea Supply Fleet as per Feb 2013* Vessel Type Vessels on Term Contracts as of 01.02.13 Contract backlog AHTS 10 of 14 Vessels USD 200M PSV 9 of 9 Vessels USD 127M Total 19 of 23 Vessels USD 327M *Excluding Sea Weasel, which is owned by Malaysian J.V. Expected revenue from term contracts per quarter (Figures in USD 1,000) AHTS PSV 40 000 40 000 35 000 35 000 30 000 30 000 25 000 25 000 20 000 20 000 15 000 15 000 10 000 10 000 5000 5000 0 0 Q1 - 13 Q1 - 13 Q2 - 13 Q2 - 13 Q3 - 13 Q3 - 13 Q4 - 13 Q4 - 13 12
  • 12. FLEET LIST & CHARTER STATUS AS PER FEBRUARY 2013 Vessel Type Bhp/Dwt Year Built Trading Area 2013 2014 AHTS Vessels Q1 Q2 Q3 Q4 Sea Lynx KMAR 404 15000 BHP 1999 North Sea North Sea Spot Sea Bear KMAR 404 15000 BHP 1999 Brazil/North Sea Repsol North Sea Spot Sea Tiger KMAR 404 15000 BHP 1999 Brazil Repsol Sea Panther KMAR 404 15000 BHP 1999 Brazil Sea Leopard KMAR 404 15000 BHP 1998 Brazil Vanco Vanco Sea Cheetah Khiam Chuan 15000 BHP 2007 Brazil Petrobras Sea Jaguar Khiam Chuan 15000 BHP 2007 Brazil Petrobras Sea Ocelot Khiam Chuan 10800 BHP 2007 Asia Sea Eagle I Khiam Chuan 12000 BHP 2009 Malaysia Malaysia Sea Weasel Seatech P-729 6500 BHP 2009 Malaysia Sea Fox Seatech P-729 6800 BHP 2011 Brazil Petrobras Sea Jackal Seatech P-729 6800 BHP 2011 Brazil Petrobras Sea Badger Seatech P-729 6800 BHP 2011 Asia PTTEP Sea Vixen Seatech P-729 6800 BHP 2011 Brazil Petrobras Sea Stoat Seatech P-729 6800 BHP 2011 Brazil Petrobras PSVs Sea Trout VS 470MK II 3250 DWT 2007 North Sea EnQuest Sea Angler PSV UT 755 L 3250 DWT 2007 W.Africa ENI Congo Sea Halibut PSV UT 755 L 3250 DWT 2007 Brazil Petrobras Sea Pike PSV UT 755 L 3250 DWT 2007 Brazil Petrobras Sea Bass PSV UT 755 L 3250 DWT 2008 Brazil Petrobras Sea Pollock PSV UT 755 L 3250 DWT 2008 Brazil Petrobras Sea Turbot PSV UT 755 L 3250 DWT 2008 Brazil Petrobras Sea Witch PSV UT 755 L 3250 DWT 2008 W.Africa ENI Congo Sea Brasil STX 09CD 4700 DWT 2012 Brazil BP Firm Option Spot 13
  • 13. AGE DISTRIBUTION CURRENT FLEET AND ORDER BOOK AHTS PSV Vessel > 20 years: 27 % of total fleet ,7 Vessel > 20 years: 20,1% of total fleet Vessel > 30 years: 14,9 % of total fleet Vessel > 30 years: 13% of total fleet 300 250 200 No of units 150 100 50 0 68 69 70 71 72 73 74 76 77 78 79 80 81 82 83 84 86 87 88 89 90 91 92 93 94 96 97 98 99 00 01 02 03 04 06 07 08 09 10 11 12 13 14 75 85 95 05 15 20 19 19 19 19 19 19 19 19 19 19 19 19 19 19 19 19 19 19 19 19 19 19 19 19 19 19 19 19 19 20 20 20 20 20 20 20 20 20 20 20 20 20 19 19 19 20 20 Source: ODS Petrodata 14
  • 14. AHTS PSV AHTS PSV THE RIG AND SUPPLY MARKET 800 800 700 700 691 691 600 600 500 500 425 425 400 400 Current OSV & Rig fleet 300 300 200 200 OSV <= 15 years, by vessel type 289 289 269 269 163 163 123 123 100 100 Supply vessels Total fleet AHTS PSV 00 AHTS PSV 0-5 0-5 6-10 6-10 AHTS PSV 11-15 11-15 Existing fleet 2677 1557 1120 800 Orderbook 447 17% 148 10% 299 27% 691 700 600 Average age 12,7 13,1 12,1 500 425 400 289 300 269 Rig market Total fleet Semis/drillships Jackups 200 163 Existing fleet 789 301 488 123 100 Orderbook 182 23% 96 32% 86 18% 0 0-5 6-10 11-15 Source: ODS Petrodata Vessel term utilization: • PSV (>3.000 DWT) currently 83% utilization globally vs 86% Nov 2012 • AHTS (>10.000 BHP) currently 72% utilization globally vs 75% in Nov 2012 (The remaining 17% (PSV) and 28% (AHTS) is vessels trading in spot market, steaming, in yard or idle) Delivery AHTS vs PSV 1) Last 5 years 691 AHTS vessels have been delivered from yard Same period 425 PSV vessels have been delivered. 2) Current orderbook is for 299 PSVs and 148 AHTS vessels 15
  • 15. SELLING 50% OF BRAZILIAN BUSINESS TO BTG PACTUAL 16
  • 16. BTG PACTUAL 4Q|12 • One of the largest investment banks in Latin America • Listed on stock exchange in Sao Paulo and Amsterdam • More than USD 95 bn under Asset/Wealth Management • Represents 30% of shareholders in Sete Brasil 17
  • 17. THE TRANSACTION 4Q|12 • Selling 50% of DESS’ Brazilian business to BTG Pactual EV = USD 578M • Buying 6 newbuild large PSVs EV = USD 274M • Equity injection as working capital USD 48M 50% from each of the partners 18
  • 18. THE BRAZILIAN BUSINESS 4Q|12 • Deep Sea Supply Navegação Marítima Ltd • Deep Sea Supply Serviços Marítimos Ltd • 15 AHTS & PSVs operating in Brazil: AHTS PSV Sea Panther Sea Halibut Sea Leopard Sea Bass Sea Tiger Sea Pollock Sea Cheetah Sea Turbot Sea Jaguar Sea Pike Sea Fox Sea Brasil Sea Jackal Sea Vixen Sea Stoat • 6 Newbuild large PSVs – Ulstein PX 105 – Expected delivery 2013/2014 19
  • 19. THE TRANSACTION 4Q|12 Brazil The Brazilian business Management Board agreements AHTS + PSVs 20
  • 20. STRATEGIC RATIONALE 4Q|12 • Local experience and know how • Increased local content • 3rd largest OSV company in Brazil • Seeking further growth opportunities 21
  • 21. DESS AFTER ESTABLISHMENT OF JV 4Q|12 • Modern fleet of 9 vessels with good contract coverage AHTS PSV Sea Lynx Sea Trout Sea Bear Sea Angler Sea Ocelot Sea Witch Sea Eagle 1 Sea Badger Sea Weasel • Africa, Asia and North Sea the main markets • JV sales proceeds helps facilitate further growth 22
  • 22. presis 360 COMPANY ADDRESSES Cyprus Deep Sea Supply Plc John Kennedy Ave., Iris House, 7th Floor, Office no.740B Limassol 3100 Cyprus Deep Sea Supply Management (Cyprus) Ltd P.O.Box 53340 CY-3302 Limassol Cyprus Norway Deep Sea Supply Management AS Tromøyveien 22 N-4841 Arendal Norway Singapore Deep Sea Supply Management (Singapore) Pte.Ltd. 10 Hoe Chiang Rd #19-03/04/05 Keppel Tower Singapore 089315 Brazil Deep Sea Supply Servicos Maritimos LTDA Avenida Presidente Wilson 231, sala 1.403. Cep:20030-021 Rio de Janeiro RJ Brazil www.deepseasupply.no