introduction
Objective
Analyze e-commerce customerbehavior to understand spending patterns, preferences,
and satisfaction levels.
Identify key factors influencing purchase frequency and customer retention to provide
actionable business insights.
3.
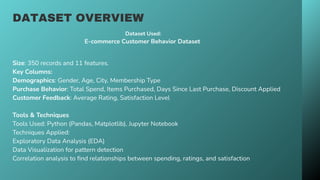
DATASET OVERVIEW
Size: 350records and 11 features.
Key Columns:
Demographics: Gender, Age, City, Membership Type
Purchase Behavior: Total Spend, Items Purchased, Days Since Last Purchase, Discount Applied
Customer Feedback: Average Rating, Satisfaction Level
Tools & Techniques
Tools Used: Python (Pandas, Matplotlib), Jupyter Notebook
Techniques Applied:
Exploratory Data Analysis (EDA)
Data Visualization for pattern detection
Correlation analysis to find relationships between spending, ratings, and satisfaction
Dataset Used:
E-commerce Customer Behavior Dataset
4.
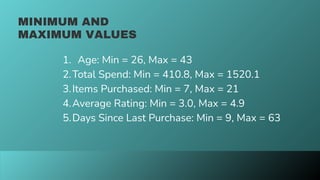
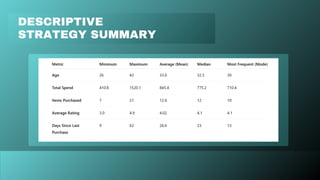
MINIMUM AND
MAXIMUM VALUES
1.Age: Min = 26, Max = 43
2.Total Spend: Min = 410.8, Max = 1520.1
3.Items Purchased: Min = 7, Max = 21
4.Average Rating: Min = 3.0, Max = 4.9
5.Days Since Last Purchase: Min = 9, Max = 63
5.
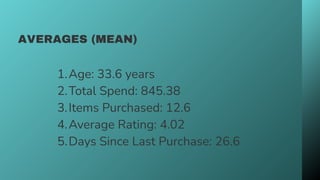
AVERAGES (MEAN)
1.Age: 33.6years
2.Total Spend: 845.38
3.Items Purchased: 12.6
4.Average Rating: 4.02
5.Days Since Last Purchase: 26.6
K-MEANS CLUSTERING
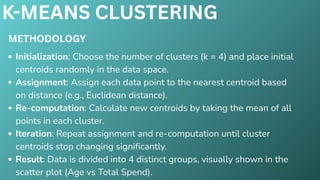
METHODOLOGY
Initialization: Choosethe number of clusters (k = 4) and place initial
centroids randomly in the data space.
Assignment: Assign each data point to the nearest centroid based
on distance (e.g., Euclidean distance).
Re-computation: Calculate new centroids by taking the mean of all
points in each cluster.
Iteration: Repeat assignment and re-computation until cluster
centroids stop changing significantly.
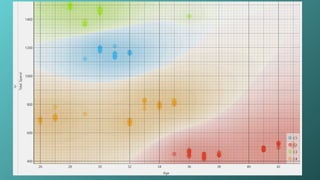
Result: Data is divided into 4 distinct groups, visually shown in the
scatter plot (Age vs Total Spend).
13.
01
02
FINAL CLUSTER
FORMATION
VISUALISATION
AND
ASSIGNMENTS
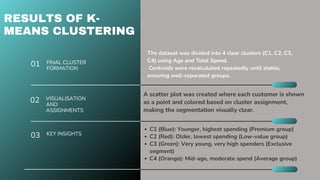
A scatterplot was created where each customer is shown
as a point and colored based on cluster assignment,
making the segmentation visually clear.
RESULTS OF K-
MEANS CLUSTERING
03 KEY INSIGHTS
C1 (Blue): Younger, highest spending (Premium group)
C2 (Red): Older, lowest spending (Low-value group)
C3 (Green): Very young, very high spenders (Exclusive
segment)
C4 (Orange): Mid-age, moderate spend (Average group)
The dataset was divided into 4 clear clusters (C1, C2, C3,
C4) using Age and Total Spend.
Centroids were recalculated repeatedly until stable,
ensuring well-separated groups.
14.
K-NN MEANS CLUSTERING
METHODOLOGY
1.Dataset Collection: Imported E-commerce customer behavior dataset
from Kaggle.
2.Data Cleaning: Removed duplicates, handled missing values, and fixed
data types.
3.EDA: Plotted charts for age, gender, city, product category, and
purchase amount.
4.Analysis: Compared trends across age groups, cities, and spending
patterns.
5.Insights: Summarized key findings to understand customer behavior.
15.
01
02
FINAL CLUSTER
FORMATION
VISUALISATION
AND
ASSIGNMENTS
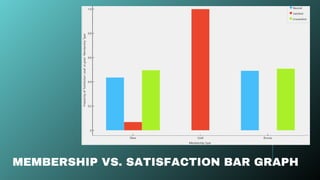
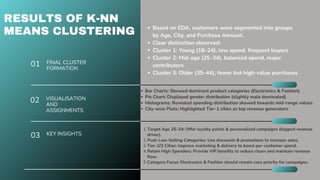
Bar Charts:Showed dominant product categories (Electronics & Fashion)
Pie Chart: Displayed gender distribution (slightly male dominated)
Histograms: Revealed spending distribution skewed towards mid-range values
City-wise Plots: Highlighted Tier-1 cities as top revenue generators
RESULTS OF K-NN
MEANS CLUSTERING
03 KEY INSIGHTS
1.Target Age 25–34: Offer loyalty points & personalized campaigns (biggest revenue
driver).
2.Push Low-Selling Categories: Use discounts & promotions to increase sales.
3.Tier-2/3 Cities: Improve marketing & delivery to boost per-customer spend.
4.Retain High Spenders: Provide VIP benefits to reduce churn and maintain revenue
flow.
5.Category Focus: Electronics & Fashion should remain core priority for campaigns.
Based on EDA, customers were segmented into groups
by Age, City, and Purchase Amount.
Clear distinction observed:
Cluster 1: Young (18–24), low spend, frequent buyers
Cluster 2: Mid-age (25–34), balanced spend, major
contributors
Cluster 3: Older (35–44), fewer but high-value purchases
16.
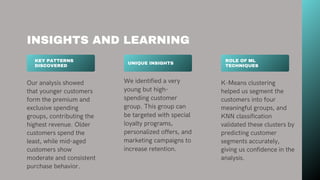
INSIGHTS AND LEARNING
KEYPATTERNS
DISCOVERED
UNIQUE INSIGHTS
Our analysis showed
that younger customers
form the premium and
exclusive spending
groups, contributing the
highest revenue. Older
customers spend the
least, while mid-aged
customers show
moderate and consistent
purchase behavior.
We identified a very
young but high-
spending customer
group. This group can
be targeted with special
loyalty programs,
personalized offers, and
marketing campaigns to
increase retention.
ROLE OF ML
TECHNIQUES
K-Means clustering
helped us segment the
customers into four
meaningful groups, and
KNN classification
validated these clusters by
predicting customer
segments accurately,
giving us confidence in the
analysis.
17.
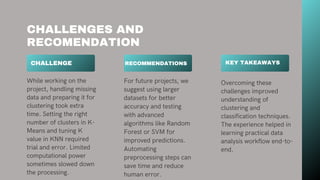
CHALLENGES AND
RECOMENDATION
CHALLENGE RECOMMENDATIONS
Whileworking on the
project, handling missing
data and preparing it for
clustering took extra
time. Setting the right
number of clusters in K-
Means and tuning K
value in KNN required
trial and error. Limited
computational power
sometimes slowed down
the processing.
For future projects, we
suggest using larger
datasets for better
accuracy and testing
with advanced
algorithms like Random
Forest or SVM for
improved predictions.
Automating
preprocessing steps can
save time and reduce
human error.
KEY TAKEAWAYS
Overcoming these
challenges improved
understanding of
clustering and
classification techniques.
The experience helped in
learning practical data
analysis workflow end-to-
end.
18.
CONCLUSION
Applied K-Means &KNN to uncover patterns and classify
data.
Showed how AI turns raw data into insights for smarter
decisions
The project revealed clear customer segments and proved
ML’s value in decision-making.
19.
01
02
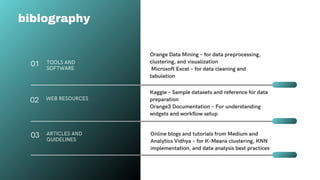
TOOLS AND
SOFTWARE
WEB RESOURCES
OrangeData Mining – for data preprocessing,
clustering, and visualization
Microsoft Excel – for data cleaning and
tabulation
Kaggle – Sample datasets and reference for data
preparation
Orange3 Documentation – For understanding
widgets and workflow setup
biblography
03 ARTICLES AND
GUIDELINES
Online blogs and tutorials from Medium and
Analytics Vidhya – for K-Means clustering, KNN
implementation, and data analysis best practices