This slide is about:
1. Importance of Data Interpretation
2. Data Collection to Interpretation Pipeline
3. Common Pitfalls in Interpretation: Examples
4. Decision Making Framework
Data Interpretation and
DecisionMaking in the
Laboratory
Dr. Md Lutfar Rahman
Chief Scientific Officer (C.C.)
Planning, Training and Communication Division
Bangladesh Jute Research Institute
Manik Mia avenue, Dhaka- 1207
2.
Objectives
Understand key principlesof data
interpretation
Learn how to avoid common
statistical and logical errors
Apply data-driven decision-making in
jute and fiber crop research
3.
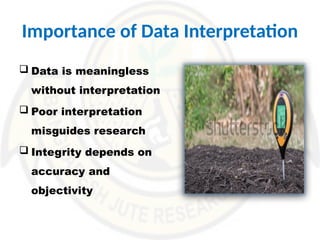
Importance of DataInterpretation
Data is meaningless
without interpretation
Poor interpretation
misguides research
Integrity depends on
accuracy and
objectivity
4.
Types of LaboratoryData
Quantitative: pH, EC, fiber length, weight,
chlorophyll
Qualitative: pest symptoms, seed vigor,
seed color
Temporal: growth stages at frequent
intervals
Spatial: plot/lab variation
5.
Data Collection toInterpretation Pipeline
1. Experiment Design
2. Accurate Data Collection
3. Cleaning & Validation
4. Statistical Analysis
5. Interpretation
6. Decision Making
7. Reporting
6.
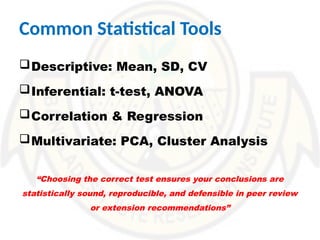
Common Statistical Tools
Descriptive:Mean, SD, CV
Inferential: t-test, ANOVA
Correlation & Regression
Multivariate: PCA, Cluster Analysis
“Choosing the correct test ensures your conclusions are
statistically sound, reproducible, and defensible in peer review
or extension recommendations”
7.
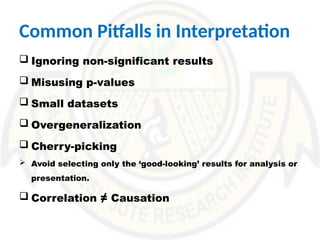
Common Pitfalls inInterpretation
Ignoring non-significant results
Misusing p-values
Small datasets
Overgeneralization
Cherry-picking
Avoid selecting only the ‘good-looking’ results for analysis or
presentation.
Correlation ≠ Causation
8.
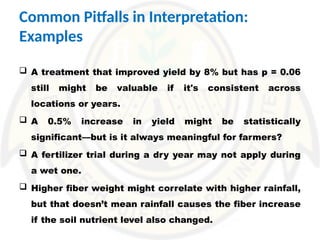
Common Pitfalls inInterpretation:
Examples
A treatment that improved yield by 8% but has p = 0.06
still might be valuable if it's consistent across
locations or years.
A 0.5% increase in yield might be statistically
significant—but is it always meaningful for farmers?
A fertilizer trial during a dry year may not apply during
a wet one.
Higher fiber weight might correlate with higher rainfall,
but that doesn’t mean rainfall causes the fiber increase
if the soil nutrient level also changed.
9.
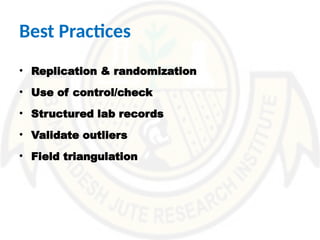
Best Practices
• Replication& randomization
• Use of control/check
• Structured lab records
• Validate outliers
• Field triangulation
10.
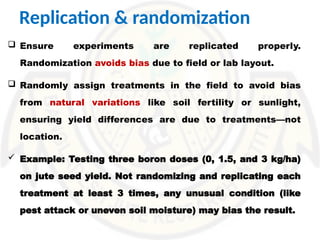
Replication & randomization
Ensure experiments are replicated properly.
Randomization avoids bias due to field or lab layout.
Randomly assign treatments in the field to avoid bias
from natural variations like soil fertility or sunlight,
ensuring yield differences are due to treatments—not
location.
Example: Testing three boron doses (0, 1.5, and 3 kg/ha)
on jute seed yield. Not randomizing and replicating each
treatment at least 3 times, any unusual condition (like
pest attack or uneven soil moisture) may bias the result.
11.
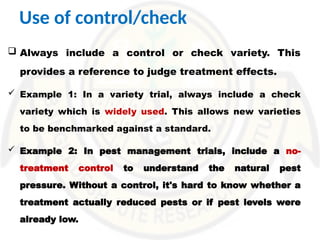
Use of control/check
Always include a control or check variety. This
provides a reference to judge treatment effects.
Example 1: In a variety trial, always include a check
variety which is widely used. This allows new varieties
to be benchmarked against a standard.
Example 2: In pest management trials, include a no-
treatment control to understand the natural pest
pressure. Without a control, it's hard to know whether a
treatment actually reduced pests or if pest levels were
already low.
12.
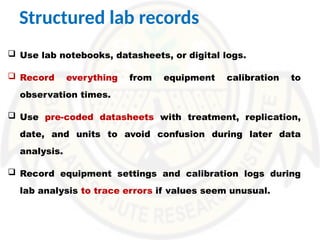
Structured lab records
Use lab notebooks, datasheets, or digital logs.
Record everything from equipment calibration to
observation times.
Use pre-coded datasheets with treatment, replication,
date, and units to avoid confusion during later data
analysis.
Record equipment settings and calibration logs during
lab analysis to trace errors if values seem unusual.
13.
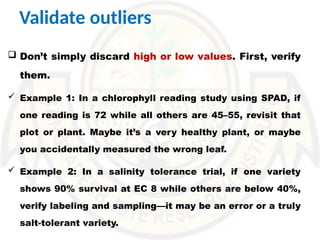
Validate outliers
Don’tsimply discard high or low values. First, verify
them.
Example 1: In a chlorophyll reading study using SPAD, if
one reading is 72 while all others are 45–55, revisit that
plot or plant. Maybe it’s a very healthy plant, or maybe
you accidentally measured the wrong leaf.
Example 2: In a salinity tolerance trial, if one variety
shows 90% survival at EC 8 while others are below 40%,
verify labeling and sampling—it may be an error or a truly
salt-tolerant variety.
14.
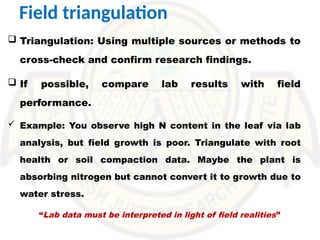
Field triangulation
Triangulation:Using multiple sources or methods to
cross-check and confirm research findings.
If possible, compare lab results with field
performance.
Example: You observe high N content in the leaf via lab
analysis, but field growth is poor. Triangulate with root
health or soil compaction data. Maybe the plant is
absorbing nitrogen but cannot convert it to growth due to
water stress.
“Lab data must be interpreted in light of field realities”
15.
Additional tips
Calibrateinstruments regularly: e.g., weigh the
same object twice before and after each batch of
measurements.
Train junior staff on data entry and measurement
protocols to avoid introducing observer bias.
Use photos: Take photos of unusual field events
(e.g., pest infestation, wilting) to pair with
numerical data.
16.
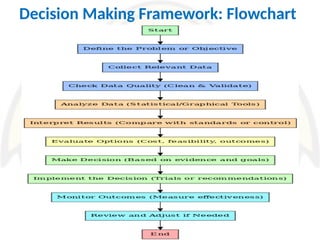
Decision Making Framework
1.Define the problem
2. Analyze data
3. Interpret findings
4. Consider alternatives
5. Decide & act
6. Monitor outcomes
“Effective scientific decisions rely on clear problem identification,
evidence-based analysis, and continuous monitoring to ensure the best
outcomes”
17.
Decision Making Framework:Example
Jute Plant Breeding for Higher Fiber Yield
1. Define the problem: Develop a jute variety with higher fiber
yield and improved pest resistance.
2. Gather Relevant Data: Collect data on various jute varieties,
including their fiber yield, pest resistance, and environmental
adaptability. Perform controlled cross-breeding experiments
and evaluate genetic diversity.
3. Analyze and Interpret: Compare the fiber yields, pest
resistance levels, and growth characteristics of the offspring
from different crosses. Use statistical methods (e.g., ANOVA)
to determine which crosses show the best potential.
18.
Decision Making Framework:Example
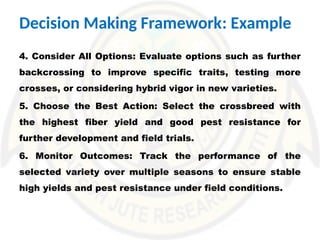
4. Consider All Options: Evaluate options such as further
backcrossing to improve specific traits, testing more
crosses, or considering hybrid vigor in new varieties.
5. Choose the Best Action: Select the crossbreed with
the highest fiber yield and good pest resistance for
further development and field trials.
6. Monitor Outcomes: Track the performance of the
selected variety over multiple seasons to ensure stable
high yields and pest resistance under field conditions.
Ethical and ResponsibleDecisions
Avoid data manipulation
Even if results aren’t exciting, they are still valid.
Transparency in reporting
Record how data was processed. Others should be able
to replicate your analysis.
Peer review and collaboration
Accept criticism and suggestions.
Give credit
If your analysis is based on someone else’s protocol or
dataset, acknowledge it.
21.
Software Tools thatCan be Used
• Excel (stats & charts)
• R / SPSS/ MiniTab/ JMP (advanced analysis)
• GraphPad Prism
• PCA tools for genotypes
22.
Artificial Intelligence (AI)Tools that Can be
Used
• ChatGPT
• Grok AI
• Gemini
• Tableau and Microsoft Power BI
• KNIME
23.
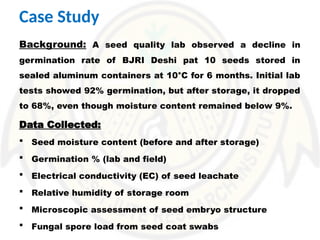
Case Study
Background: Aseed quality lab observed a decline in
germination rate of BJRI Deshi pat 10 seeds stored in
sealed aluminum containers at 10°C for 6 months. Initial lab
tests showed 92% germination, but after storage, it dropped
to 68%, even though moisture content remained below 9%.
Data Collected:
Seed moisture content (before and after storage)
Germination % (lab and field)
Electrical conductivity (EC) of seed leachate
Relative humidity of storage room
Microscopic assessment of seed embryo structure
Fungal spore load from seed coat swabs
24.
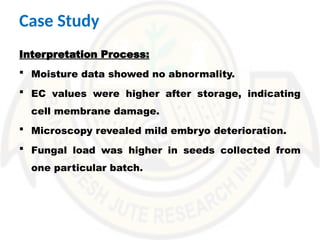
Interpretation Process:
Moisturedata showed no abnormality.
EC values were higher after storage, indicating
cell membrane damage.
Microscopy revealed mild embryo deterioration.
Fungal load was higher in seeds collected from
one particular batch.
Case Study
25.
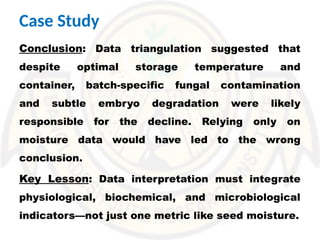
Conclusion: Data triangulationsuggested that
despite optimal storage temperature and
container, batch-specific fungal contamination
and subtle embryo degradation were likely
responsible for the decline. Relying only on
moisture data would have led to the wrong
conclusion.
Key Lesson: Data interpretation must integrate
physiological, biochemical, and microbiological
indicators—not just one metric like seed moisture.
Case Study


![제 23회 보아즈(BOAZ) 빅데이터 컨퍼런스 - [MBOAX] : ABSA를 활용한 소비자 반응 분석 기반 운영 효율화 대시보드 설계](https://cdn.slidesharecdn.com/ss_thumbnails/3-1boaz23rdconferencemboax-260203102709-9d519923-thumbnail.jpg?width=640&height=640&fit=bounds)


