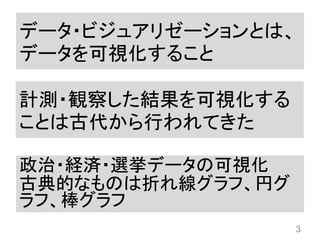
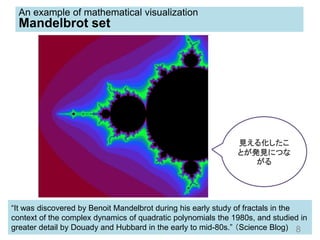
“It was discoveredby Benoit Mandelbrot during his early study of fractals in the
context of the complex dynamics of quadratic polynomials the 1980s, and studied in
greater detail by Douady and Hubbard in the early to mid-80s.” (Science Blog) 8
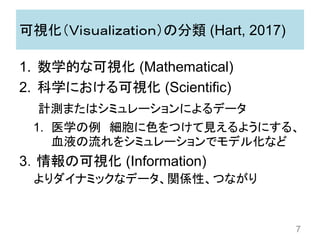
An example of mathematical visualization
Mandelbrot set
見える化したこ
とが発見につな
がる
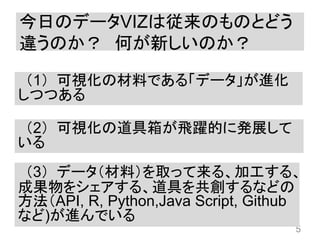
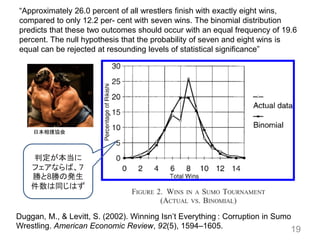
“Approximately 26.0 percentof all wrestlers finish with exactly eight wins,
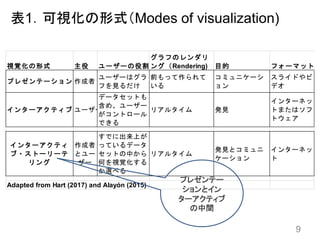
compared to only 12.2 per- cent with seven wins. The binomial distribution
predicts that these two outcomes should occur with an equal frequency of 19.6
percent. The null hypothesis that the probability of seven and eight wins is
equal can be rejected at resounding levels of statistical significance”
19
Duggan, M., & Levitt, S. (2002). Winning Isn’t Everything : Corruption in Sumo
Wrestling. American Economic Review, 92(5), 1594–1605.
判定が本当に
フェアならば、7
勝と8勝の発生
件数は同じはず
日本相撲協会
Bibliography
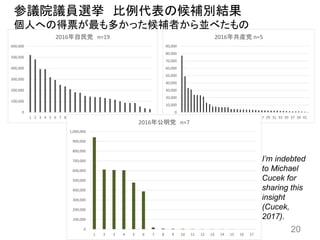
Cucek, M. (2017).Update on Japanese Politics. Presented at Temple University Japan.
Hart, J. (2017). Introduction to Data Science. University of Illinois at Urbana Champaign.
Coursera.
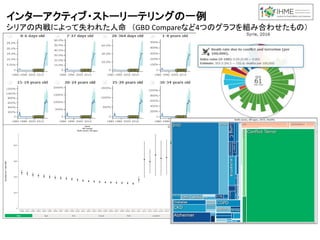
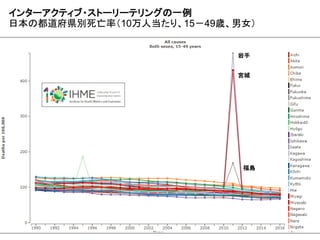
Institute for Health Metrics and Evaluation. Healthdata.org
Lima, M. (2015).A visual history of human knowledge
https://www.ted.com/talks/manuel_lima_a_visual_history_of_human_knowledge#t-787352
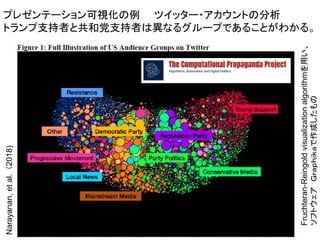
Vidya Narayanan, Vlad Barash, John Kelly, Bence Kollanyi, Lisa-Maria Neudert, and Philip N.
Howard. “Polarization, Partisanship and Junk News Consumption over Social Media in the US.”
Data Memo 2018.1. Oxford, UK: Project on Computational Propaganda.
Rom, M. C. (2015). Numbers, Pictures, and Politics: Teaching Research Methods Through Data
Visualizations. Journal of Political Science Education, 11(1), 11–27.
http://doi.org/10.1080/15512169.2014.985108
Science Blogs. (2017). http://scienceblogs.com/goodmath/2007/07/11/the-mandelbrot-set-1/
五十嵐ほか。(2017) 新しい可視化表現が自発的かつ継続的に開発されるシビックテック活動の設
計:E2D3におけるアプリケーション・オープンソース・ハッカソンのデザイン。デジタル・プラクティス3223


![[HTML5J 第47回HTML5とか勉強会] データ・ビジュアライゼーションの現況と実際](https://cdn.slidesharecdn.com/ss_thumbnails/html5jrev02-140422025033-phpapp02-thumbnail.jpg?width=640&height=640&fit=bounds)


