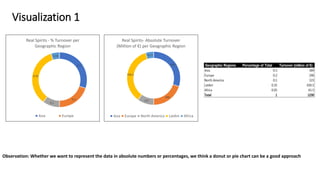
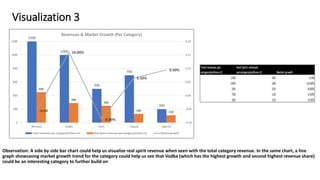
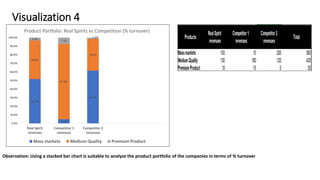
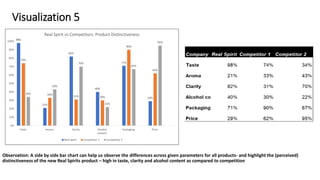
The document discusses various data visualizations that could be used to analyze and represent sales and market data for spirits. It suggests using donut or pie charts to show absolute or percentage turnover by geographic region. A line graph is recommended to analyze sales and market growth trends over time. Side-by-side bar and line graphs could show revenue and market growth for different spirit categories. A stacked bar chart could analyze market share by product type for different companies. Finally, side-by-side bar charts are proposed to compare product attributes of a new spirit versus competitors.