Downloaded 16 times


![Advanced TV comes in many tactical flavors, each presenting a unique
contribution to a holistic media initiative
5
60 MM HOUSEHOLDS
[ household addressable ]
opportunity to go beyond demography
to target messages only to households
in a brand’s true target
addressable ads are dynamically
inserted, whenever/wherever the
households is watching tv, if they meet
the targeting criteria
500MM DEVICES
[ device–level targeting]
extend the reach of addressable
television via device (mobile/tablet)
level addressable
500mm devices mapped to 100mm
households
ability to get true cross channel
attribution
[ programmatic/indexed
television ]
The application of data to television
content to determine the value of the
networks, programs, and dayparts
against segments more granular to
Nielsen. Inventory can be purchased
manually or through one of many
automated platforms
118MM HOUSEHOLDS
[ zone-level insertion ]
ability to leverage first/third party data
to broaden the target by isolating zip
codes and cable zones that over-index
for a brand
beyond the 210 DMAs, there are 2,877
zones that we have the ability to target
individually
2,877 ZONES](https://image.slidesharecdn.com/videosummitpresentationfinal-180608224132/75/Data-Technology-Television-5-2048.jpg)


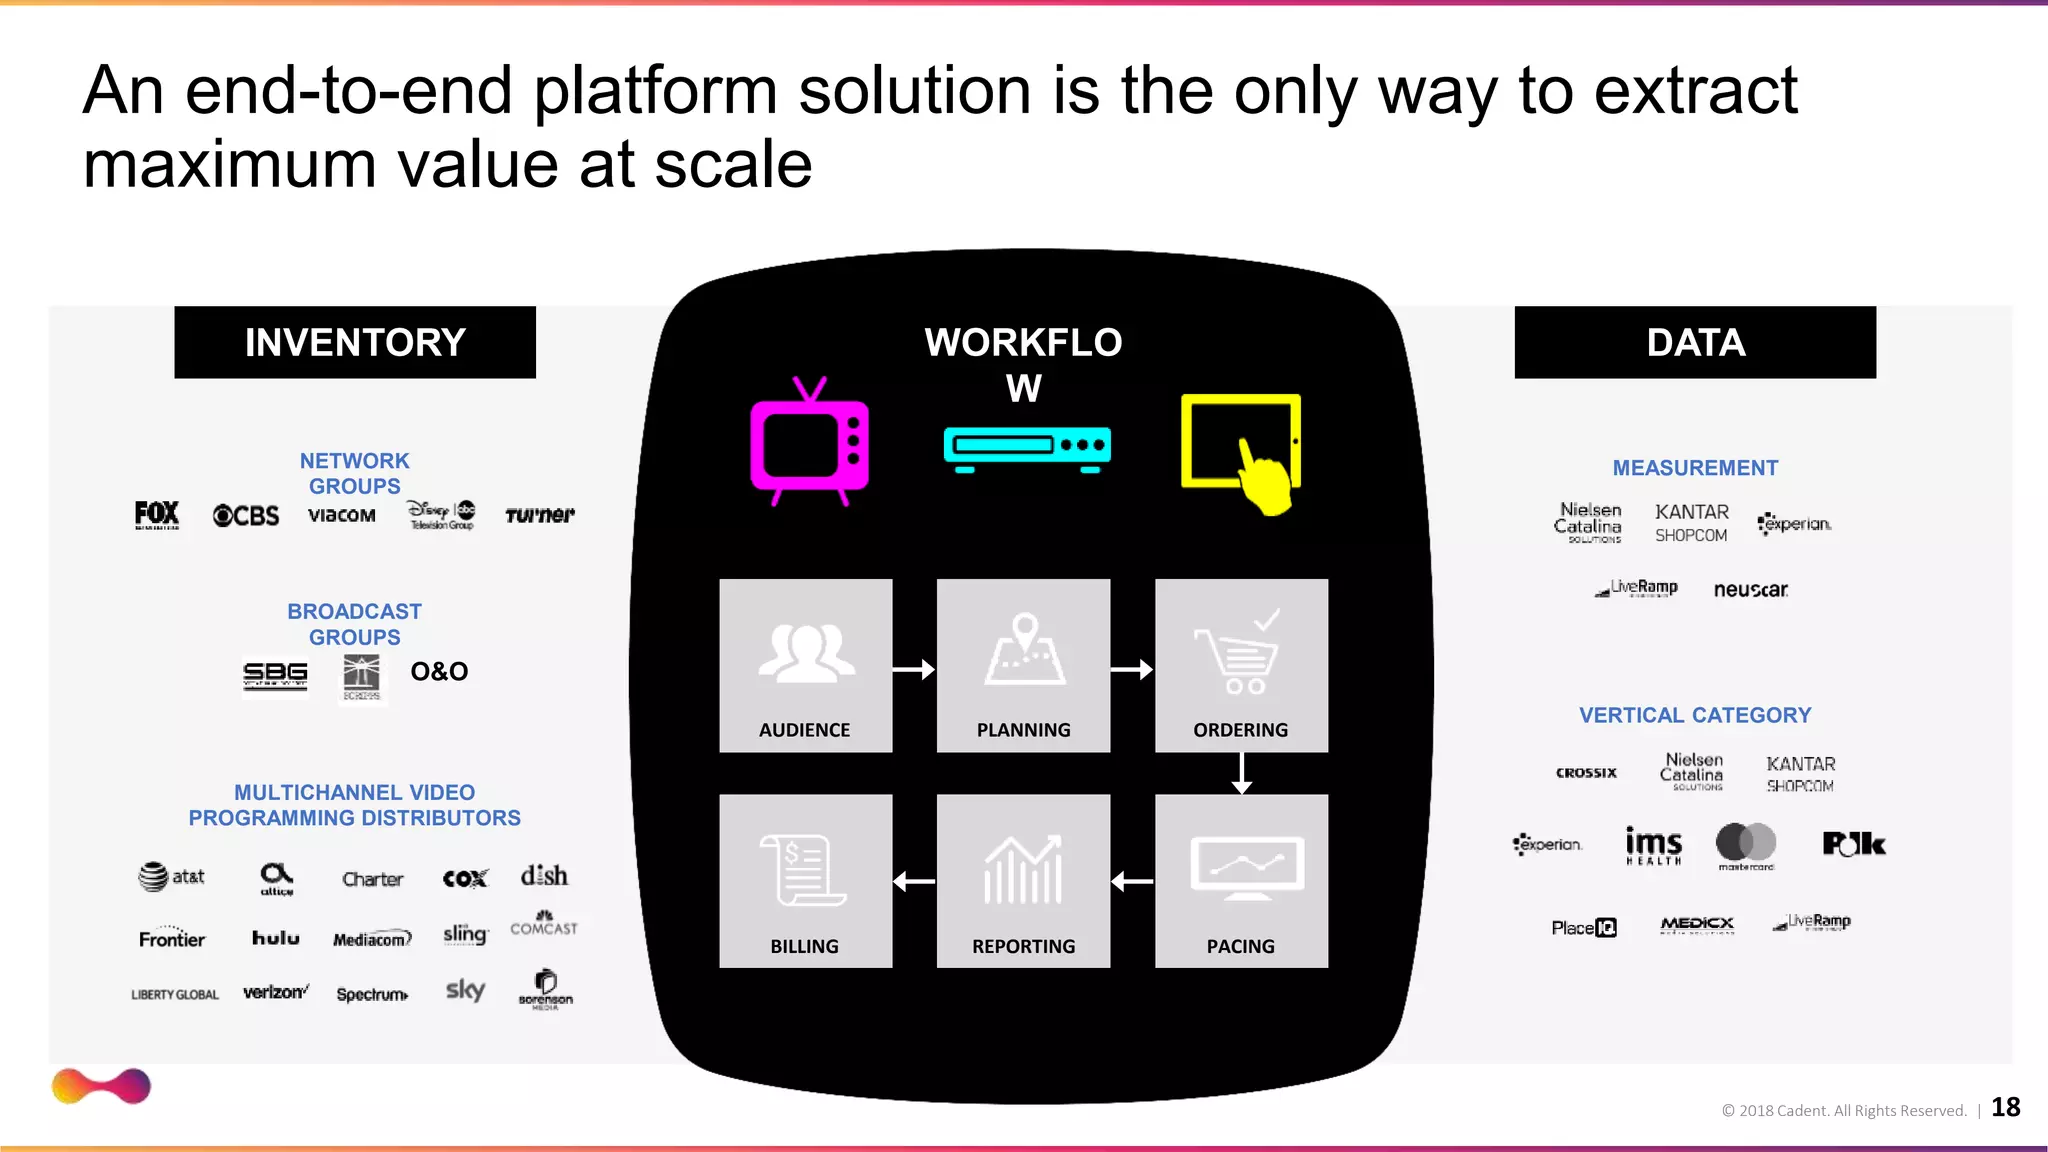


The document discusses the future of television, emphasizing the rise of data-driven advertising amidst changing viewership patterns and declining linear ratings. It highlights advancements in addressable advertising, which allows for targeted messaging to specific high-value audiences through various data integrations, thus significantly increasing ad spend share. Additionally, it outlines the use of sophisticated measurement techniques to analyze campaign effectiveness and the importance of an integrated platform for maximizing advertising value.


![Ask the AppNexperts: Push Play on Video [Webinar]](https://cdn.slidesharecdn.com/ss_thumbnails/webinarpushplayonvideofinal-160420183108-thumbnail.jpg?width=640&height=640&fit=bounds)