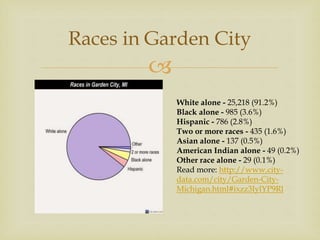
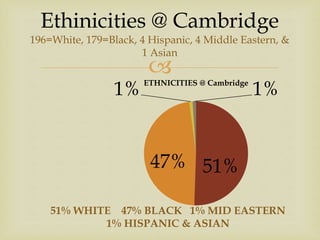
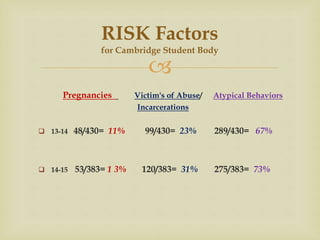
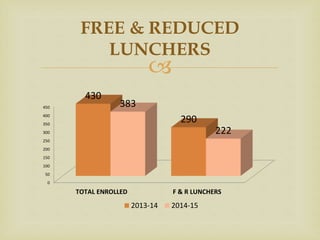
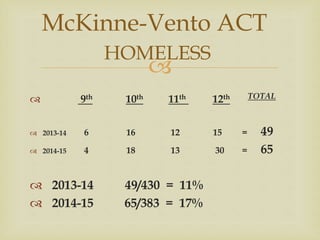
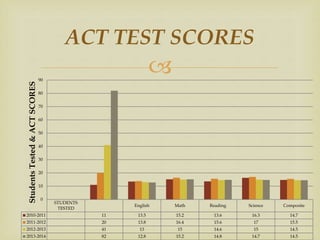
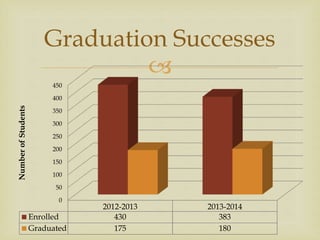
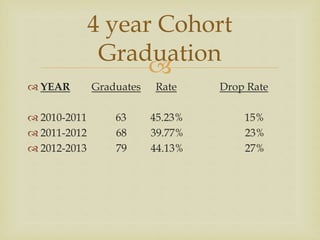
2014 – 2015 Data Profile

 Demographics
 Residence Numbers
 RISK Factors
 Poverty Level
 School Improvement
 Academic Success
 ACT
 Graduation
DATA PROFILE

DEMOGRAPHICS
City of Garden City
No Diploma
10%
HS Diploma
41%
Less than YR
of College
10%
1 YR of
College
15%
Assoc.Degree
8%
Bachelor
9%
Masters
7%
Educational Attainment

Races in Garden City
White alone - 25,218 (91.2%)
Black alone - 985 (3.6%)
Hispanic - 786 (2.8%)
Two or more races - 435 (1.6%)
Asian alone - 137 (0.5%)
American Indian alone - 49 (0.2%)
Other race alone - 29 (0.1%)
Read more: http://www.city-
data.com/city/Garden-City-
Michigan.html#ixzz3IylYP9Rl

 Garden City, Michigan
Most common industries in
2008-2012 (%)
 Manufacturing (29%)
 Retail trade (14%)
 Transportation andwarehousing (11%)
 Construction (10%)
 Administrativeand support and wastemanagement services (5%)
 Accommodation and food services (5%)
 Otherservices, except publicadministration (4%)
Read more: http://www.city-data.com/city/Garden-City-Michigan.html#ixzz3Iyl6sAlP
 1. Garden City-129
 2. Detroit-85
 3. Inkster-64
 4. Westland-31
 5. Dearborn Heights-18
 6. Livonia-15
 7. Redford-10
 8. Taylor-7
 9. Wayne-6
 10. Canton-5
 11. Romulus-4
 12. Dearborn-3
 13. Farmington Hills-1
 14. Riverview-1
 15. Wixom-1
 16. Ypsilanti-1
Students @ Cambridge by
Residence - Total=383
129
85
64
31
18
15
10
7 6 5 4 3 2 1 1 1
1 2 3 4 5 6 7 8 9 10 11 12 13 14 15 16

Ethinicities @ Cambridge
196=White, 179=Black, 4 Hispanic, 4 Middle Eastern, &
1 Asian
51%47%
1% 1%ETHNICITIES @ Cambridge
51% WHITE 47% BLACK 1% MID EASTERN
1% HISPANIC & ASIAN

Pregnancies Victim's of Abuse/ Atypical Behaviors
Incarcerations
 13-14 48/430= 11% 99/430= 23% 289/430= 67%
 14-15 53/383= 1 3% 120/383= 31% 275/383= 73%
RISK Factors
for Cambridge Student Body

FREE & REDUCED
LUNCHERS
0
50
100
150
200
250
300
350
400
450
TOTAL ENROLLED F & R LUNCHERS
430
290
383
222
2013-14 2014-15

 9th 10th 11th 12th TOTAL
 2013-14 6 16 12 15 = 49
 2014-15 4 18 13 30 = 65
 2013-14 49/430 = 11%
 2014-15 65/383 = 17%
McKinne-Vento ACT
HOMELESS

2013-14 34 IEP’s and 3 Section
504’s/430(Enrollment) Students=8%
2014-15 43 IEP’s and 6 Section
504’s/383(Enrollment) Students=13%
Special Ed. & 504
 GOAL 1: ELA GOAL: Students will improve reading
comprehension.
 Strategies: Academic Interventions, Reading Apprenticeship Literacy
Initiative
 GOAL 2: MATH GOAL: All students will improve in reason
and computation.
 Strategies: Daily bell ringers, Use data to differentiate instruction
 GOAL 3: SCIENCE GOAL: Students will improve proficiency
in science reading and comprehension.
 Strategies: Building vocabulary and fluency, Utilize Academic Coaches
 GOAL 4: SOCIAL STUDIES GOAL: All students will be
prepared to find facts, identify main ideas and true statements
from choices and interpret graphs and charts.
 Strategies: Incorporate more project based learning and used cooperative
learning.
Cambridge School Improvement Goals

 FEMALE- 155 Students
 9th 10th 11th 12th
 2.4 3.1 3.12 2.31
 MALES- 228 Students
 9th 10th 11th 12th
 2.37 3.01 2.99 3.14
Grade Point Averages
2014-15

ACT TEST SCORES
STUDENTS
TESTED
English Math Reading Science Composite
2010-2011 11 13.5 15.2 13.6 16.3 14.7
2011-2012 20 13.8 16.4 15.6 17 15.5
2012-2013 41 13 15 14.6 15 14.5
2013-2014 82 12.8 15.2 14.8 14.7 14.5
0
10
20
30
40
50
60
70
80
90
StudentsTested&ACTSCORES

Graduation Successes
0
50
100
150
200
250
300
350
400
450
2012-2013 2013-2014
Enrolled 430 383
Graduated 175 180
NumberofStudents

 YEAR Graduates Rate Drop Rate
 2010-2011 63 45.23% 15%
 2011-2012 68 39.77% 23%
 2012-2013 79 44.13% 27%
4 year Cohort
Graduation

“He who opens a school door closes a
prison.”-Victor Hugo

Data Profile Cambridge High School

  • 1.
    2014 – 2015Data Profile
  • 2.
      Demographics  ResidenceNumbers  RISK Factors  Poverty Level  School Improvement  Academic Success  ACT  Graduation DATA PROFILE
  • 3.
     DEMOGRAPHICS City of GardenCity No Diploma 10% HS Diploma 41% Less than YR of College 10% 1 YR of College 15% Assoc.Degree 8% Bachelor 9% Masters 7% Educational Attainment
  • 4.
     Races in GardenCity White alone - 25,218 (91.2%) Black alone - 985 (3.6%) Hispanic - 786 (2.8%) Two or more races - 435 (1.6%) Asian alone - 137 (0.5%) American Indian alone - 49 (0.2%) Other race alone - 29 (0.1%) Read more: http://www.city- data.com/city/Garden-City- Michigan.html#ixzz3IylYP9Rl
  • 5.
      Garden City,Michigan Most common industries in 2008-2012 (%)  Manufacturing (29%)  Retail trade (14%)  Transportation andwarehousing (11%)  Construction (10%)  Administrativeand support and wastemanagement services (5%)  Accommodation and food services (5%)  Otherservices, except publicadministration (4%) Read more: http://www.city-data.com/city/Garden-City-Michigan.html#ixzz3Iyl6sAlP
  • 6.
     1. GardenCity-129  2. Detroit-85  3. Inkster-64  4. Westland-31  5. Dearborn Heights-18  6. Livonia-15  7. Redford-10  8. Taylor-7  9. Wayne-6  10. Canton-5  11. Romulus-4  12. Dearborn-3  13. Farmington Hills-1  14. Riverview-1  15. Wixom-1  16. Ypsilanti-1 Students @ Cambridge by Residence - Total=383 129 85 64 31 18 15 10 7 6 5 4 3 2 1 1 1 1 2 3 4 5 6 7 8 9 10 11 12 13 14 15 16
  • 7.
     Ethinicities @ Cambridge 196=White,179=Black, 4 Hispanic, 4 Middle Eastern, & 1 Asian 51%47% 1% 1%ETHNICITIES @ Cambridge 51% WHITE 47% BLACK 1% MID EASTERN 1% HISPANIC & ASIAN
  • 8.
     Pregnancies Victim's ofAbuse/ Atypical Behaviors Incarcerations  13-14 48/430= 11% 99/430= 23% 289/430= 67%  14-15 53/383= 1 3% 120/383= 31% 275/383= 73% RISK Factors for Cambridge Student Body
  • 9.
     FREE & REDUCED LUNCHERS 0 50 100 150 200 250 300 350 400 450 TOTALENROLLED F & R LUNCHERS 430 290 383 222 2013-14 2014-15
  • 10.
      9th 10th11th 12th TOTAL  2013-14 6 16 12 15 = 49  2014-15 4 18 13 30 = 65  2013-14 49/430 = 11%  2014-15 65/383 = 17% McKinne-Vento ACT HOMELESS
  • 11.
     2013-14 34 IEP’sand 3 Section 504’s/430(Enrollment) Students=8% 2014-15 43 IEP’s and 6 Section 504’s/383(Enrollment) Students=13% Special Ed. & 504
  • 12.
     GOAL 1:ELA GOAL: Students will improve reading comprehension.  Strategies: Academic Interventions, Reading Apprenticeship Literacy Initiative  GOAL 2: MATH GOAL: All students will improve in reason and computation.  Strategies: Daily bell ringers, Use data to differentiate instruction  GOAL 3: SCIENCE GOAL: Students will improve proficiency in science reading and comprehension.  Strategies: Building vocabulary and fluency, Utilize Academic Coaches  GOAL 4: SOCIAL STUDIES GOAL: All students will be prepared to find facts, identify main ideas and true statements from choices and interpret graphs and charts.  Strategies: Incorporate more project based learning and used cooperative learning. Cambridge School Improvement Goals
  • 13.
      FEMALE- 155Students  9th 10th 11th 12th  2.4 3.1 3.12 2.31  MALES- 228 Students  9th 10th 11th 12th  2.37 3.01 2.99 3.14 Grade Point Averages 2014-15
  • 14.
     ACT TEST SCORES STUDENTS TESTED EnglishMath Reading Science Composite 2010-2011 11 13.5 15.2 13.6 16.3 14.7 2011-2012 20 13.8 16.4 15.6 17 15.5 2012-2013 41 13 15 14.6 15 14.5 2013-2014 82 12.8 15.2 14.8 14.7 14.5 0 10 20 30 40 50 60 70 80 90 StudentsTested&ACTSCORES
  • 15.
  • 16.
      YEAR GraduatesRate Drop Rate  2010-2011 63 45.23% 15%  2011-2012 68 39.77% 23%  2012-2013 79 44.13% 27% 4 year Cohort Graduation
  • 17.
     “He who opensa school door closes a prison.”-Victor Hugo