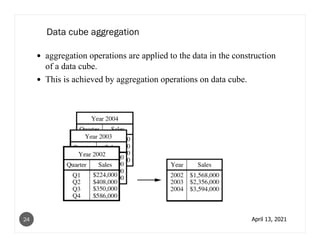
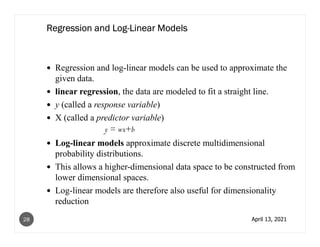
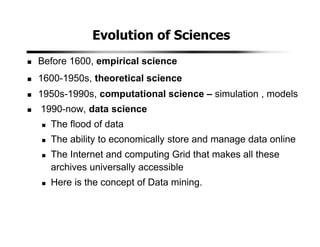
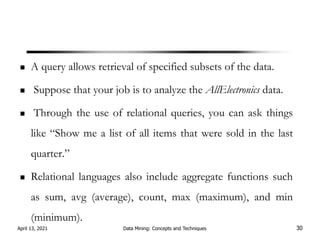
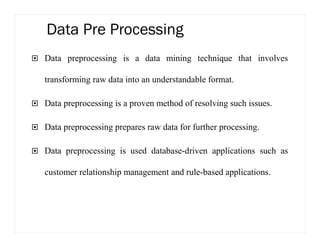
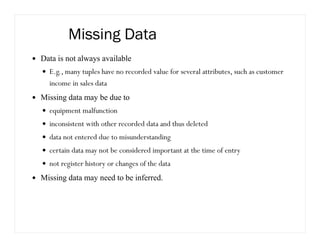
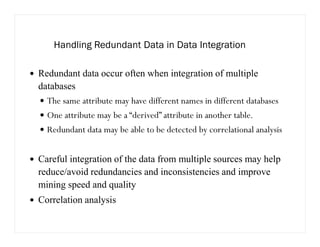
1. Data mining involves the automated analysis of large datasets to discover patterns and relationships. It has grown in importance due to the massive growth in data from various sources like business, science, and social media.
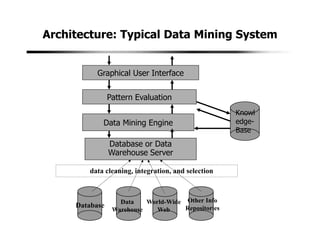
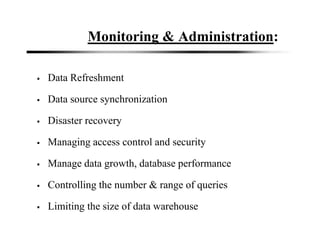
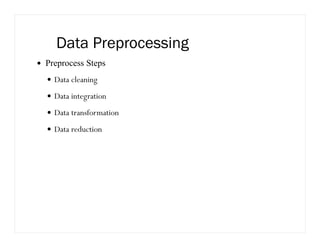
2. A typical data mining system includes components for data cleaning, data transformation, pattern evaluation, and knowledge presentation from datasets in databases or data warehouses. Data mining algorithms are applied to extract useful patterns.
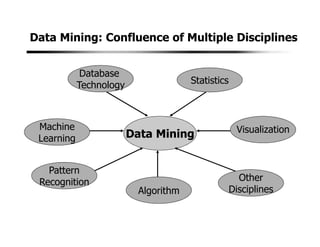
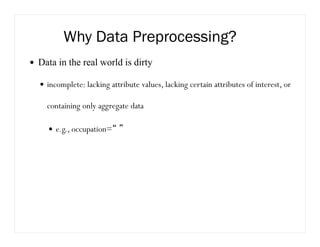
3. Data mining draws from multiple disciplines including database technology, statistics, machine learning, and visualization. It aims to discover knowledge from data that is too large for traditional data analysis methods to handle effectively.
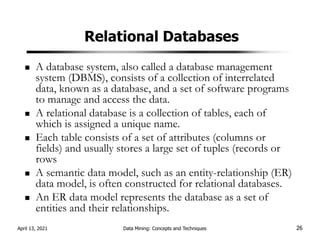
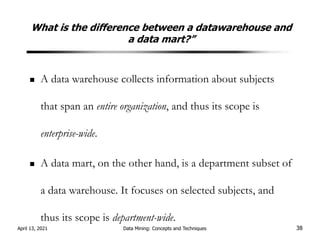
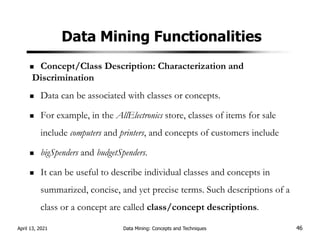
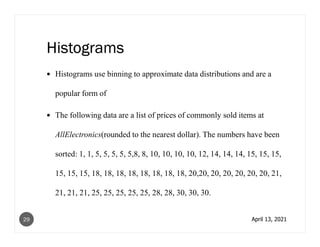
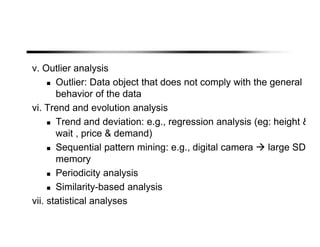
![Association analysis
buys(X; “computer”))buys(X; “software”) [support = 1%; confidence = 50%]
A confidence, or certainty, of 50% means that if a customer buys a
computer, there is a 50% chance that she will buy software as well.
A 1% support means that 1% of all of the transactions under
analysis showed that computer and software were purchased
together.
Association rules that contain a single predicate are referred to as
single-dimensional association rules.
April 13, 2021 Data Mining: Concepts and Techniques 50](https://image.slidesharecdn.com/dataminingmod1ppt-240401055752-fb1a5f0f/85/Data-Mining-mod1-ppt-pdf-bca-sixth-semester-notes-50-320.jpg)
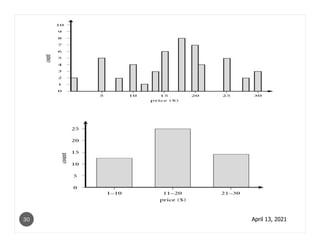
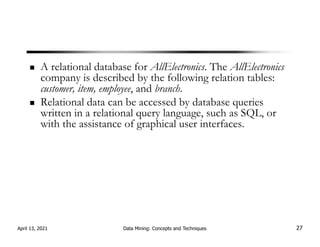
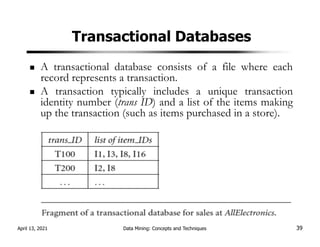
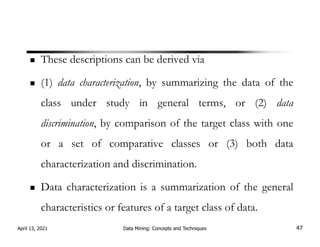
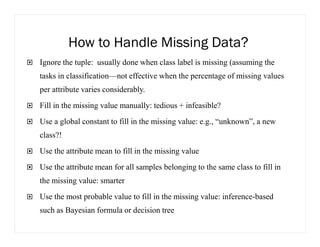
![Association analysis
age(X, “20:::29”)^income(X, “20K:::29K”))buys(X, “CD player”)
[support = 2%, confidence = 60%]
multidimensional association rule
association rules are discarded as uninteresting if they do not
satisfy both a minimum support threshold and a minimum
confidence threshold.
April 13, 2021 Data Mining: Concepts and Techniques 51](https://image.slidesharecdn.com/dataminingmod1ppt-240401055752-fb1a5f0f/85/Data-Mining-mod1-ppt-pdf-bca-sixth-semester-notes-51-320.jpg)
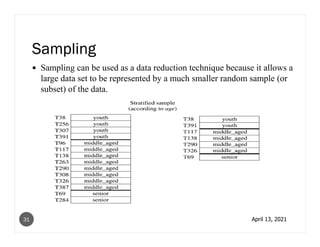
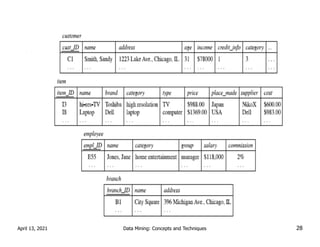
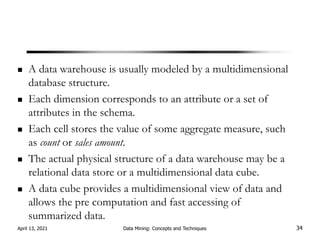
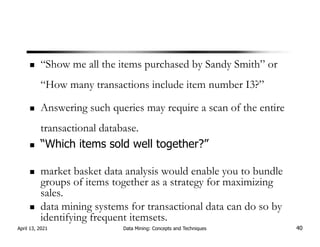
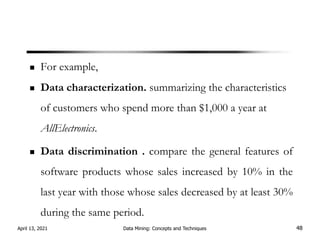
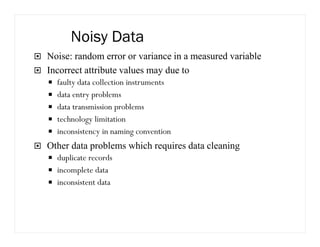
![OLAP Operations.
OLAP Operations are used for retrieving data in a simplified
manner from data cube for analysis.
Slicing: Reducing the data cube by one or more dimensions.
Slice time=’Q2’ C[quarter,city,product]=C[city, product]
April 13, 2021 Data Mining: Concepts and Techniques 73](https://image.slidesharecdn.com/dataminingmod1ppt-240401055752-fb1a5f0f/85/Data-Mining-mod1-ppt-pdf-bca-sixth-semester-notes-73-320.jpg)
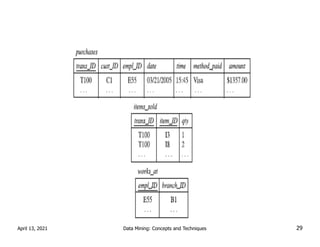
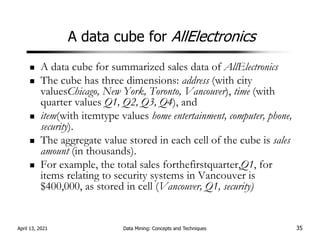
![Dicing:
This operation is for selecting a smaller data cube and analyzing it
from different perspectives (selection criteria).
Eg:
dice time=’Q1 or Q2 and location =’Mumbai’ or ‘Pune’
C[Quarter,city,product]=C[quarter,city,product]
April 13, 2021 Data Mining: Concepts and Techniques 74](https://image.slidesharecdn.com/dataminingmod1ppt-240401055752-fb1a5f0f/85/Data-Mining-mod1-ppt-pdf-bca-sixth-semester-notes-74-320.jpg)
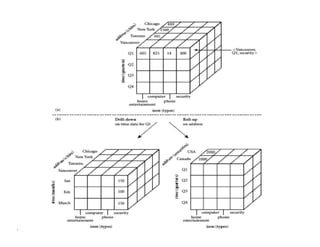
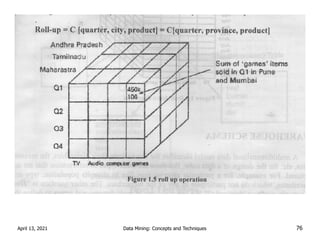
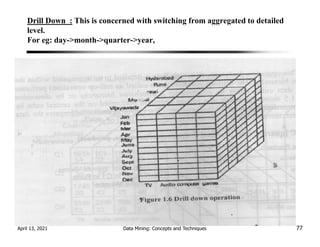
![Drilling: Moving up and down along classification
hierarchies
Drill up(Roll Up): This means switching from
detailed to an aggregated with in same classification
hierarchy.
Eg RollUp=C[quarter,city,product]=C[quarter,
province. product]
April 13, 2021 Data Mining: Concepts and Techniques 75](https://image.slidesharecdn.com/dataminingmod1ppt-240401055752-fb1a5f0f/85/Data-Mining-mod1-ppt-pdf-bca-sixth-semester-notes-75-320.jpg)
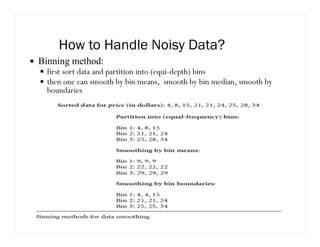
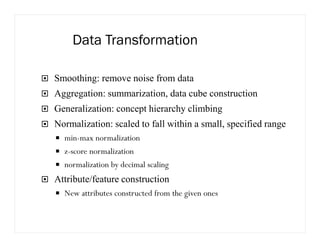
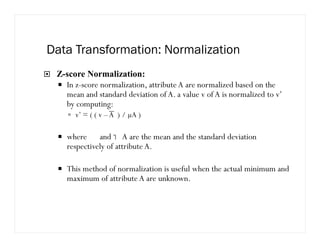
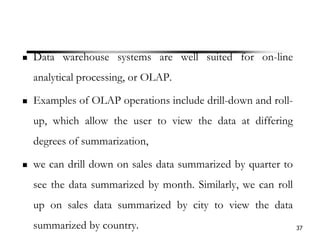
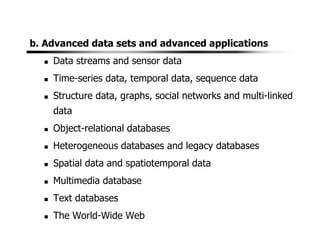
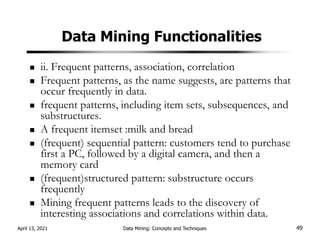
![Data Transformation: Normalization
min-max normalization
Min-max normalization performs a linear transformation on the original
data.
Suppose that mina and maxa are the minimum and the maximum values
for attribute A. Min-max normalization maps a value v of A to v’ in the
range [new-mina, new-maxa] by computing:
v’= ( (v-mina) / (maxa – mina) ) * (new-maxa – newmina)+ new-mina](https://image.slidesharecdn.com/dataminingmod1ppt-240401055752-fb1a5f0f/85/Data-Mining-mod1-ppt-pdf-bca-sixth-semester-notes-113-320.jpg)