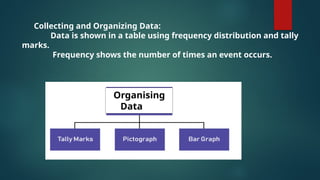
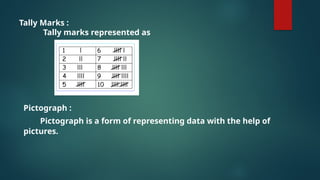
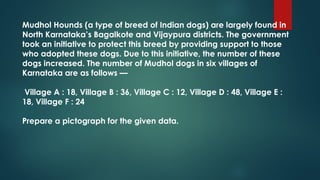
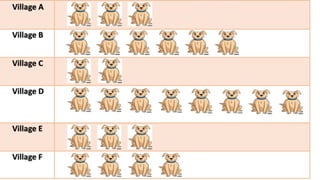
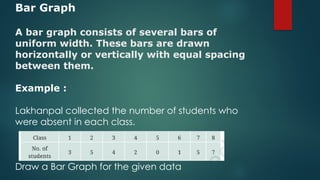
CHAPTER 4
DATA HANDLING AND PRESENTATION
DATA:
Data is a collection of raw facts and figures that give
you information. Data is organized in the form of graphs,
charts, or tables.
Organising
Dataata
Collecting and Organizing Data:
Data is shown in a table using frequency distribution and tally
marks.
Frequency shows the number of times an event occurs.
Tally Marks :
Tally marks represented as
Pictograph :
Pictograph is a form of representing data with the help of
pictures.
Mudhol Hounds (a type of breed of Indian dogs) are largely found in
North Karnataka’s Bagalkote and Vijaypura districts. The government
took an initiative to protect this breed by providing support to those
who adopted these dogs. Due to this initiative, the number of these
dogs increased. The number of Mudhol dogs in six villages of
Karnataka are as follows —
Village A : 18, Village B : 36, Village C : 12, Village D : 48, Village E :
18, Village F : 24
Prepare a pictograph for the given data.
Bar Graph
A bar graph consists of several bars of
uniform width. These bars are drawn
horizontally or vertically with equal spacing
between them.
Example :
Lakhanpal collected the number of students who
were absent in each class.
Draw a Bar Graph for the given data

Data handling GRADE 6TH CBSE MATHS.pptx

  • 3.
    CHAPTER 4 DATA HANDLINGAND PRESENTATION DATA: Data is a collection of raw facts and figures that give you information. Data is organized in the form of graphs, charts, or tables.
  • 4.
    Organising Dataata Collecting and OrganizingData: Data is shown in a table using frequency distribution and tally marks. Frequency shows the number of times an event occurs.
  • 5.
    Tally Marks : Tallymarks represented as Pictograph : Pictograph is a form of representing data with the help of pictures.
  • 6.
    Mudhol Hounds (atype of breed of Indian dogs) are largely found in North Karnataka’s Bagalkote and Vijaypura districts. The government took an initiative to protect this breed by providing support to those who adopted these dogs. Due to this initiative, the number of these dogs increased. The number of Mudhol dogs in six villages of Karnataka are as follows — Village A : 18, Village B : 36, Village C : 12, Village D : 48, Village E : 18, Village F : 24 Prepare a pictograph for the given data.
  • 8.
    Bar Graph A bargraph consists of several bars of uniform width. These bars are drawn horizontally or vertically with equal spacing between them. Example : Lakhanpal collected the number of students who were absent in each class. Draw a Bar Graph for the given data