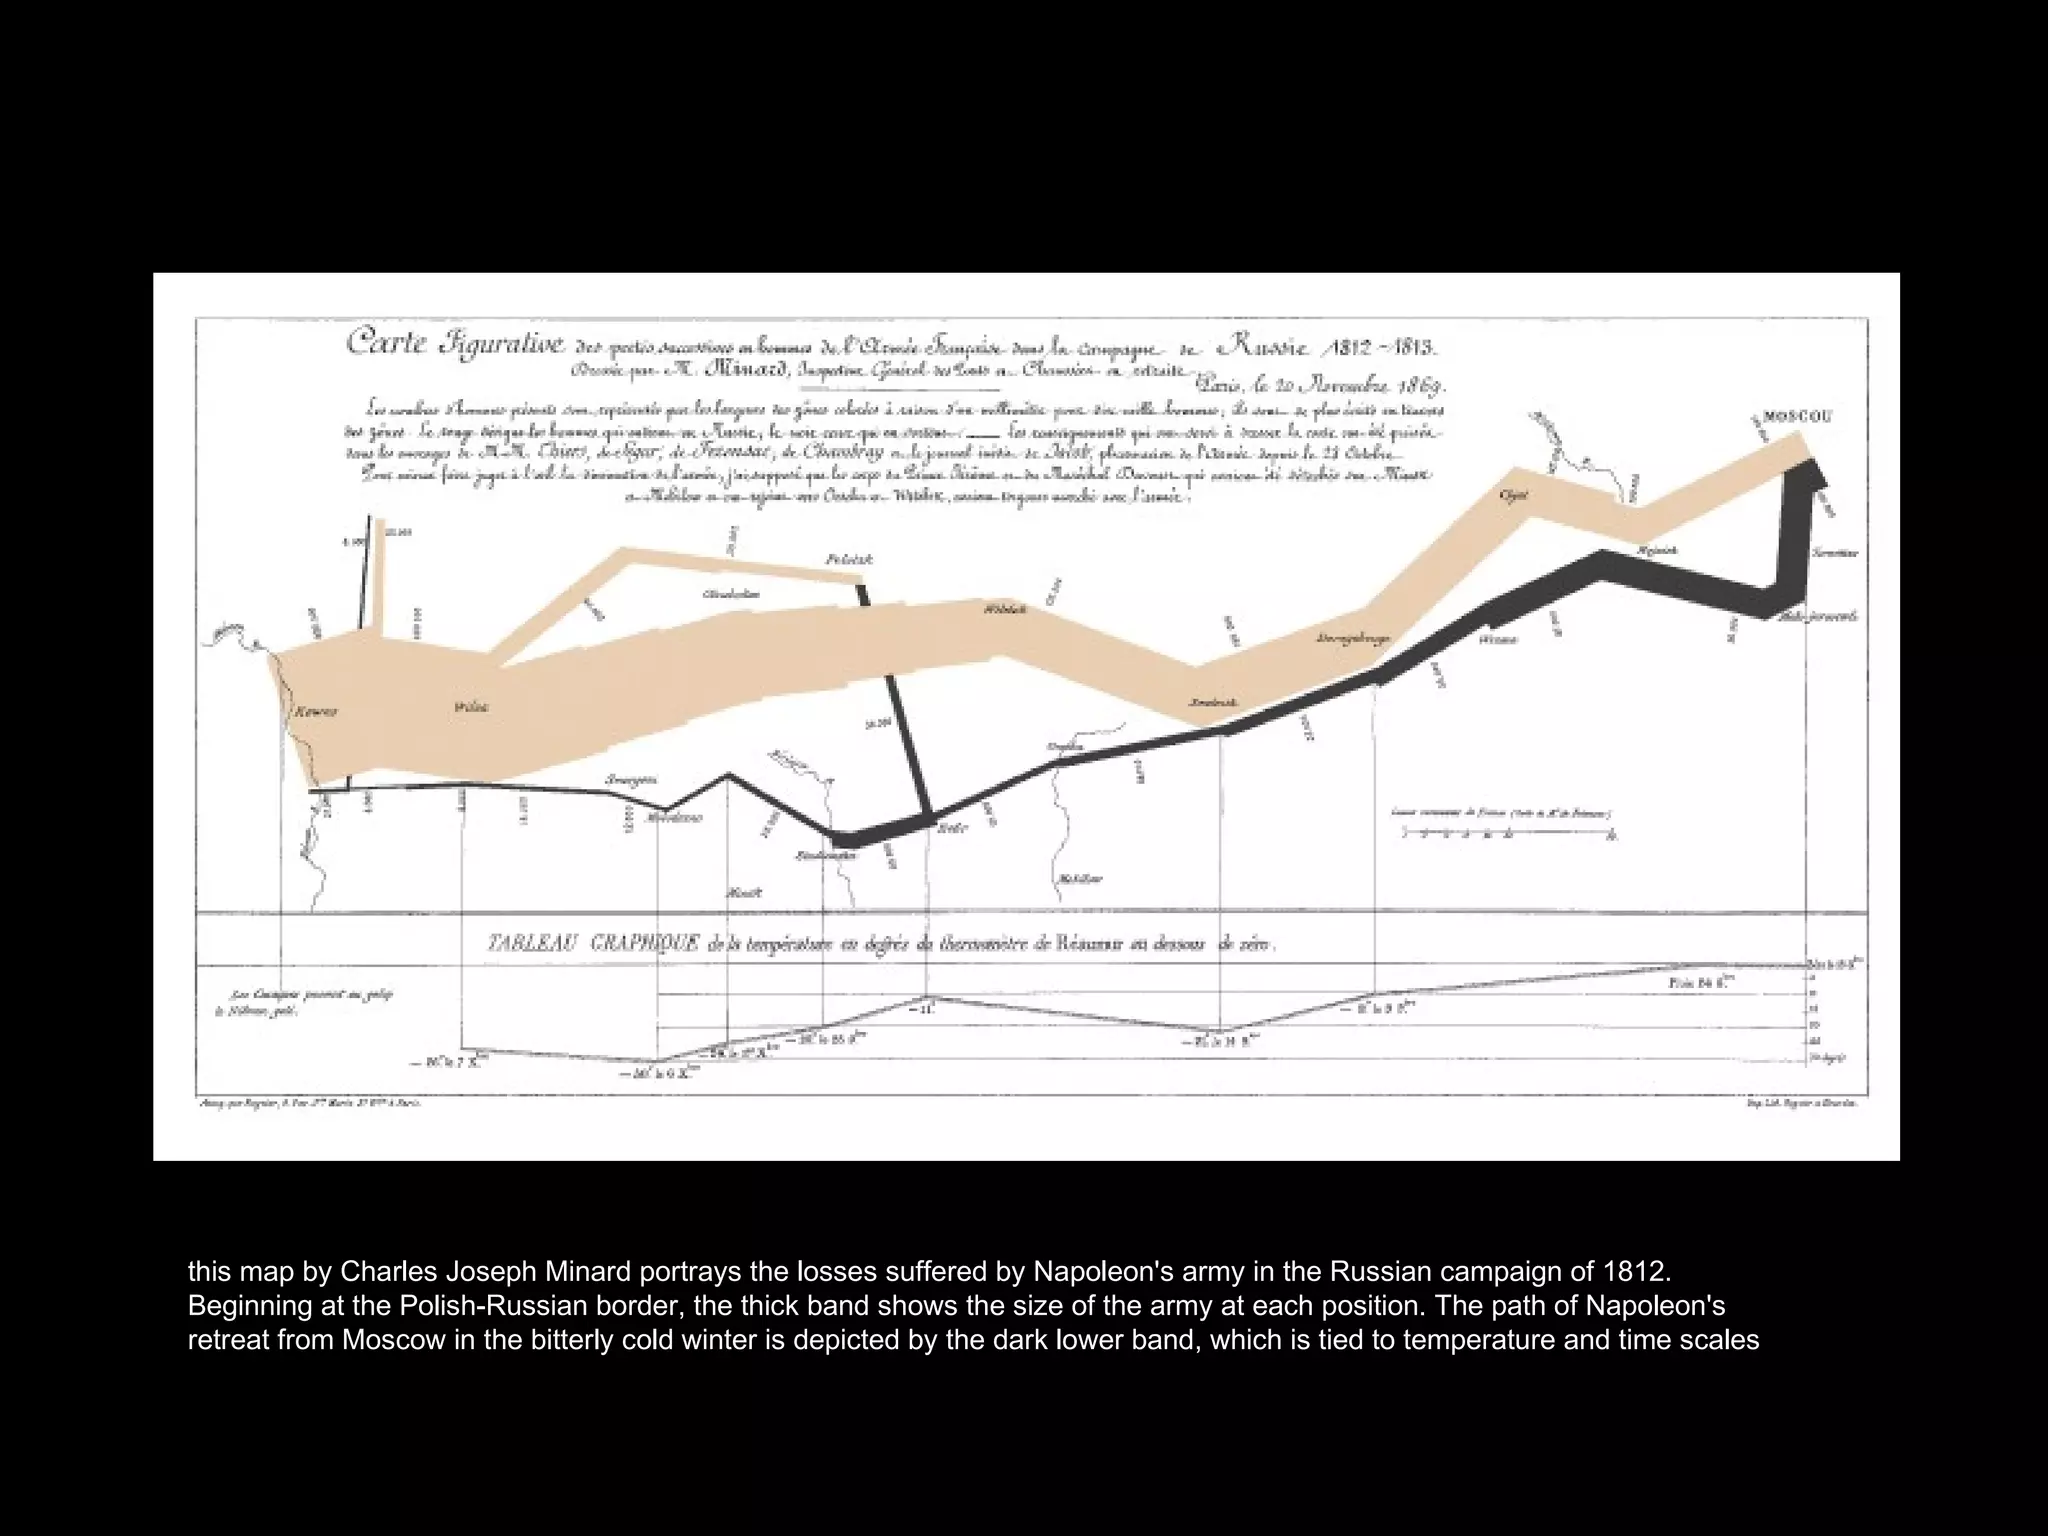
SlideShare a Scribd company logo
this map by Charles Joseph Minard portrays the losses suffered by Napoleon's army in the Russian campaign of 1812.  Beginning at the Polish-Russian border, the thick band shows the size of the army at each position. The path of Napoleon's  retreat from Moscow in the bitterly cold winter is depicted by the dark lower band, which is tied to temperature and time scales
Graphing Design Concepts
Graphical Perception Some Considerations ,[object Object],[object Object],[object Object],[object Object]
Example
Example
Example
Graphing Design Concepts ,[object Object],From Tufte, 2001)
Graphing Design Concepts ,[object Object]
Graphical Encodings ,[object Object],[object Object],[object Object],[object Object],[object Object],[object Object],[object Object],[object Object],[object Object],[object Object]
  Area, Angle, Length, Position Angle + Slope
Shading  Length
Position on Common Scale Length
Position on Identical but Non-Aligned Scales
Cleveland-McGill Scale
“ People’s accuracy in describin the embellished charts was no worse than for plain charts….and their recall after a  Two to three week gap was significantly better” (Bateman et al. 2010)

More Related Content

What's hot

How to Graphically Represent Data
How to Graphically Represent DataHow to Graphically Represent Data
How to Graphically Represent Data
coop3674
 
AshrafCGPortFolio.compressed
AshrafCGPortFolio.compressedAshrafCGPortFolio.compressed
AshrafCGPortFolio.compressedAshraf PM
 
Ortho photo in Ottawa
Ortho photo in OttawaOrtho photo in Ottawa
Ortho photo in Ottawa
Stephen
 
Schristophe3Dgeoinfo_2016
Schristophe3Dgeoinfo_2016Schristophe3Dgeoinfo_2016
Schristophe3Dgeoinfo_2016
MBrasebin
 
Engl313_HowtoGraphicallyRepresentData
Engl313_HowtoGraphicallyRepresentDataEngl313_HowtoGraphicallyRepresentData
Engl313_HowtoGraphicallyRepresentData
Shannon Dryden
 
Monitoring, graphs and visualisations
Monitoring, graphs and visualisationsMonitoring, graphs and visualisations
Monitoring, graphs and visualisations
morekid
 
Expressive Map Design: OGC SLD/SE extension for expressive mapstyles
Expressive Map Design: OGC SLD/SE extension for expressive mapstylesExpressive Map Design: OGC SLD/SE extension for expressive mapstyles
Expressive Map Design: OGC SLD/SE extension for expressive mapstyles
Sidonie Christophe
 
Pratiques historiques et actuelles
Pratiques historiques et actuellesPratiques historiques et actuelles
Pratiques historiques et actuelles
marionboucharlat
 
Map making using qgis
Map making using qgisMap making using qgis
Map making using qgis
Arnold Kilaini
 
11 1 Areas Of Rectangles
11 1 Areas Of Rectangles11 1 Areas Of Rectangles
11 1 Areas Of RectanglesMr. Hohman
 
GI2016 ppt shi (cartography and communication)
GI2016 ppt shi (cartography and communication)GI2016 ppt shi (cartography and communication)
GI2016 ppt shi (cartography and communication)
IGN Vorstand
 
Thalys - Thalys Neige
Thalys - Thalys NeigeThalys - Thalys Neige
Thalys - Thalys Neige
ENGAGE BBDO
 
Application of Structure-from-Motion Photogrammetry for Erosion Processes Mon...
Application of Structure-from-Motion Photogrammetry for Erosion Processes Mon...Application of Structure-from-Motion Photogrammetry for Erosion Processes Mon...
Application of Structure-from-Motion Photogrammetry for Erosion Processes Mon...
imar-uniri
 
Solar energy
Solar energySolar energy
Solar energy
Althuraia
 
I SEE - Visualisation Patterns #dare13
I SEE - Visualisation Patterns #dare13I SEE - Visualisation Patterns #dare13
I SEE - Visualisation Patterns #dare13
Egor Sviridenko
 
5.2 Slope
5.2 Slope5.2 Slope
5.2 Slope
ramjdram
 
Justin alm 4th yr core design - phase 3 presentation
Justin alm    4th yr core design - phase 3 presentationJustin alm    4th yr core design - phase 3 presentation
Justin alm 4th yr core design - phase 3 presentation
Justin Alm
 
Mapping Notes PowerPoint
Mapping Notes PowerPointMapping Notes PowerPoint
Mapping Notes PowerPointranknfile
 
Session 2 case studies
Session 2 case studiesSession 2 case studies
Session 2 case studies
rkottam
 

What's hot (20)

How to Graphically Represent Data
How to Graphically Represent DataHow to Graphically Represent Data
How to Graphically Represent Data
 
AshrafCGPortFolio.compressed
AshrafCGPortFolio.compressedAshrafCGPortFolio.compressed
AshrafCGPortFolio.compressed
 
Ortho photo in Ottawa
Ortho photo in OttawaOrtho photo in Ottawa
Ortho photo in Ottawa
 
Schristophe3Dgeoinfo_2016
Schristophe3Dgeoinfo_2016Schristophe3Dgeoinfo_2016
Schristophe3Dgeoinfo_2016
 
Engl313_HowtoGraphicallyRepresentData
Engl313_HowtoGraphicallyRepresentDataEngl313_HowtoGraphicallyRepresentData
Engl313_HowtoGraphicallyRepresentData
 
Monitoring, graphs and visualisations
Monitoring, graphs and visualisationsMonitoring, graphs and visualisations
Monitoring, graphs and visualisations
 
Expressive Map Design: OGC SLD/SE extension for expressive mapstyles
Expressive Map Design: OGC SLD/SE extension for expressive mapstylesExpressive Map Design: OGC SLD/SE extension for expressive mapstyles
Expressive Map Design: OGC SLD/SE extension for expressive mapstyles
 
Pratiques historiques et actuelles
Pratiques historiques et actuellesPratiques historiques et actuelles
Pratiques historiques et actuelles
 
Map making using qgis
Map making using qgisMap making using qgis
Map making using qgis
 
11 1 Areas Of Rectangles
11 1 Areas Of Rectangles11 1 Areas Of Rectangles
11 1 Areas Of Rectangles
 
GI2016 ppt shi (cartography and communication)
GI2016 ppt shi (cartography and communication)GI2016 ppt shi (cartography and communication)
GI2016 ppt shi (cartography and communication)
 
Thalys - Thalys Neige
Thalys - Thalys NeigeThalys - Thalys Neige
Thalys - Thalys Neige
 
Application of Structure-from-Motion Photogrammetry for Erosion Processes Mon...
Application of Structure-from-Motion Photogrammetry for Erosion Processes Mon...Application of Structure-from-Motion Photogrammetry for Erosion Processes Mon...
Application of Structure-from-Motion Photogrammetry for Erosion Processes Mon...
 
Solar energy
Solar energySolar energy
Solar energy
 
Making data visual
Making data visualMaking data visual
Making data visual
 
I SEE - Visualisation Patterns #dare13
I SEE - Visualisation Patterns #dare13I SEE - Visualisation Patterns #dare13
I SEE - Visualisation Patterns #dare13
 
5.2 Slope
5.2 Slope5.2 Slope
5.2 Slope
 
Justin alm 4th yr core design - phase 3 presentation
Justin alm    4th yr core design - phase 3 presentationJustin alm    4th yr core design - phase 3 presentation
Justin alm 4th yr core design - phase 3 presentation
 
Mapping Notes PowerPoint
Mapping Notes PowerPointMapping Notes PowerPoint
Mapping Notes PowerPoint
 
Session 2 case studies
Session 2 case studiesSession 2 case studies
Session 2 case studies
 

More from sconnin

RRLC Workshop
RRLC WorkshopRRLC Workshop
RRLC Workshopsconnin
 
Berea visual literacy
Berea visual literacyBerea visual literacy
Berea visual literacysconnin
 
Newest visual literacy
Newest  visual literacyNewest  visual literacy
Newest visual literacy
sconnin
 
Critical thinking with data
Critical thinking with dataCritical thinking with data
Critical thinking with datasconnin
 
New visual literacy
New visual literacyNew visual literacy
New visual literacysconnin
 
Askayworkshop
AskayworkshopAskayworkshop
Askayworkshopsconnin
 

More from sconnin (8)

UWEX P
UWEX PUWEX P
UWEX P
 
RRLC Workshop
RRLC WorkshopRRLC Workshop
RRLC Workshop
 
Berea visual literacy
Berea visual literacyBerea visual literacy
Berea visual literacy
 
Newest visual literacy
Newest  visual literacyNewest  visual literacy
Newest visual literacy
 
Critical thinking with data
Critical thinking with dataCritical thinking with data
Critical thinking with data
 
New visual literacy
New visual literacyNew visual literacy
New visual literacy
 
Askayworkshop
AskayworkshopAskayworkshop
Askayworkshop
 
AUGE
AUGEAUGE
AUGE
 

Recently uploaded

DevOps and Testing slides at DASA Connect
DevOps and Testing slides at DASA ConnectDevOps and Testing slides at DASA Connect
DevOps and Testing slides at DASA Connect
Kari Kakkonen
 
Microsoft - Power Platform_G.Aspiotis.pdf
Microsoft - Power Platform_G.Aspiotis.pdfMicrosoft - Power Platform_G.Aspiotis.pdf
Microsoft - Power Platform_G.Aspiotis.pdf
Uni Systems S.M.S.A.
 
Epistemic Interaction - tuning interfaces to provide information for AI support
Epistemic Interaction - tuning interfaces to provide information for AI supportEpistemic Interaction - tuning interfaces to provide information for AI support
Epistemic Interaction - tuning interfaces to provide information for AI support
Alan Dix
 
PHP Frameworks: I want to break free (IPC Berlin 2024)
PHP Frameworks: I want to break free (IPC Berlin 2024)PHP Frameworks: I want to break free (IPC Berlin 2024)
PHP Frameworks: I want to break free (IPC Berlin 2024)
Ralf Eggert
 
Smart TV Buyer Insights Survey 2024 by 91mobiles.pdf
Smart TV Buyer Insights Survey 2024 by 91mobiles.pdfSmart TV Buyer Insights Survey 2024 by 91mobiles.pdf
Smart TV Buyer Insights Survey 2024 by 91mobiles.pdf
91mobiles
 
FIDO Alliance Osaka Seminar: The WebAuthn API and Discoverable Credentials.pdf
FIDO Alliance Osaka Seminar: The WebAuthn API and Discoverable Credentials.pdfFIDO Alliance Osaka Seminar: The WebAuthn API and Discoverable Credentials.pdf
FIDO Alliance Osaka Seminar: The WebAuthn API and Discoverable Credentials.pdf
FIDO Alliance
 
Video Streaming: Then, Now, and in the Future
Video Streaming: Then, Now, and in the FutureVideo Streaming: Then, Now, and in the Future
Video Streaming: Then, Now, and in the Future
Alpen-Adria-Universität
 
UiPath Test Automation using UiPath Test Suite series, part 5
UiPath Test Automation using UiPath Test Suite series, part 5UiPath Test Automation using UiPath Test Suite series, part 5
UiPath Test Automation using UiPath Test Suite series, part 5
DianaGray10
 
SAP Sapphire 2024 - ASUG301 building better apps with SAP Fiori.pdf
SAP Sapphire 2024 - ASUG301 building better apps with SAP Fiori.pdfSAP Sapphire 2024 - ASUG301 building better apps with SAP Fiori.pdf
SAP Sapphire 2024 - ASUG301 building better apps with SAP Fiori.pdf
Peter Spielvogel
 
Why You Should Replace Windows 11 with Nitrux Linux 3.5.0 for enhanced perfor...
Why You Should Replace Windows 11 with Nitrux Linux 3.5.0 for enhanced perfor...Why You Should Replace Windows 11 with Nitrux Linux 3.5.0 for enhanced perfor...
Why You Should Replace Windows 11 with Nitrux Linux 3.5.0 for enhanced perfor...
SOFTTECHHUB
 
GraphSummit Singapore | The Art of the Possible with Graph - Q2 2024
GraphSummit Singapore | The Art of the  Possible with Graph - Q2 2024GraphSummit Singapore | The Art of the  Possible with Graph - Q2 2024
GraphSummit Singapore | The Art of the Possible with Graph - Q2 2024
Neo4j
 
National Security Agency - NSA mobile device best practices
National Security Agency - NSA mobile device best practicesNational Security Agency - NSA mobile device best practices
National Security Agency - NSA mobile device best practices
Quotidiano Piemontese
 
FIDO Alliance Osaka Seminar: Overview.pdf
FIDO Alliance Osaka Seminar: Overview.pdfFIDO Alliance Osaka Seminar: Overview.pdf
FIDO Alliance Osaka Seminar: Overview.pdf
FIDO Alliance
 
Uni Systems Copilot event_05062024_C.Vlachos.pdf
Uni Systems Copilot event_05062024_C.Vlachos.pdfUni Systems Copilot event_05062024_C.Vlachos.pdf
Uni Systems Copilot event_05062024_C.Vlachos.pdf
Uni Systems S.M.S.A.
 
Generative AI Deep Dive: Advancing from Proof of Concept to Production
Generative AI Deep Dive: Advancing from Proof of Concept to ProductionGenerative AI Deep Dive: Advancing from Proof of Concept to Production
Generative AI Deep Dive: Advancing from Proof of Concept to Production
Aggregage
 
Climate Impact of Software Testing at Nordic Testing Days
Climate Impact of Software Testing at Nordic Testing DaysClimate Impact of Software Testing at Nordic Testing Days
Climate Impact of Software Testing at Nordic Testing Days
Kari Kakkonen
 
GraphSummit Singapore | Enhancing Changi Airport Group's Passenger Experience...
GraphSummit Singapore | Enhancing Changi Airport Group's Passenger Experience...GraphSummit Singapore | Enhancing Changi Airport Group's Passenger Experience...
GraphSummit Singapore | Enhancing Changi Airport Group's Passenger Experience...
Neo4j
 
GraphSummit Singapore | Graphing Success: Revolutionising Organisational Stru...
GraphSummit Singapore | Graphing Success: Revolutionising Organisational Stru...GraphSummit Singapore | Graphing Success: Revolutionising Organisational Stru...
GraphSummit Singapore | Graphing Success: Revolutionising Organisational Stru...
Neo4j
 
The Art of the Pitch: WordPress Relationships and Sales
The Art of the Pitch: WordPress Relationships and SalesThe Art of the Pitch: WordPress Relationships and Sales
The Art of the Pitch: WordPress Relationships and Sales
Laura Byrne
 
GDG Cloud Southlake #33: Boule & Rebala: Effective AppSec in SDLC using Deplo...
GDG Cloud Southlake #33: Boule & Rebala: Effective AppSec in SDLC using Deplo...GDG Cloud Southlake #33: Boule & Rebala: Effective AppSec in SDLC using Deplo...
GDG Cloud Southlake #33: Boule & Rebala: Effective AppSec in SDLC using Deplo...
James Anderson
 

Recently uploaded (20)

DevOps and Testing slides at DASA Connect
DevOps and Testing slides at DASA ConnectDevOps and Testing slides at DASA Connect
DevOps and Testing slides at DASA Connect
 
Microsoft - Power Platform_G.Aspiotis.pdf
Microsoft - Power Platform_G.Aspiotis.pdfMicrosoft - Power Platform_G.Aspiotis.pdf
Microsoft - Power Platform_G.Aspiotis.pdf
 
Epistemic Interaction - tuning interfaces to provide information for AI support
Epistemic Interaction - tuning interfaces to provide information for AI supportEpistemic Interaction - tuning interfaces to provide information for AI support
Epistemic Interaction - tuning interfaces to provide information for AI support
 
PHP Frameworks: I want to break free (IPC Berlin 2024)
PHP Frameworks: I want to break free (IPC Berlin 2024)PHP Frameworks: I want to break free (IPC Berlin 2024)
PHP Frameworks: I want to break free (IPC Berlin 2024)
 
Smart TV Buyer Insights Survey 2024 by 91mobiles.pdf
Smart TV Buyer Insights Survey 2024 by 91mobiles.pdfSmart TV Buyer Insights Survey 2024 by 91mobiles.pdf
Smart TV Buyer Insights Survey 2024 by 91mobiles.pdf
 
FIDO Alliance Osaka Seminar: The WebAuthn API and Discoverable Credentials.pdf
FIDO Alliance Osaka Seminar: The WebAuthn API and Discoverable Credentials.pdfFIDO Alliance Osaka Seminar: The WebAuthn API and Discoverable Credentials.pdf
FIDO Alliance Osaka Seminar: The WebAuthn API and Discoverable Credentials.pdf
 
Video Streaming: Then, Now, and in the Future
Video Streaming: Then, Now, and in the FutureVideo Streaming: Then, Now, and in the Future
Video Streaming: Then, Now, and in the Future
 
UiPath Test Automation using UiPath Test Suite series, part 5
UiPath Test Automation using UiPath Test Suite series, part 5UiPath Test Automation using UiPath Test Suite series, part 5
UiPath Test Automation using UiPath Test Suite series, part 5
 
SAP Sapphire 2024 - ASUG301 building better apps with SAP Fiori.pdf
SAP Sapphire 2024 - ASUG301 building better apps with SAP Fiori.pdfSAP Sapphire 2024 - ASUG301 building better apps with SAP Fiori.pdf
SAP Sapphire 2024 - ASUG301 building better apps with SAP Fiori.pdf
 
Why You Should Replace Windows 11 with Nitrux Linux 3.5.0 for enhanced perfor...
Why You Should Replace Windows 11 with Nitrux Linux 3.5.0 for enhanced perfor...Why You Should Replace Windows 11 with Nitrux Linux 3.5.0 for enhanced perfor...
Why You Should Replace Windows 11 with Nitrux Linux 3.5.0 for enhanced perfor...
 
GraphSummit Singapore | The Art of the Possible with Graph - Q2 2024
GraphSummit Singapore | The Art of the  Possible with Graph - Q2 2024GraphSummit Singapore | The Art of the  Possible with Graph - Q2 2024
GraphSummit Singapore | The Art of the Possible with Graph - Q2 2024
 
National Security Agency - NSA mobile device best practices
National Security Agency - NSA mobile device best practicesNational Security Agency - NSA mobile device best practices
National Security Agency - NSA mobile device best practices
 
FIDO Alliance Osaka Seminar: Overview.pdf
FIDO Alliance Osaka Seminar: Overview.pdfFIDO Alliance Osaka Seminar: Overview.pdf
FIDO Alliance Osaka Seminar: Overview.pdf
 
Uni Systems Copilot event_05062024_C.Vlachos.pdf
Uni Systems Copilot event_05062024_C.Vlachos.pdfUni Systems Copilot event_05062024_C.Vlachos.pdf
Uni Systems Copilot event_05062024_C.Vlachos.pdf
 
Generative AI Deep Dive: Advancing from Proof of Concept to Production
Generative AI Deep Dive: Advancing from Proof of Concept to ProductionGenerative AI Deep Dive: Advancing from Proof of Concept to Production
Generative AI Deep Dive: Advancing from Proof of Concept to Production
 
Climate Impact of Software Testing at Nordic Testing Days
Climate Impact of Software Testing at Nordic Testing DaysClimate Impact of Software Testing at Nordic Testing Days
Climate Impact of Software Testing at Nordic Testing Days
 
GraphSummit Singapore | Enhancing Changi Airport Group's Passenger Experience...
GraphSummit Singapore | Enhancing Changi Airport Group's Passenger Experience...GraphSummit Singapore | Enhancing Changi Airport Group's Passenger Experience...
GraphSummit Singapore | Enhancing Changi Airport Group's Passenger Experience...
 
GraphSummit Singapore | Graphing Success: Revolutionising Organisational Stru...
GraphSummit Singapore | Graphing Success: Revolutionising Organisational Stru...GraphSummit Singapore | Graphing Success: Revolutionising Organisational Stru...
GraphSummit Singapore | Graphing Success: Revolutionising Organisational Stru...
 
The Art of the Pitch: WordPress Relationships and Sales
The Art of the Pitch: WordPress Relationships and SalesThe Art of the Pitch: WordPress Relationships and Sales
The Art of the Pitch: WordPress Relationships and Sales
 
GDG Cloud Southlake #33: Boule & Rebala: Effective AppSec in SDLC using Deplo...
GDG Cloud Southlake #33: Boule & Rebala: Effective AppSec in SDLC using Deplo...GDG Cloud Southlake #33: Boule & Rebala: Effective AppSec in SDLC using Deplo...
GDG Cloud Southlake #33: Boule & Rebala: Effective AppSec in SDLC using Deplo...
 

Data graphics - CAMP

Editor's Notes

  1. Power of a graph is the ability to enable one to take in the quantitative information, organize it, and see patterns and structure not readily revealed by other means of studying the data. Graphs function in analysis and communication A graph is successful only if the information contained can be readily decoded – interpretation and generalization/extrapolation follow this step. must effectively support specific cognitive processes in order to promote learning
  2. perceptual features of visualizations can interfere with successful comprehension power of graphs comes from our preattentive visual system to detect geometric patterns and assess magnitudes. Such patterns are integrated in our ability to retrieve quantitative and qualitative meaning. preattentive vision follows from our ability to recognize and decipher pattern.
  3. Preattentive decoding of color
  4. Preattentive decoding of shape
  5. See segregation on the left via. color even though shapes are mixed See random pattern on right due to color, even though the shapes are segregated Color is visually dominant here. Decoding can be complicated by competing visual cues. We need to be aware of such interactions.
  6. Balance of imports and exports from England
  7. Categorical encodings 3 judgments per encoding 10 reps per subject 127 experimental subjects Criterion - Error = (judge%-true%) Note – each encoding represents a single parameter design. Cleveland didn’t look at the relative effectiveness of multiple parameter designs.
  8. our visual system is geared to judging angle rather than slope * Angle contamination of slope. We are trying to judge the ratio of the slope of line segment BC to line segment AB in the three panels. The ratio is the same in all three
  9. statistical maps that use shading are commonly used for portraying measurements as a function of geographical location. To judge the values of a real variable encoded on a patch map with shading, one must perform the elementary perceptual task of judging shading, which is at the bottom of our perceptual hierarchy. Can use framed-rectangles Its also worth noting the emotional impact of color. Here murder rates are represented using black. This may elicit a strong emotional reaction that can impact one’s ability to view the information objectively. Also notice the impact of shape. The area of Florida is > twice the square mileage than that of Georgia but this fact is obscured because of their relative shapes. Georgia = 69700 square miles and Florida = 170304 square miles.
  10. * Divided bar chart requires judgment of length and position
  11. Note: subsequent studies suggest that this hierarchy isnt clear cut. In general, area and volume create less accurate encoding responses than the remainder. Outright discrimination between the other parameters varies from study to study.