


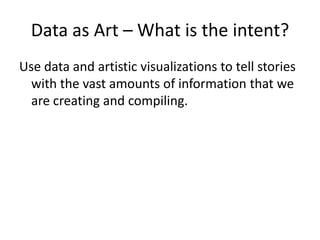
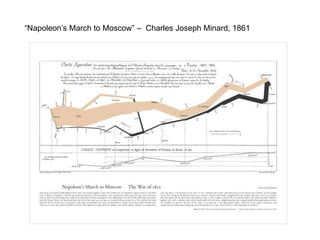
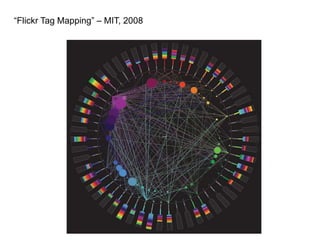

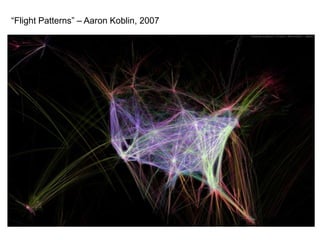

This document discusses data as art and provides examples of artistic visualizations that tell stories with data. It begins with an introduction of the presenter and an overview of using data to create art. Examples shown include visualizations of Napoleon's march to Moscow in 1861, Flickr tag mapping from 2008, flight patterns from 2007, and recordings of daily activities in Boston from 2009. The goal of data art is to use vast amounts of information in creative ways to influence the senses, emotions, and intellect.


