Downloaded 48 times
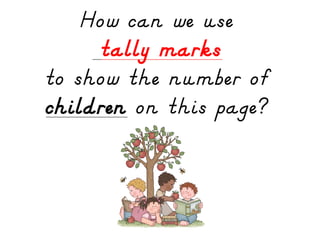
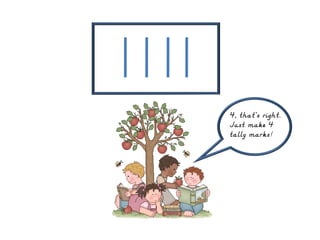
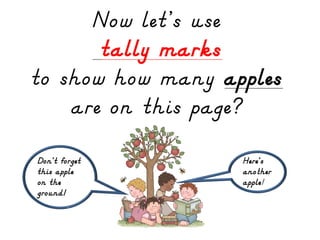

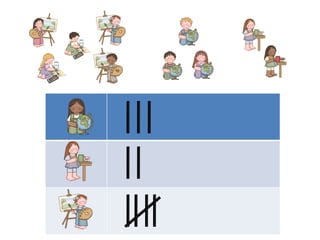
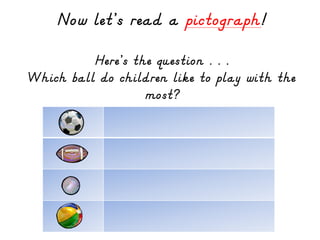
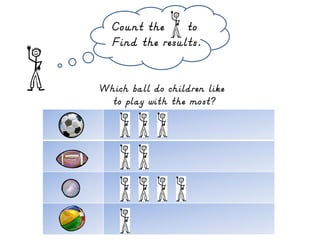
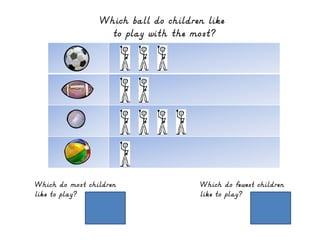
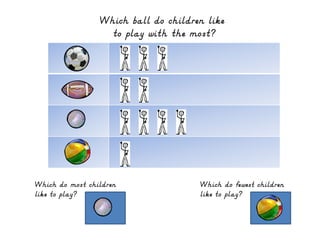
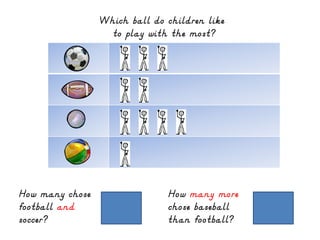
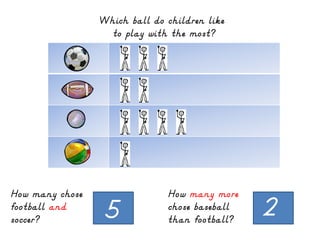
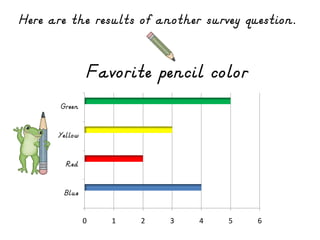
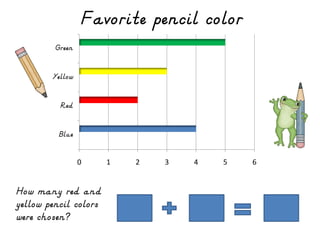
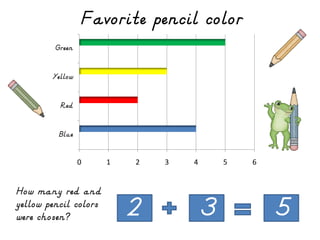
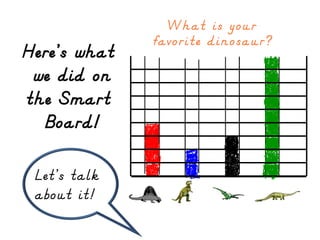

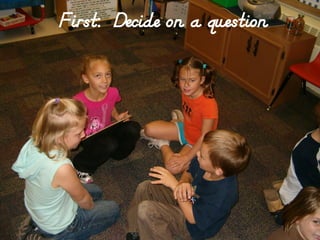
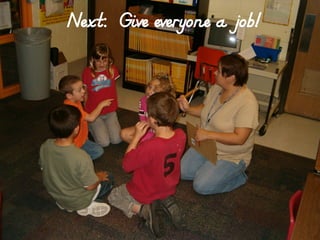

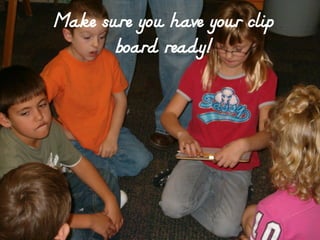
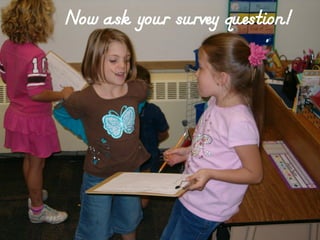
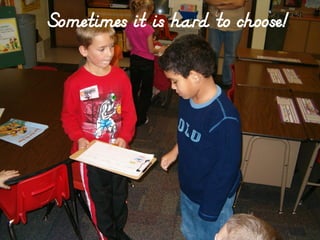
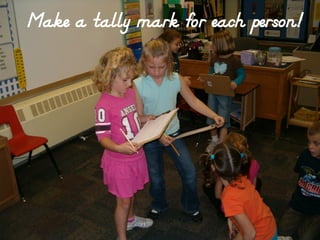

The document provides instructions and examples for using tally marks and creating pictographs and bar graphs to display survey results. It discusses conducting a survey by deciding on a question, assigning roles, writing the title and choices, tallying responses, counting tally marks, and making a bar graph to show the data. Examples of tally marks counting children and apples are shown. Pictographs display survey results about children's favorite balls and pencil colors and ask questions about interpreting the data.