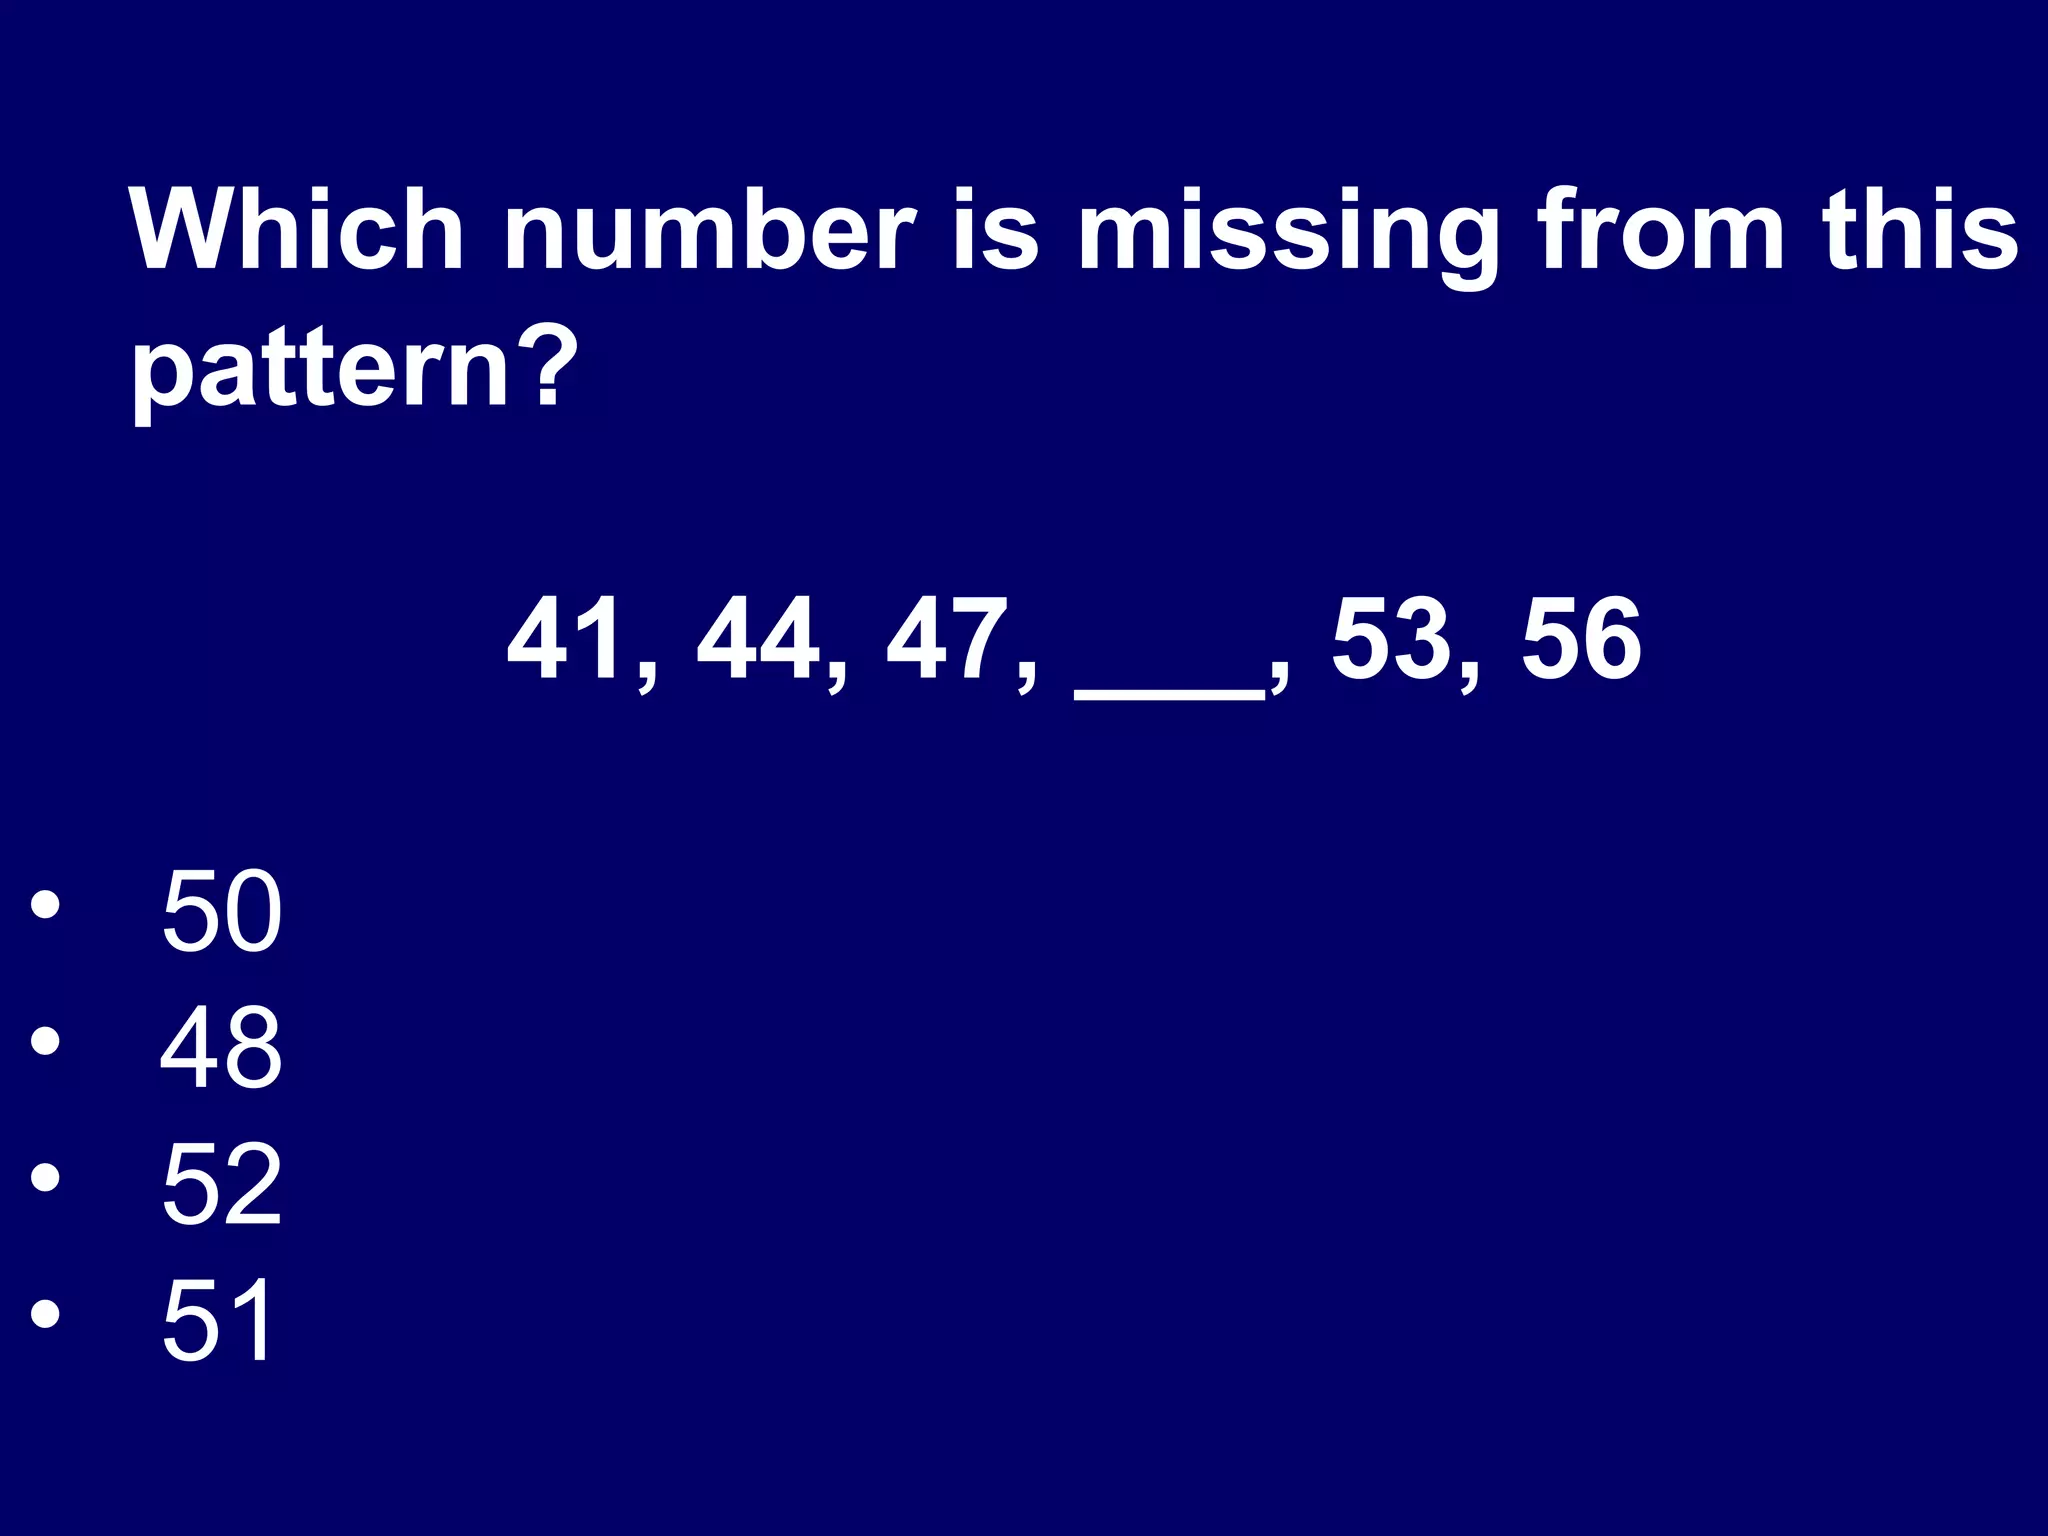
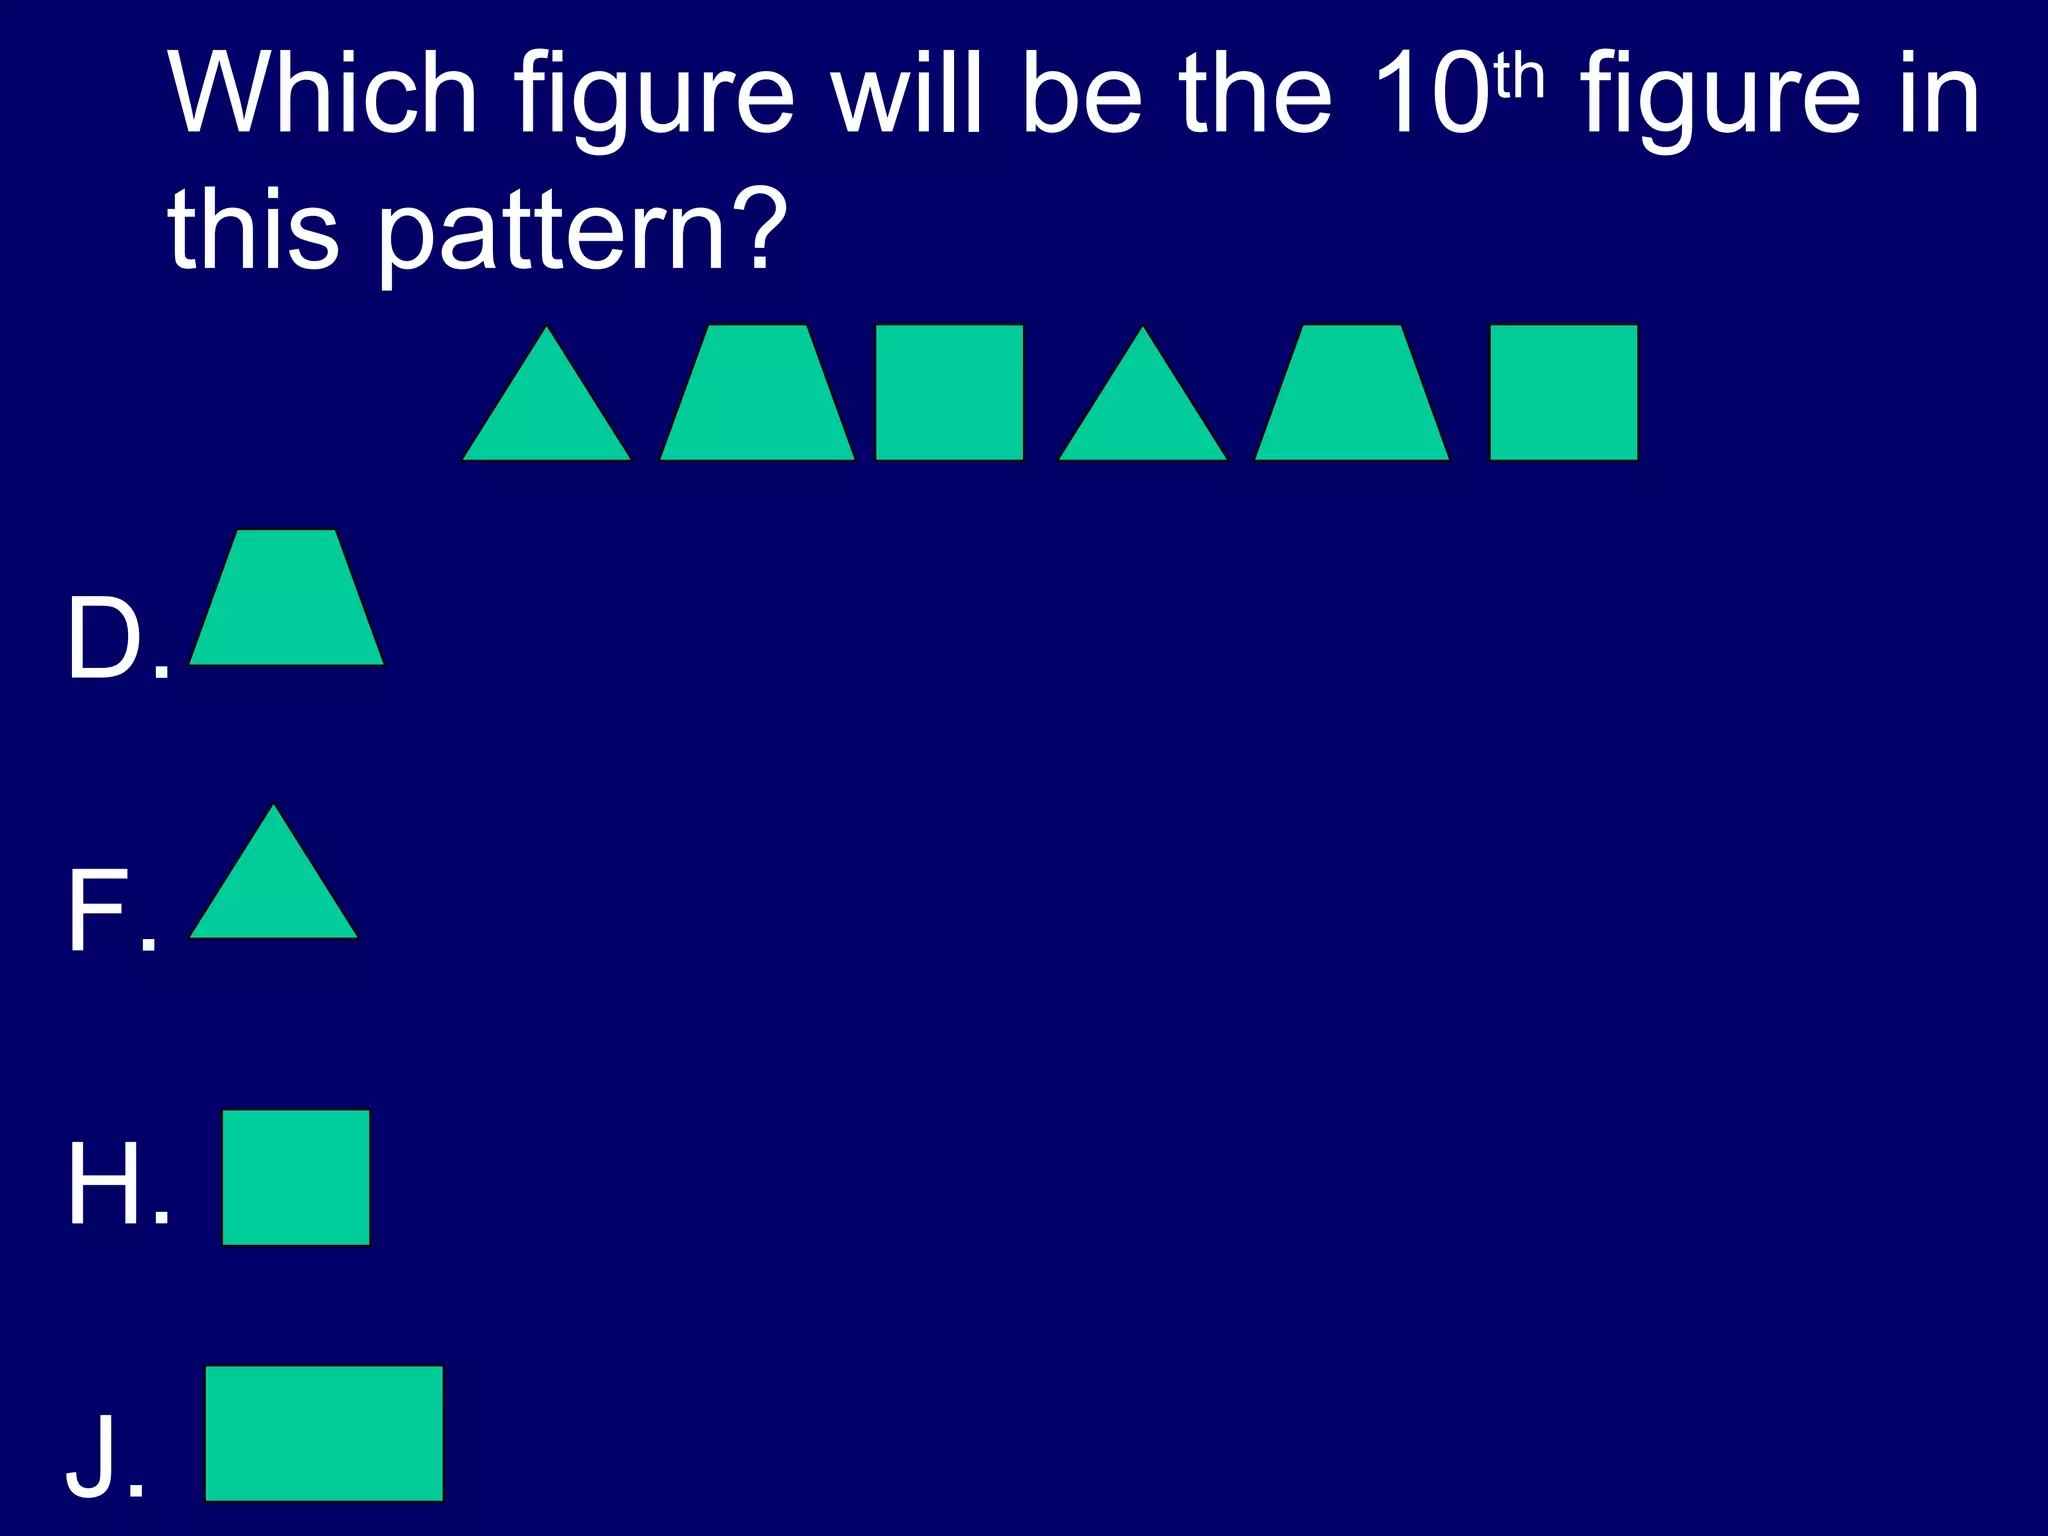
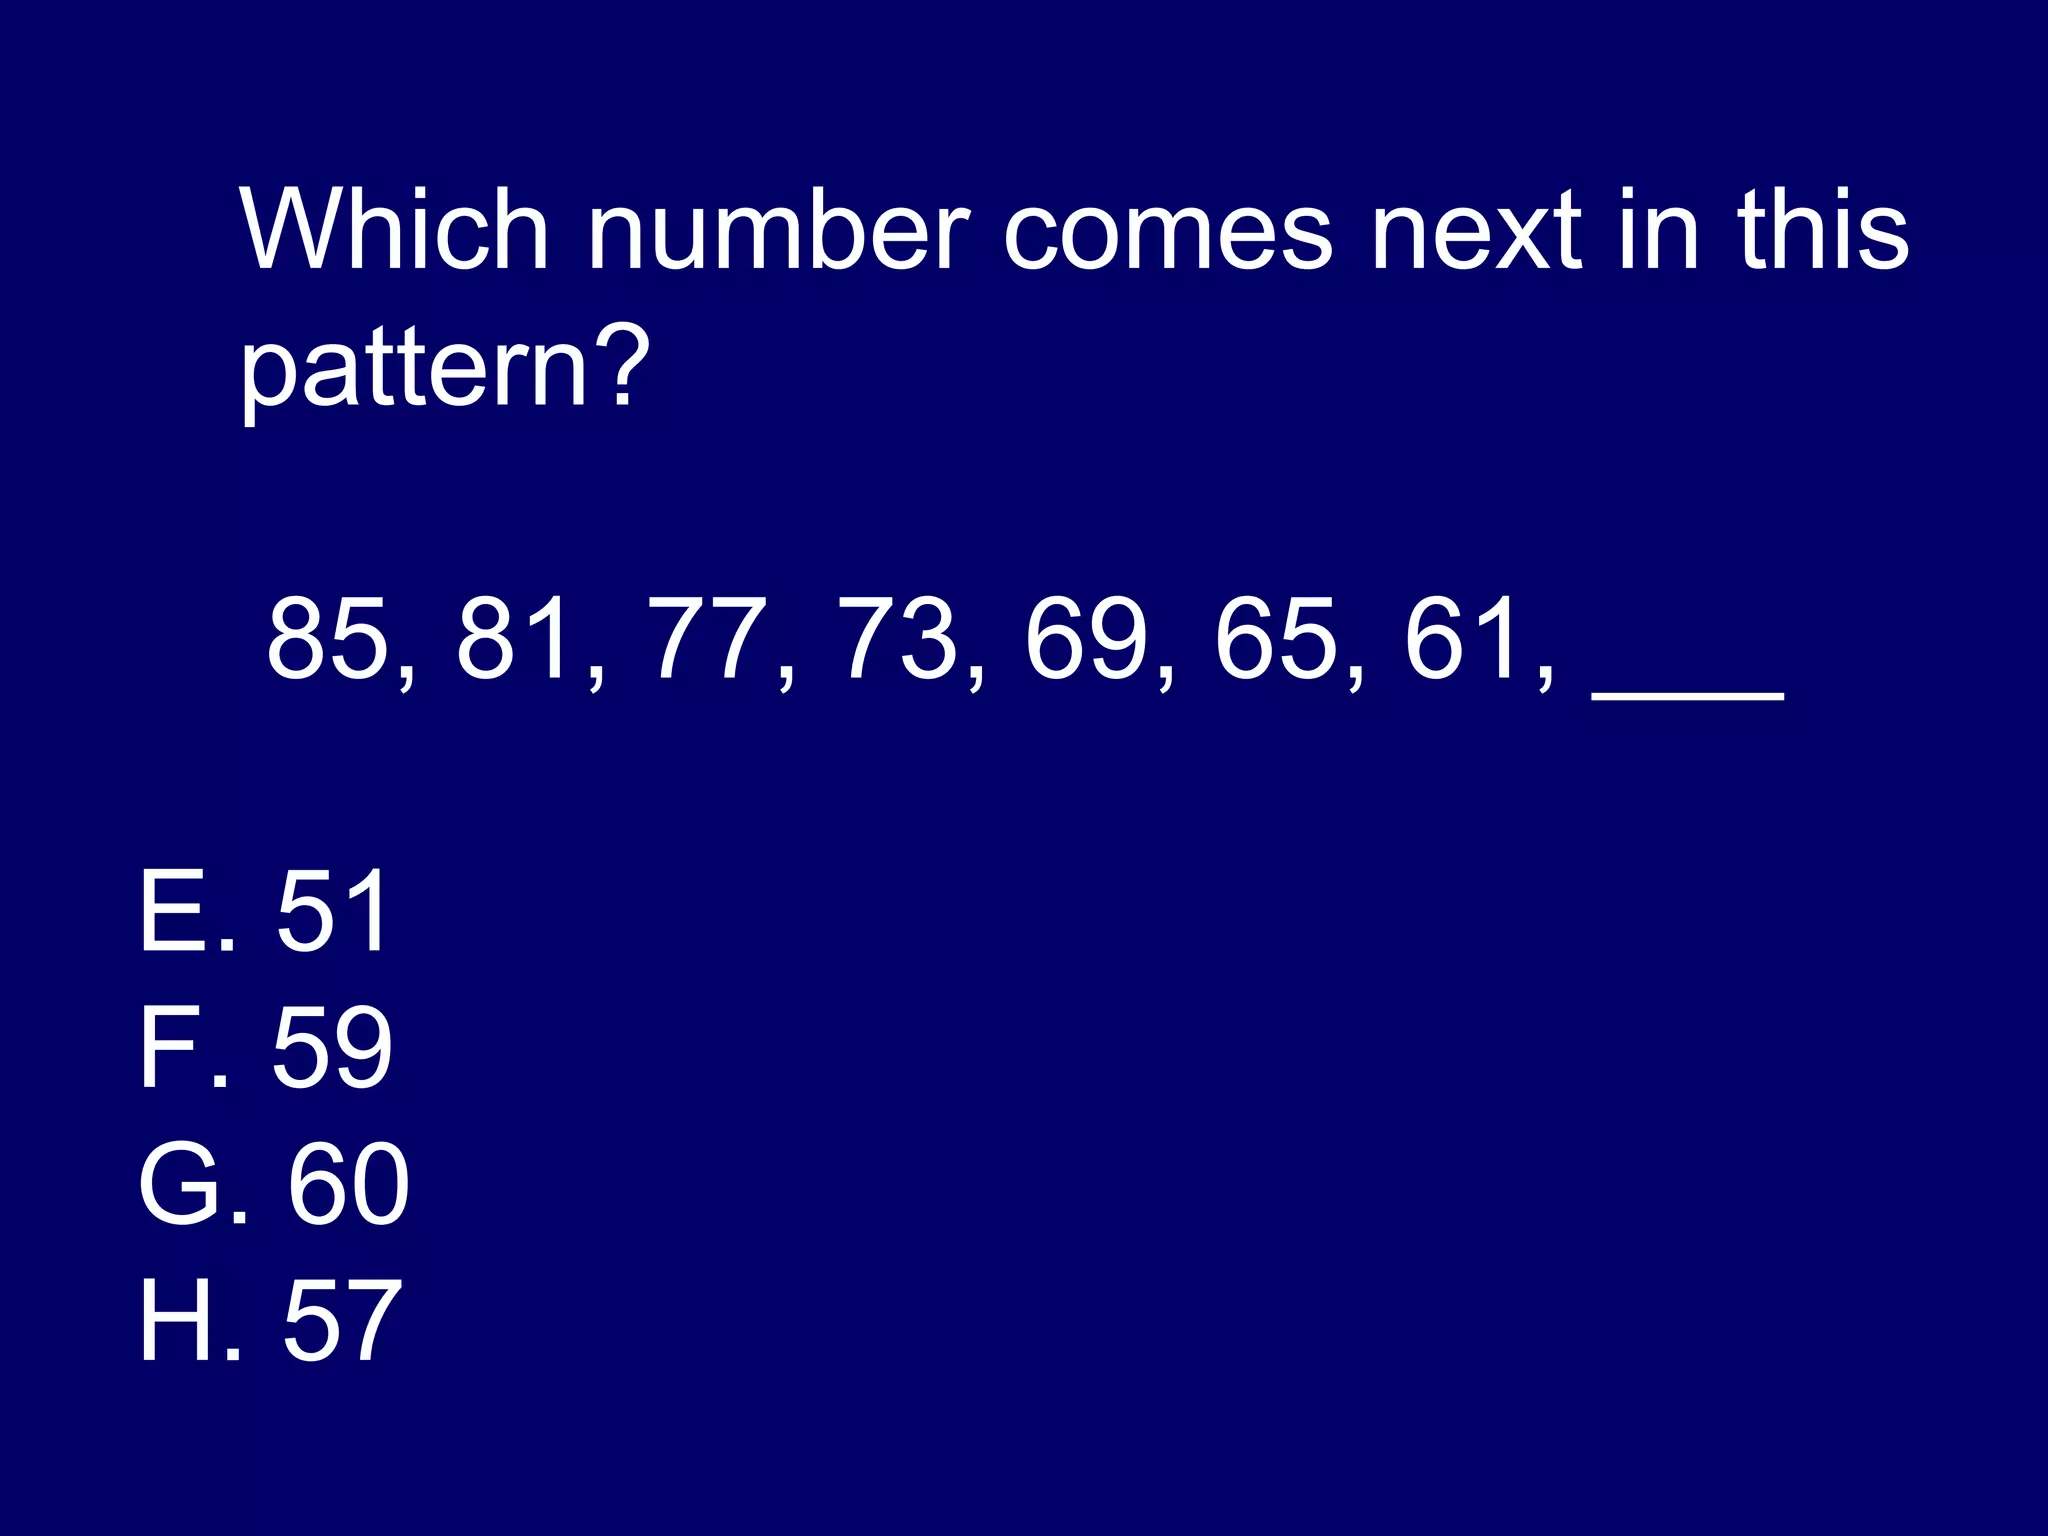
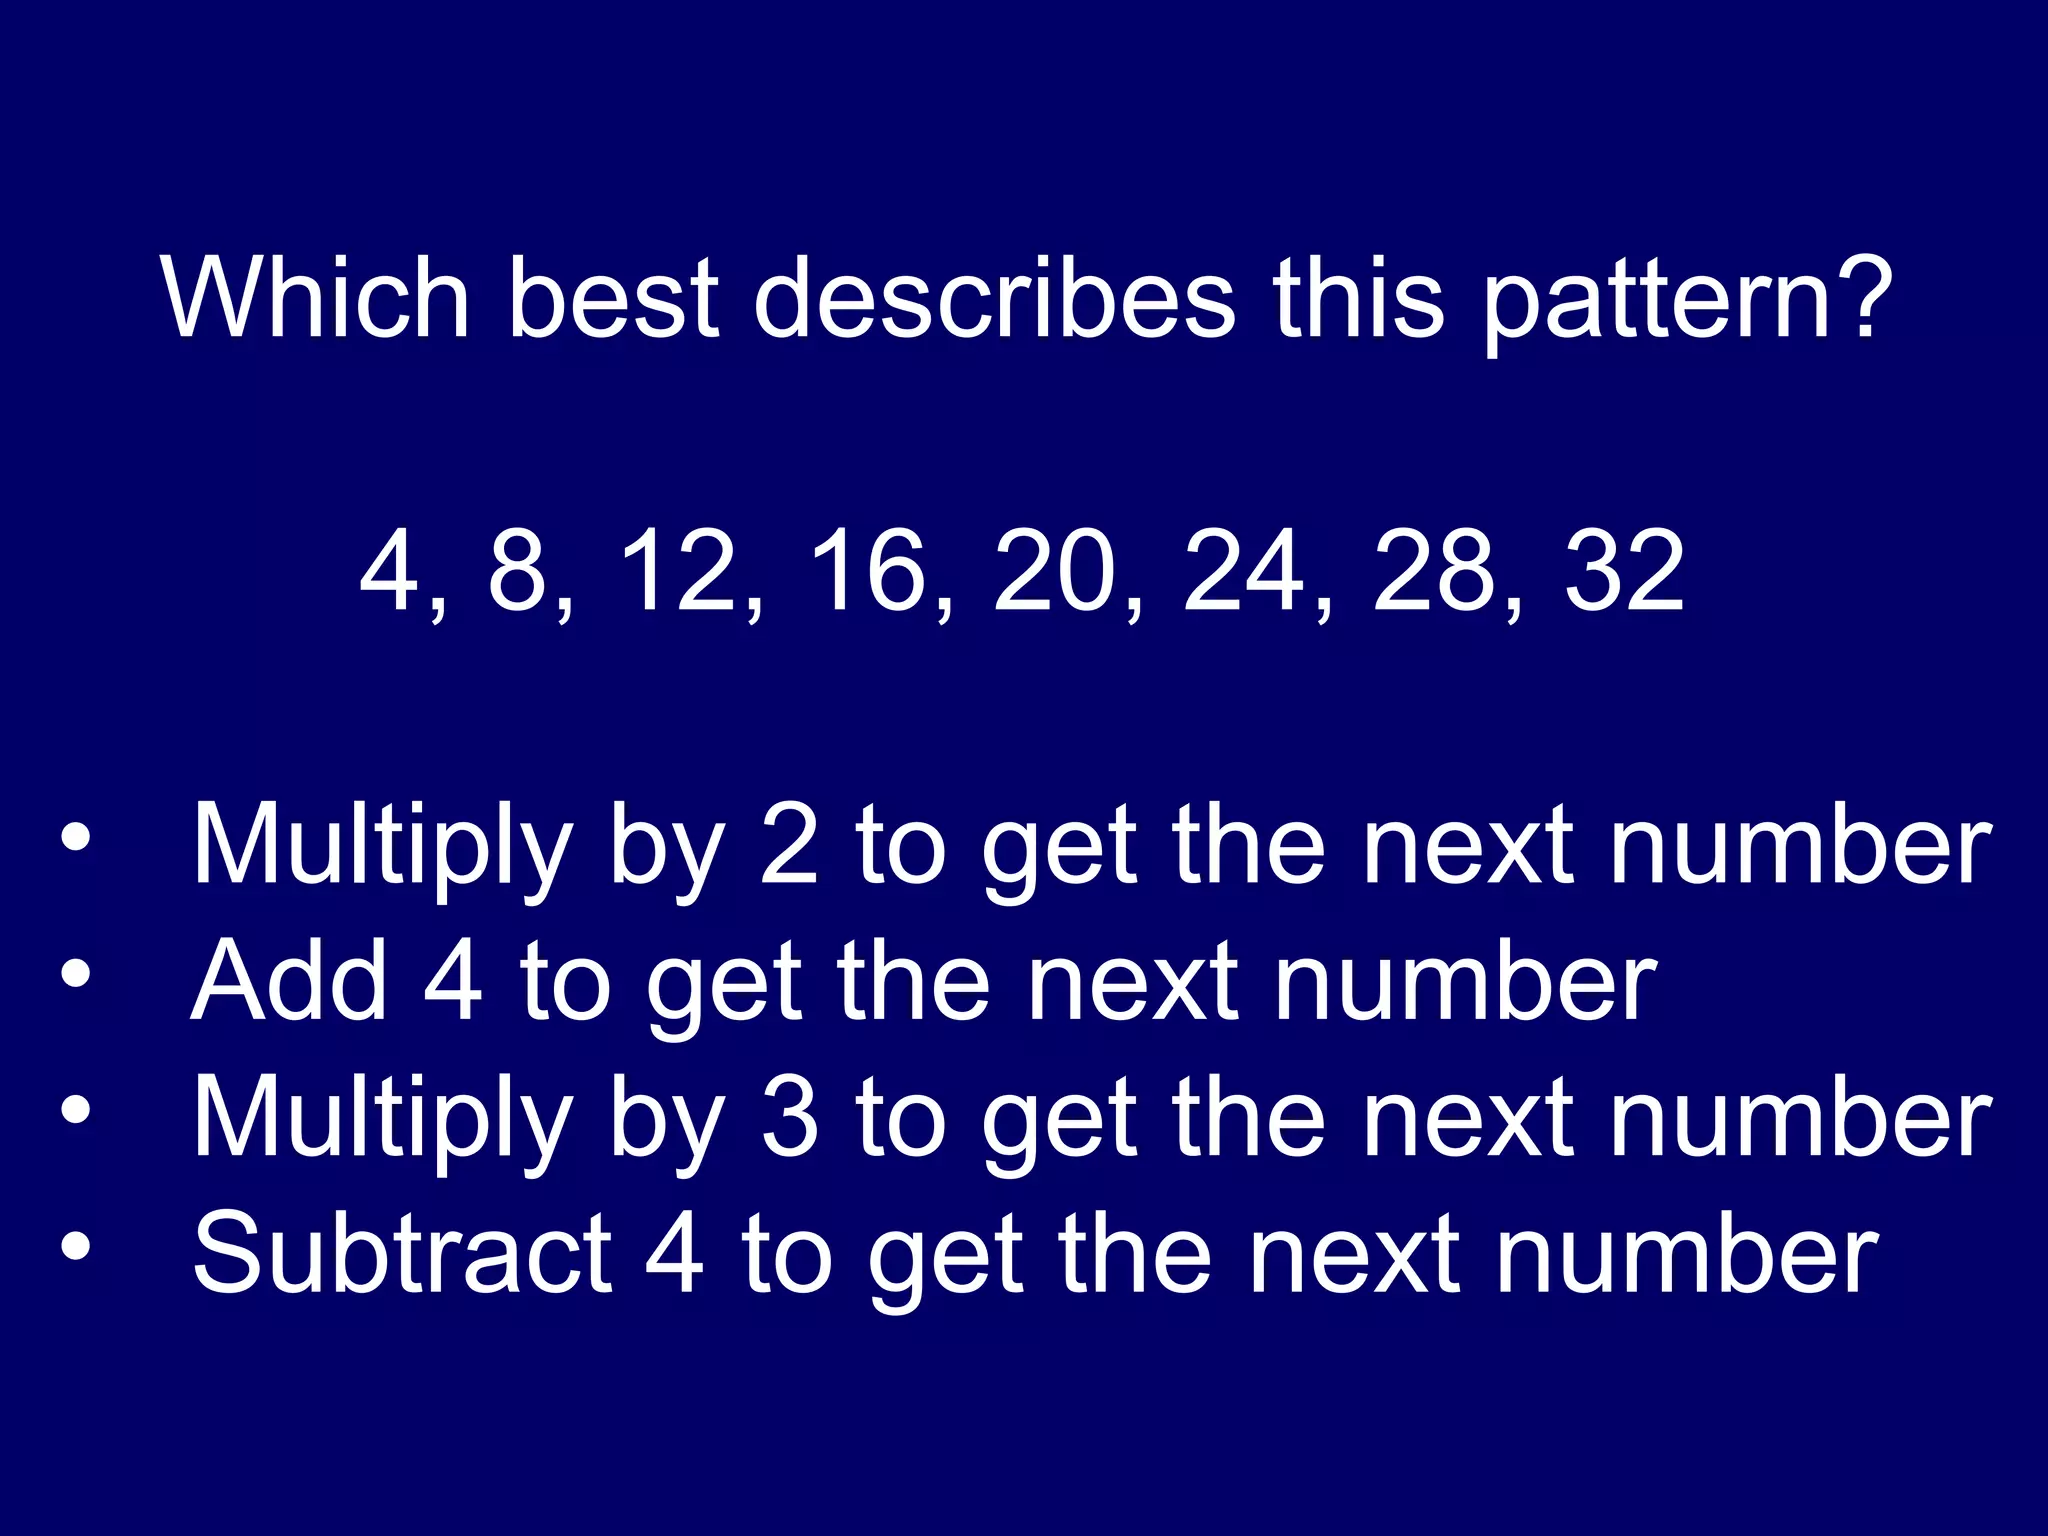
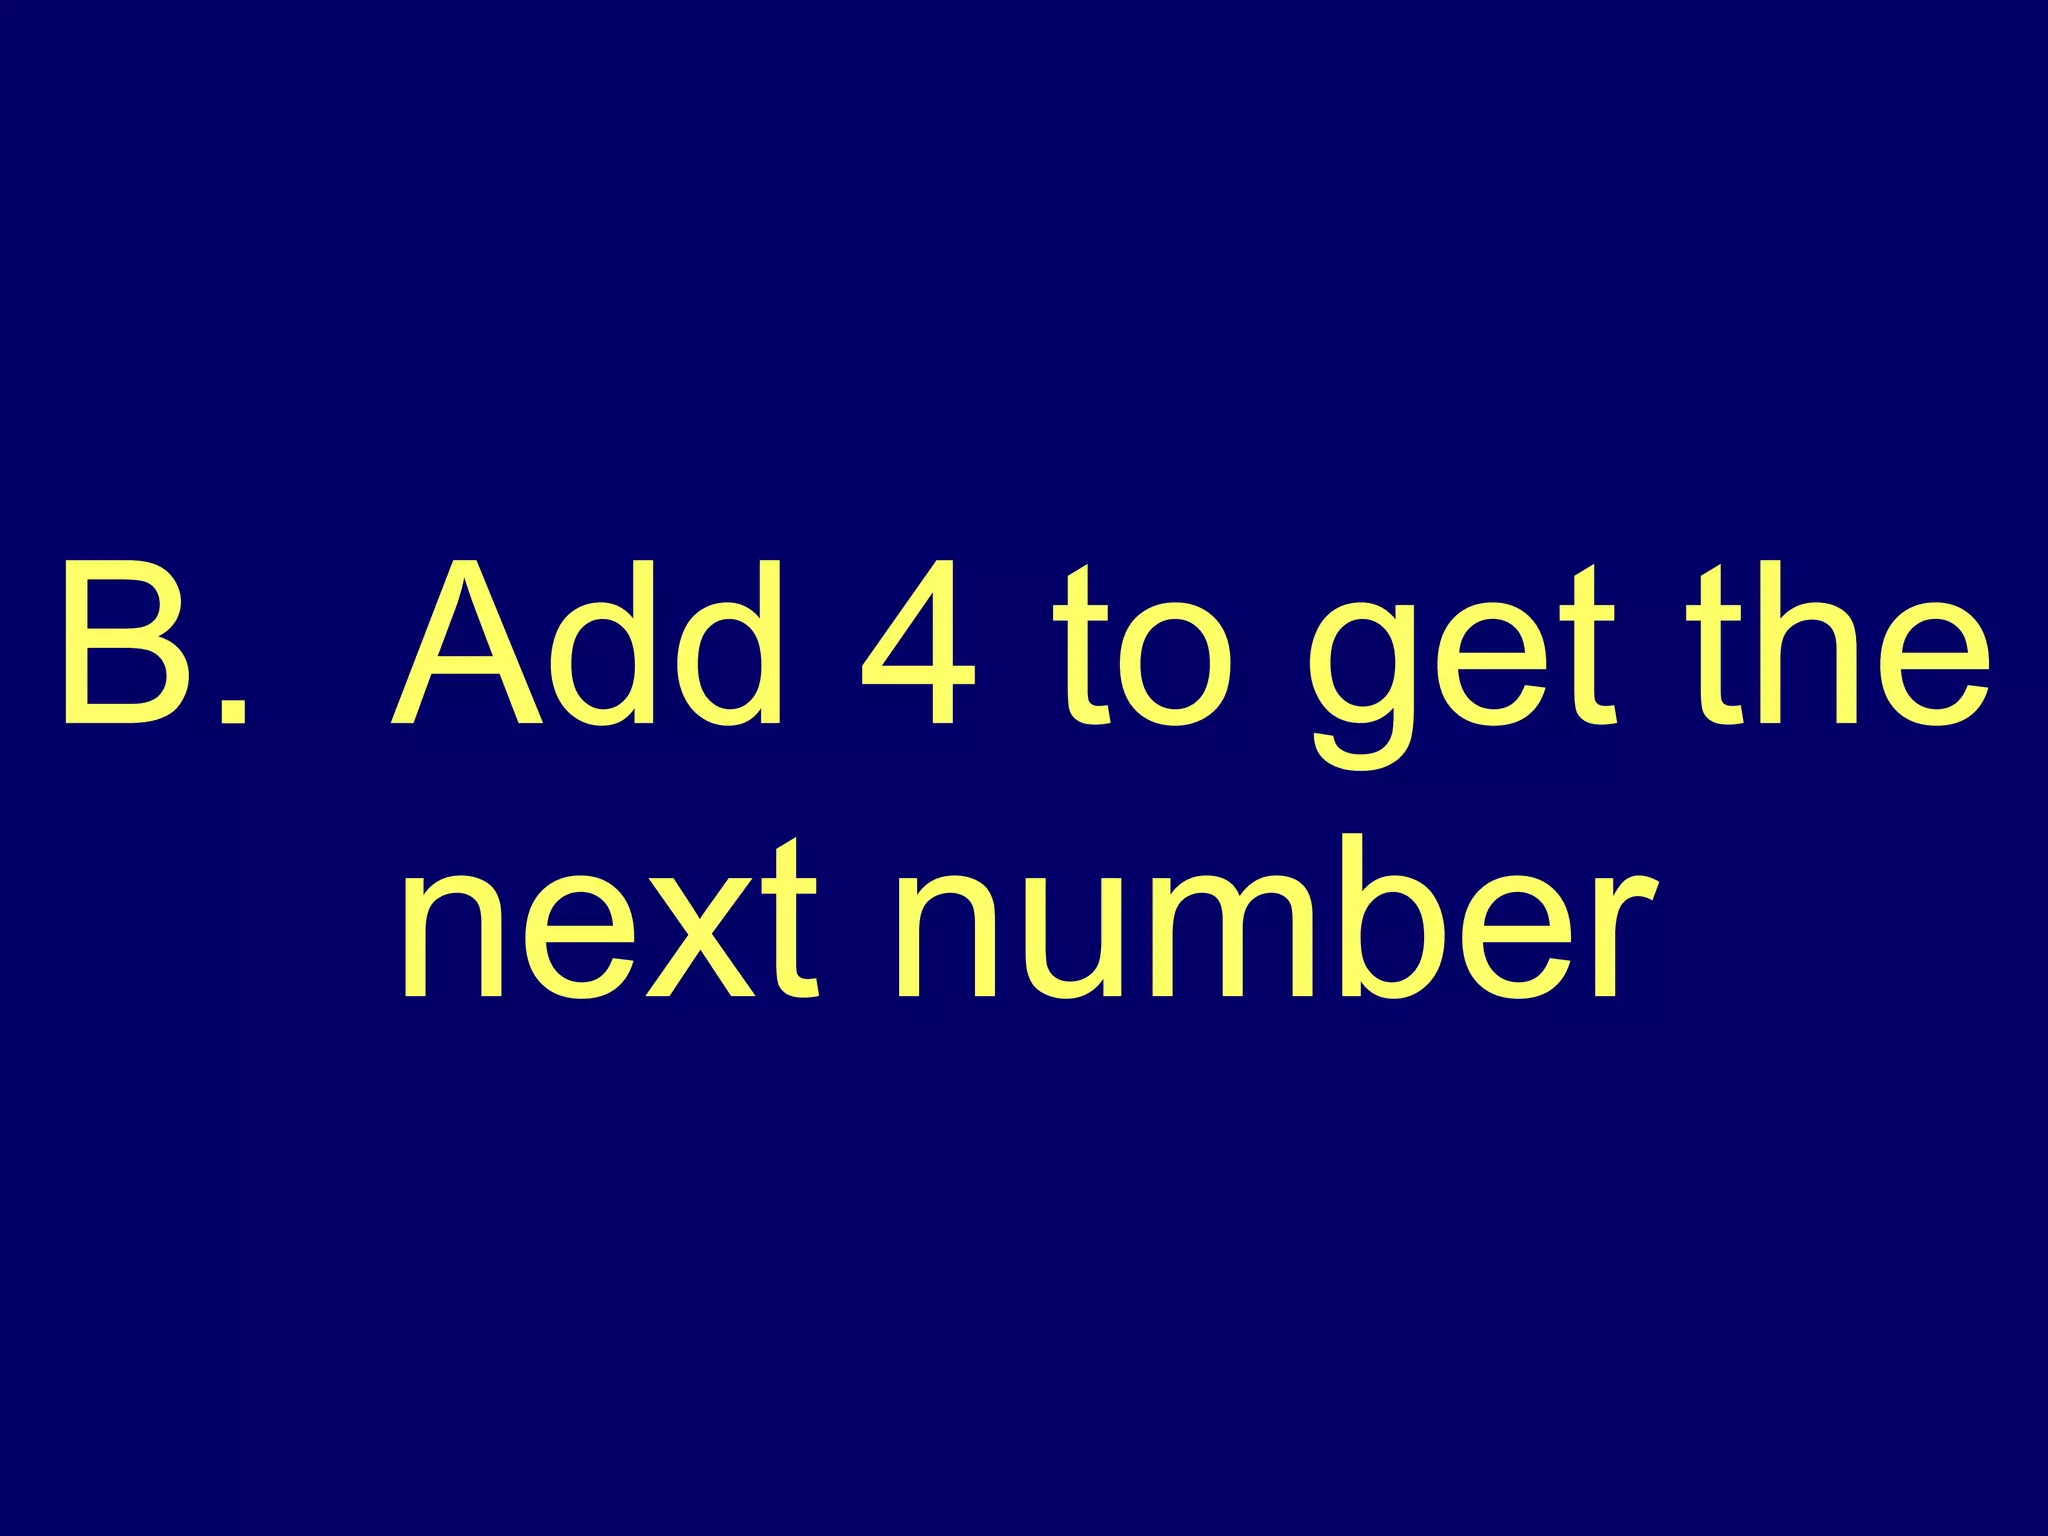
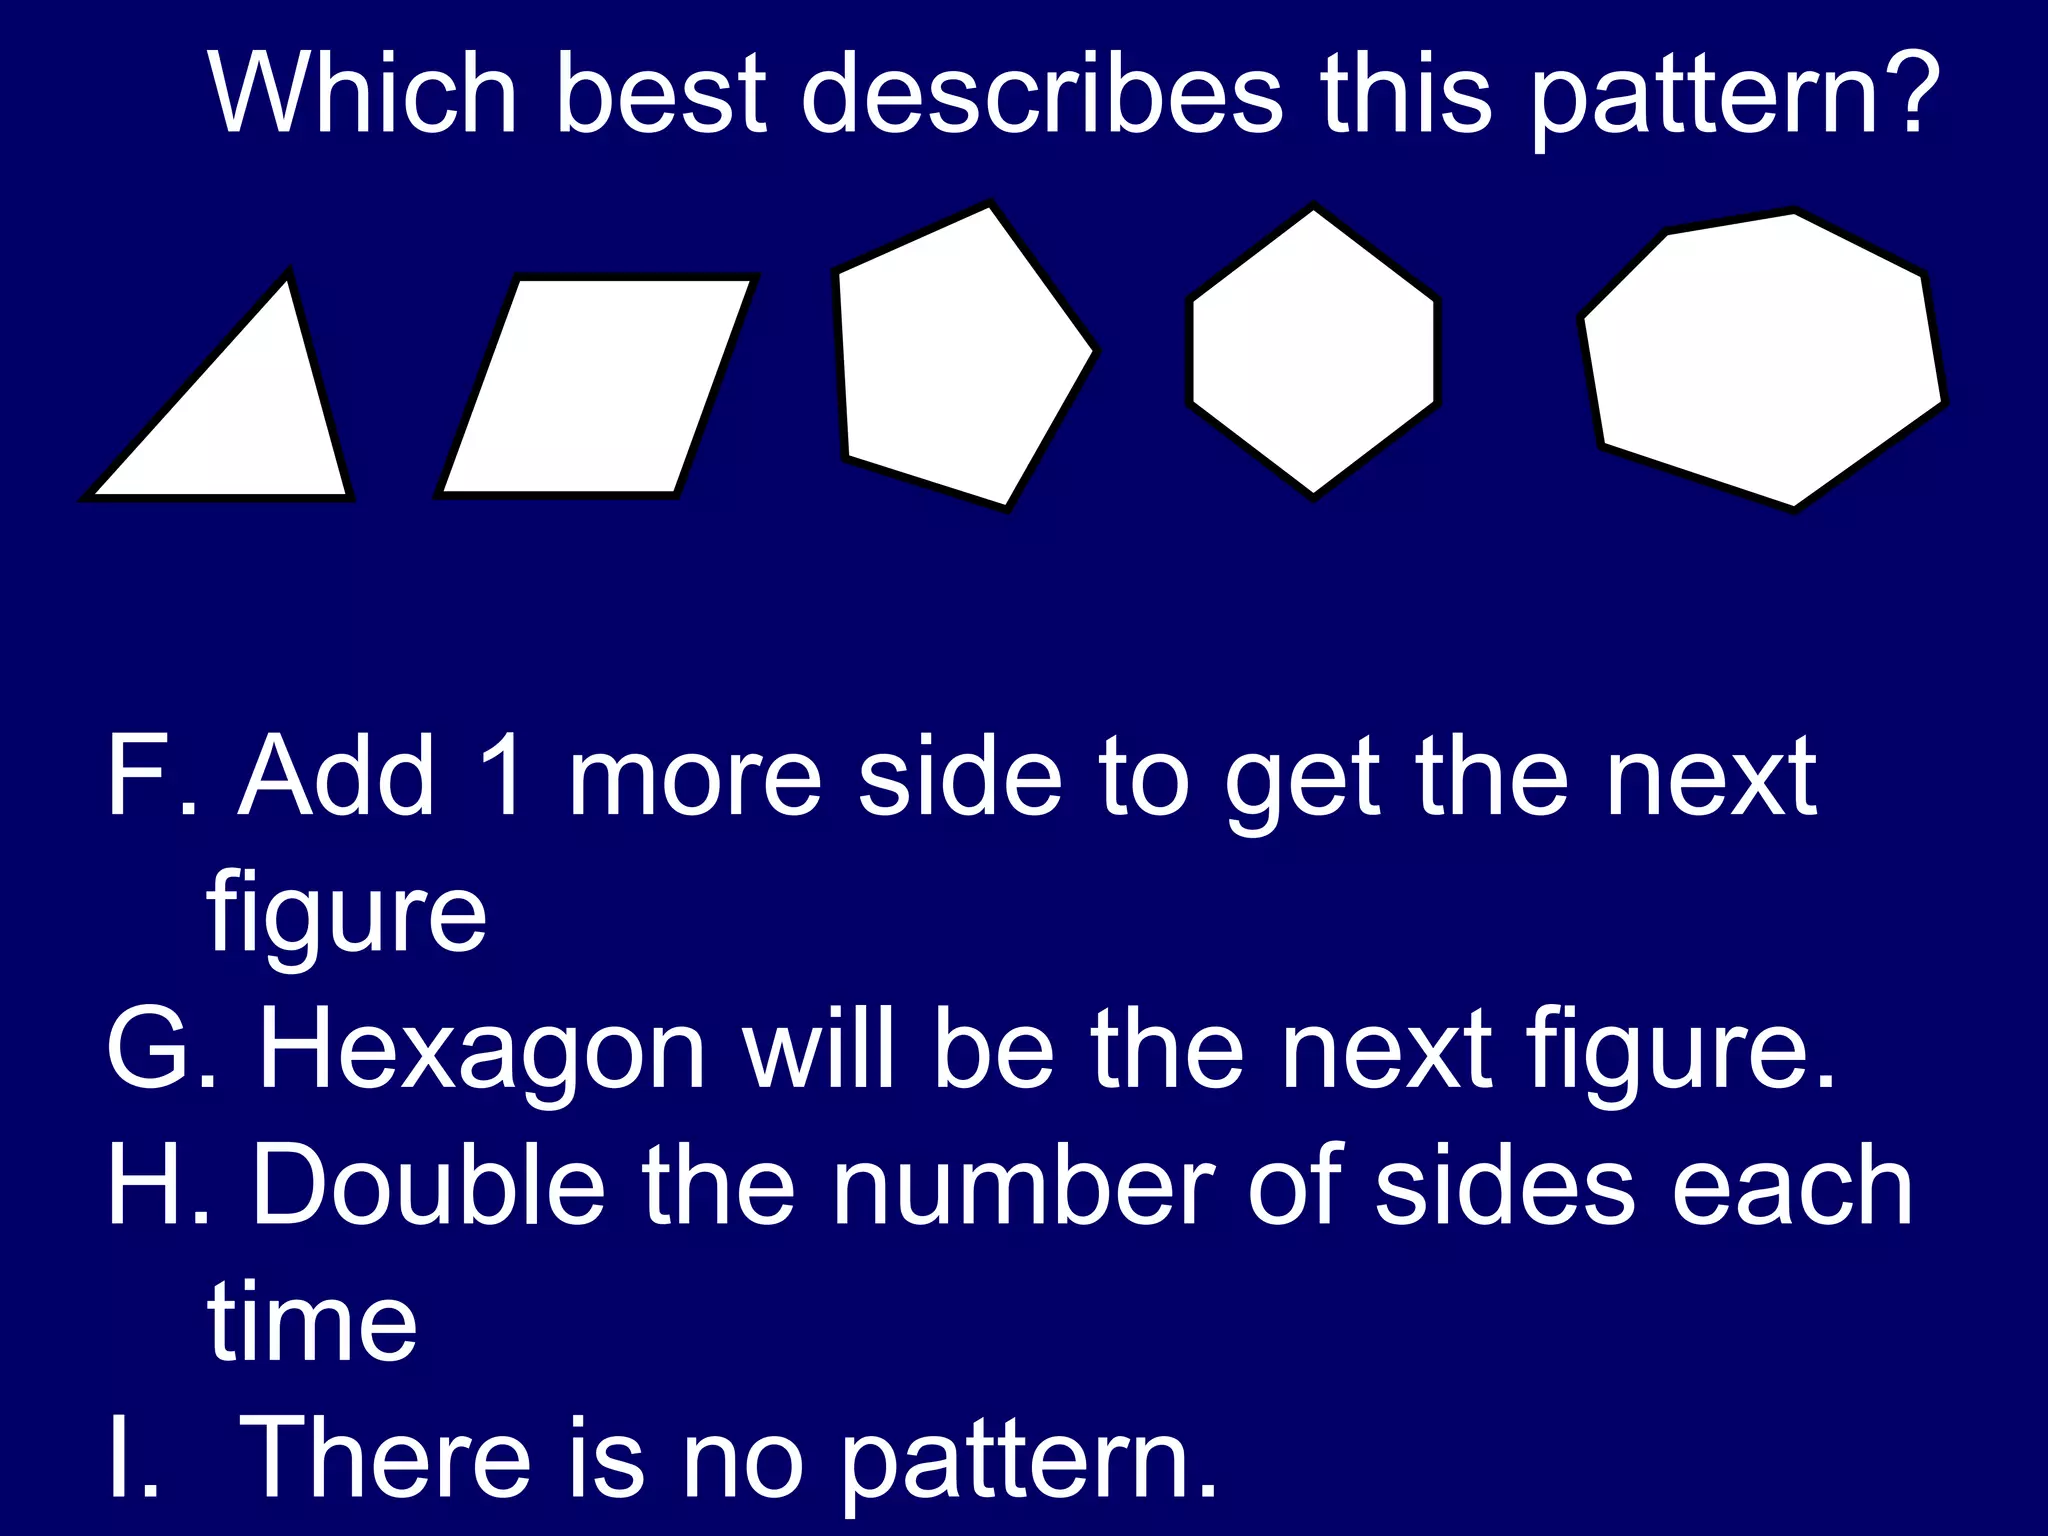
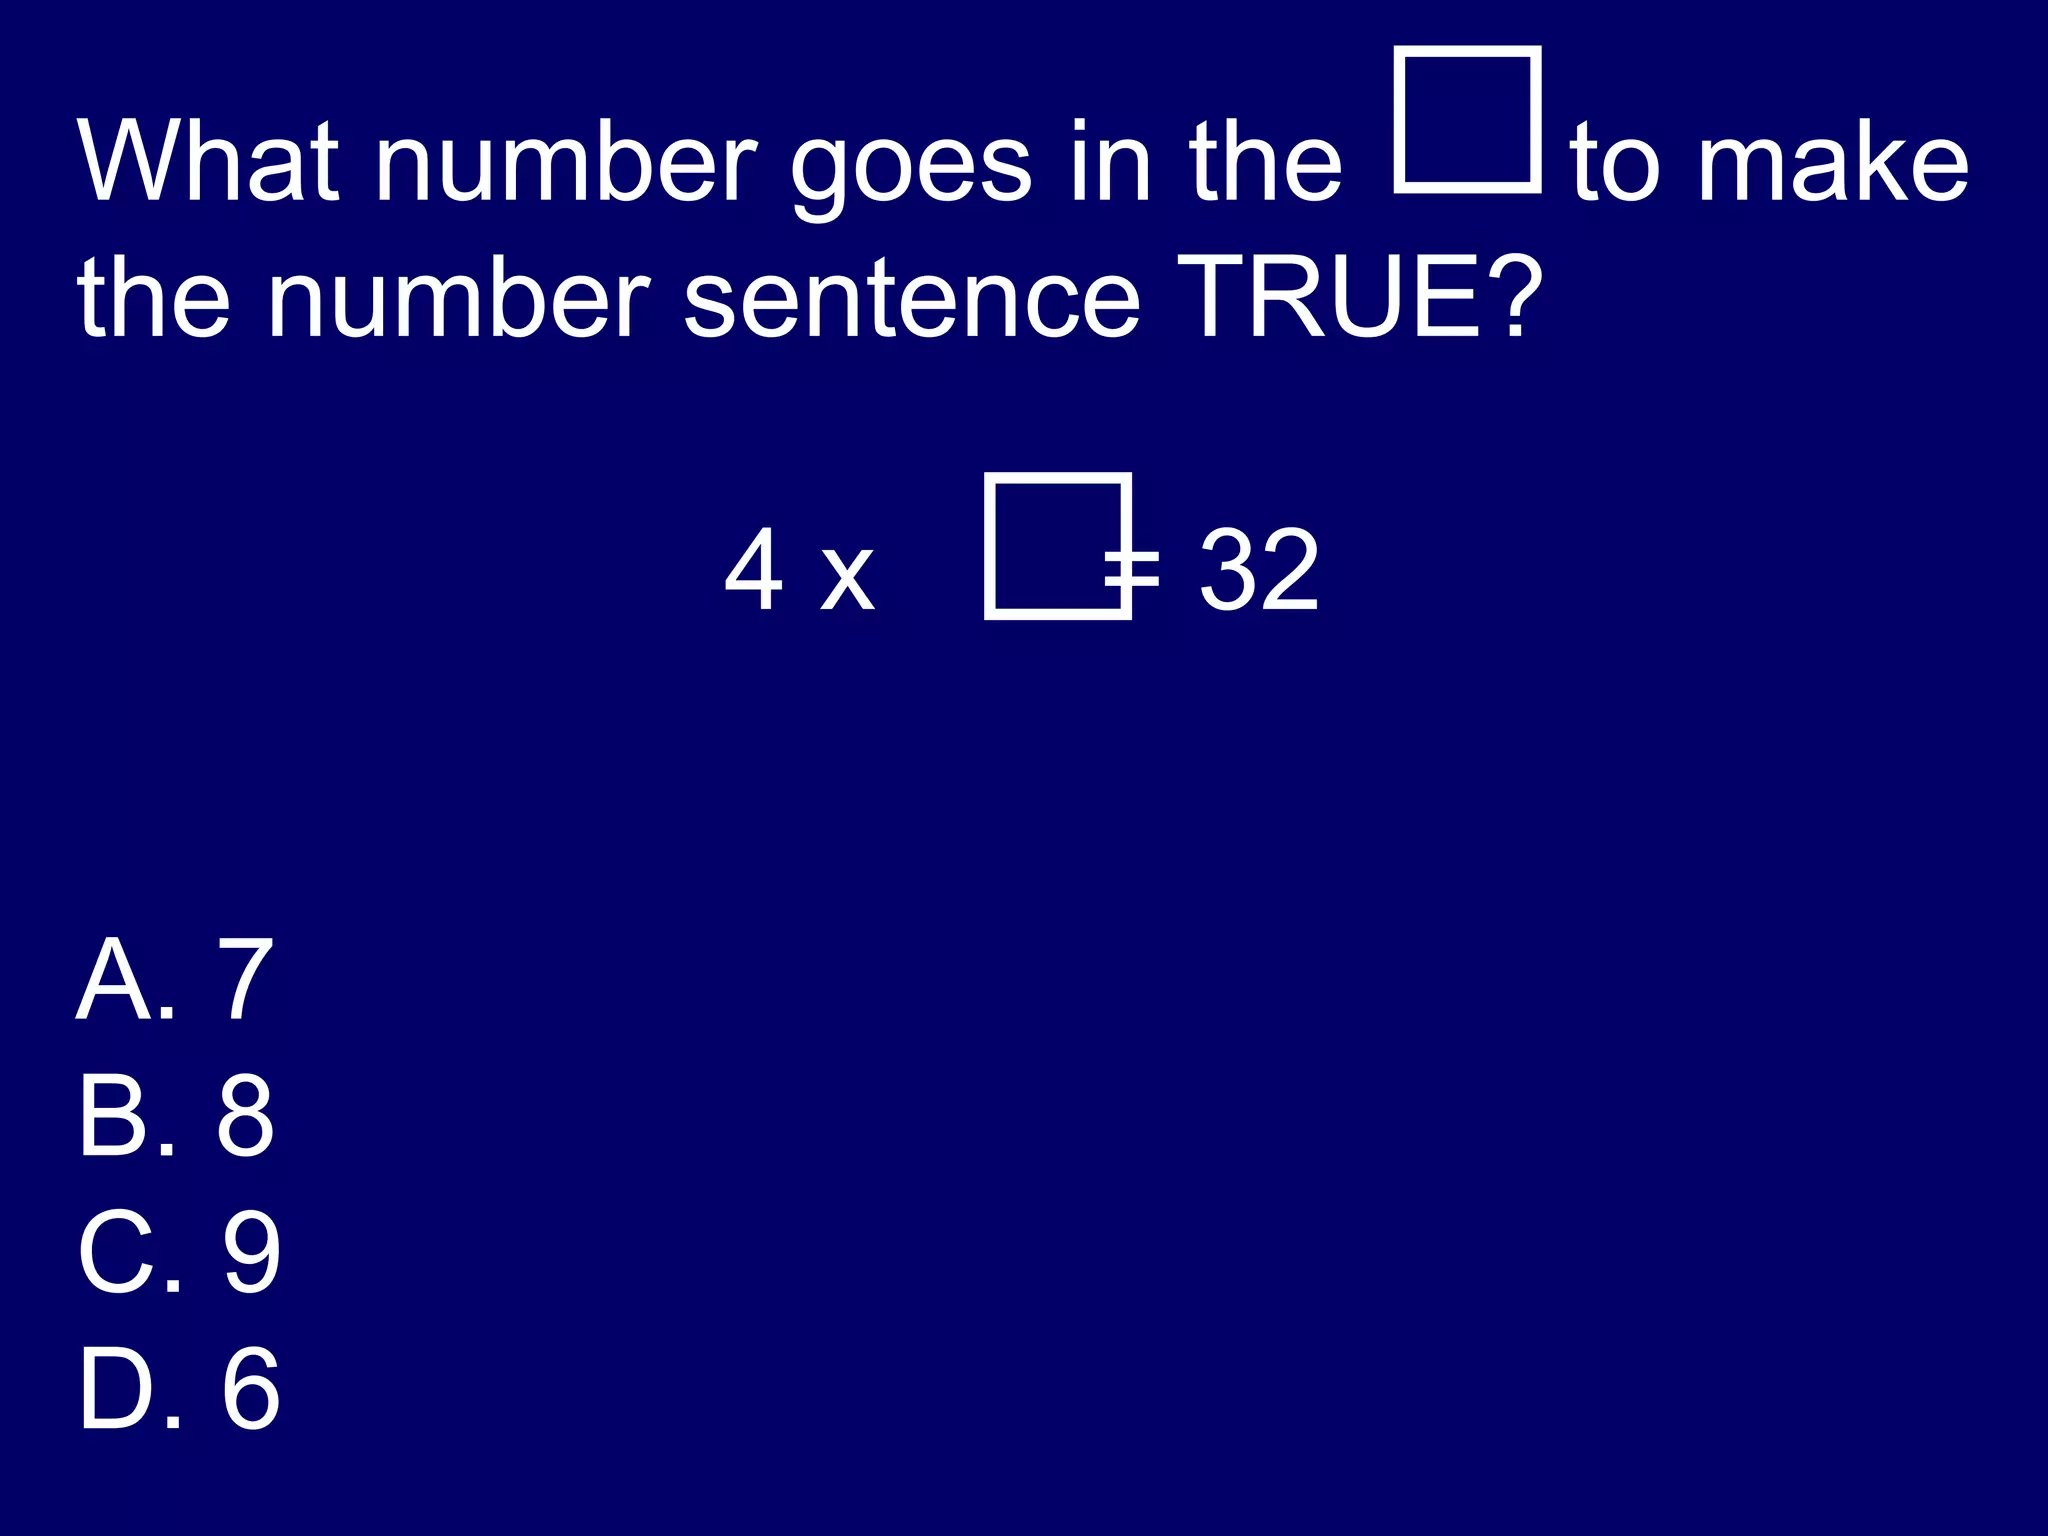
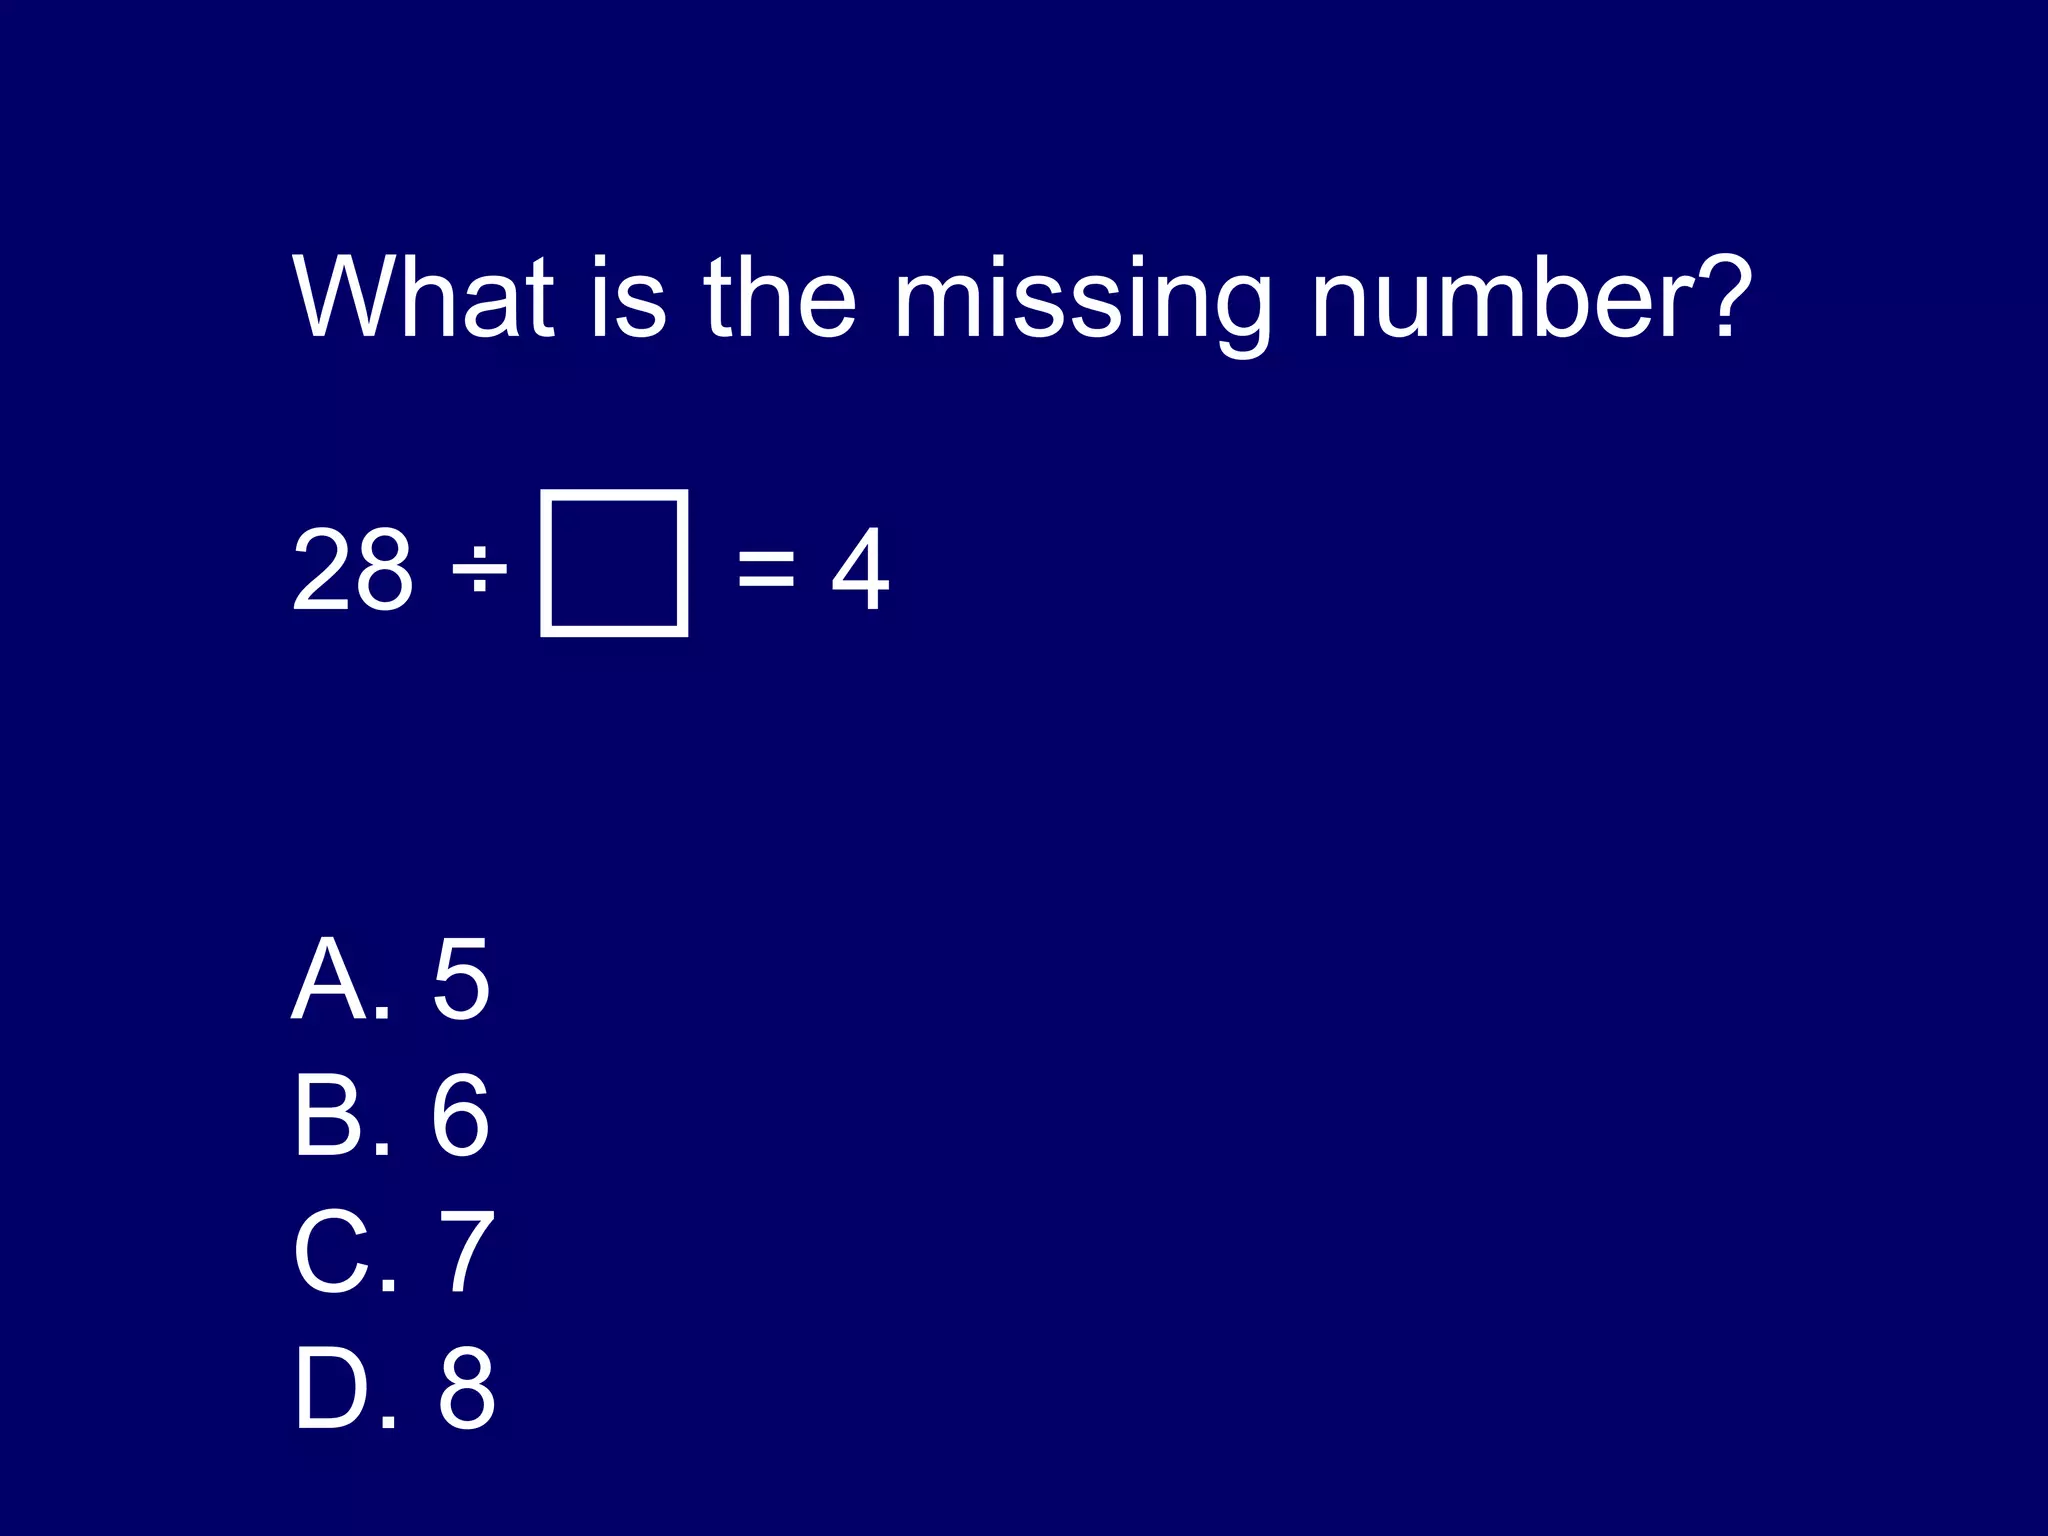
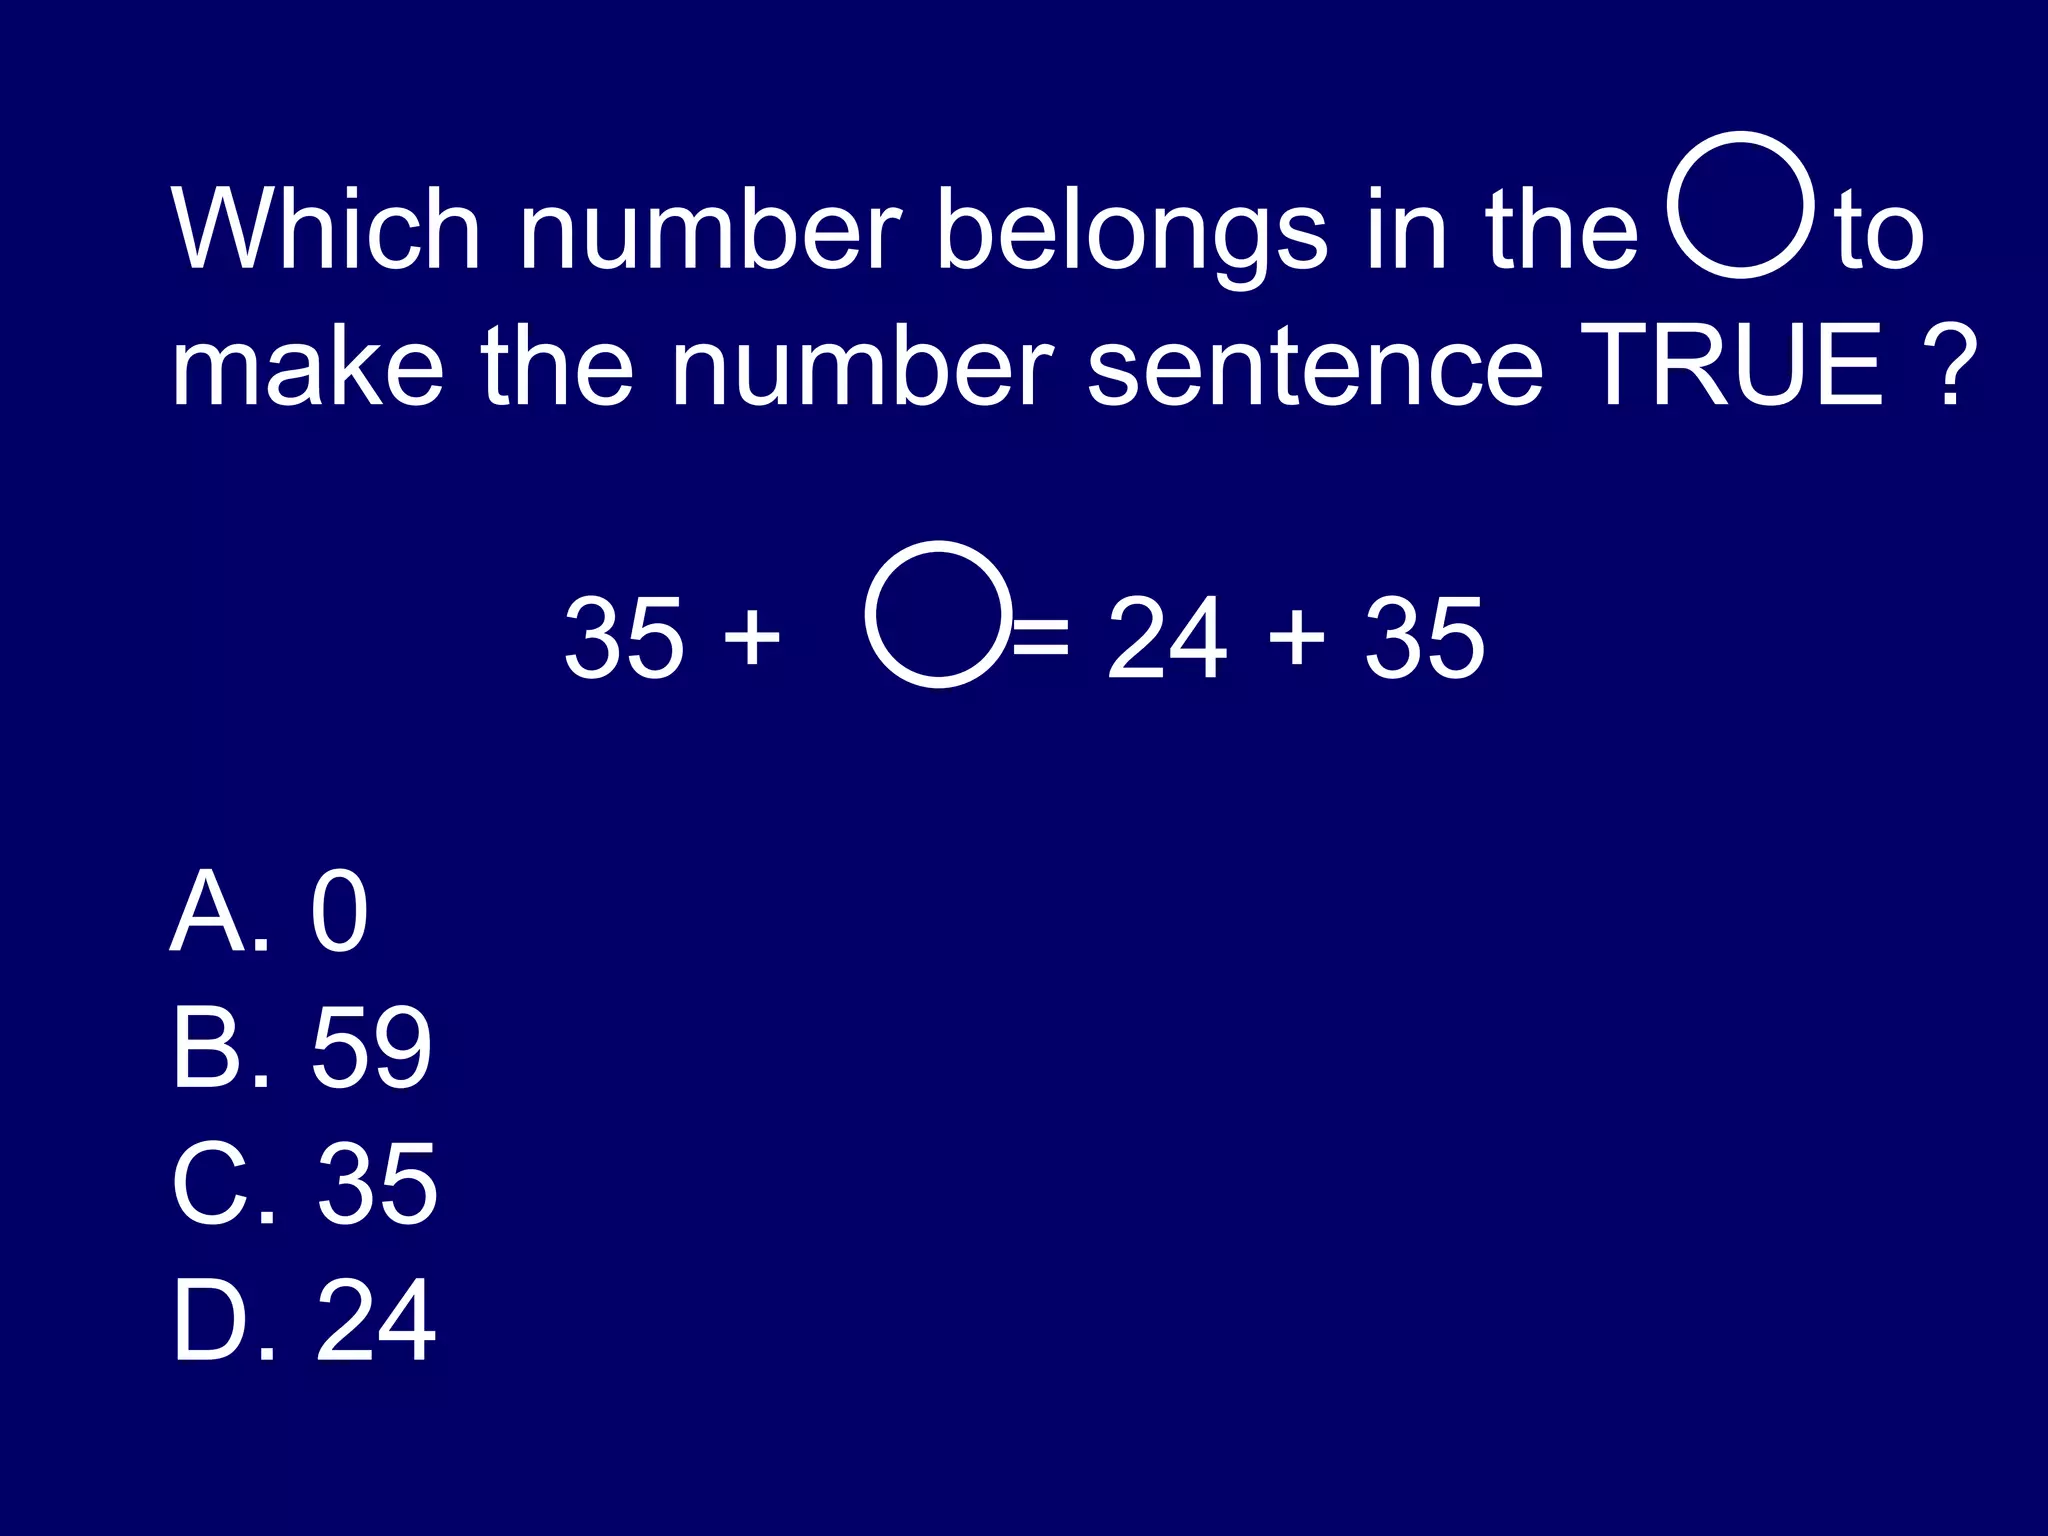
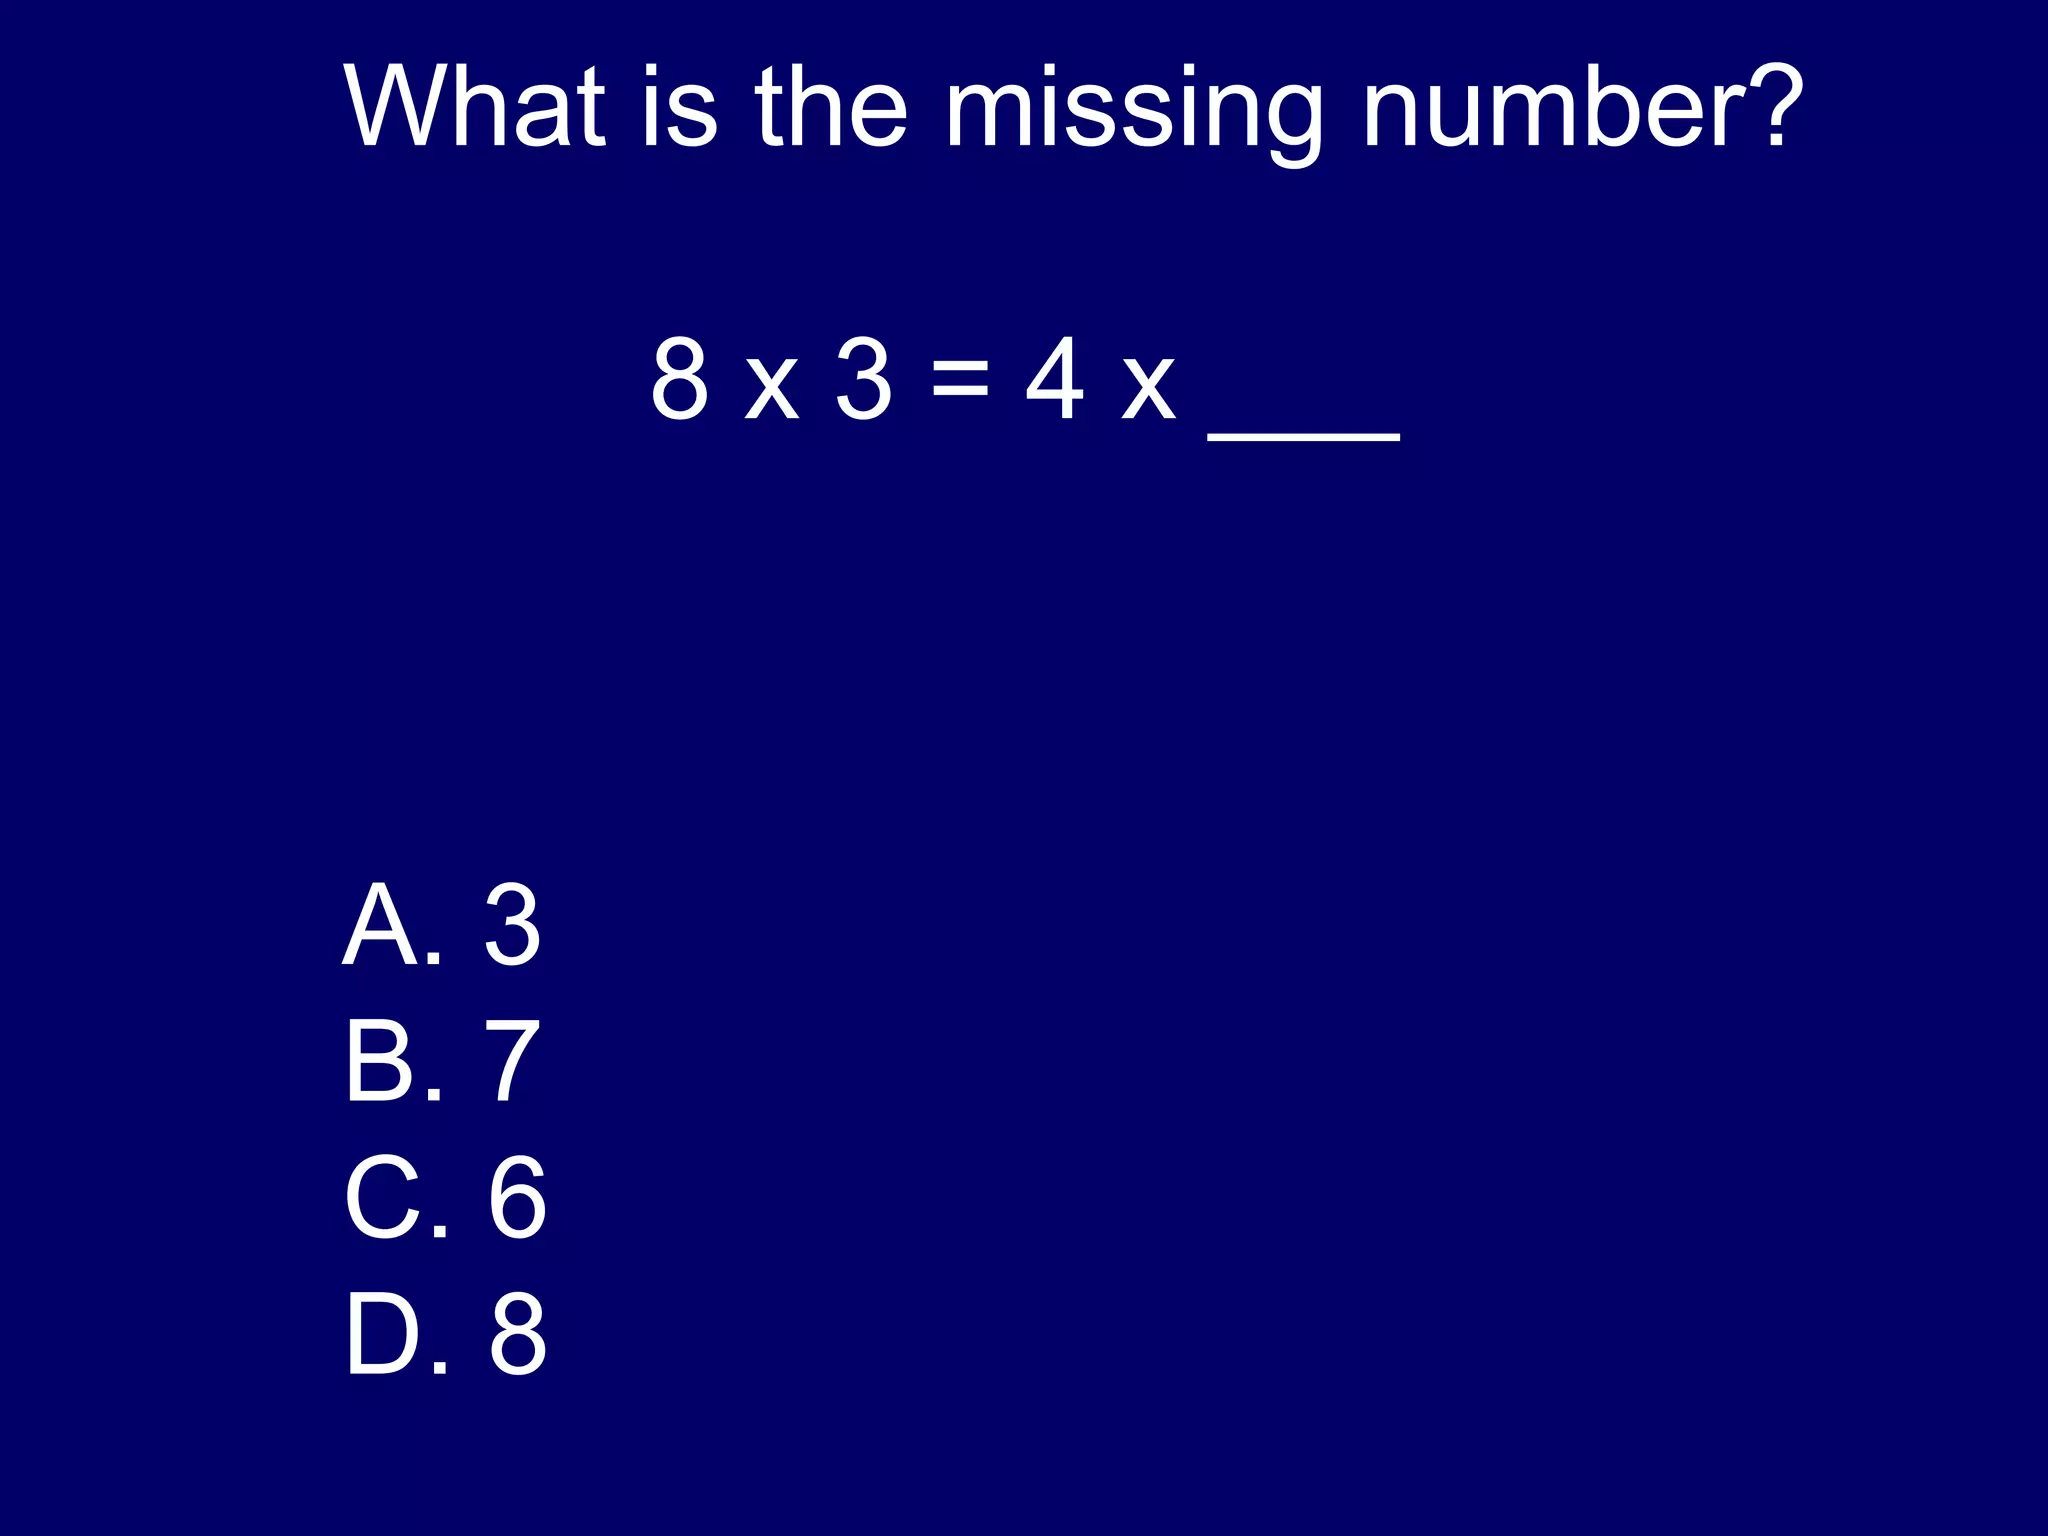
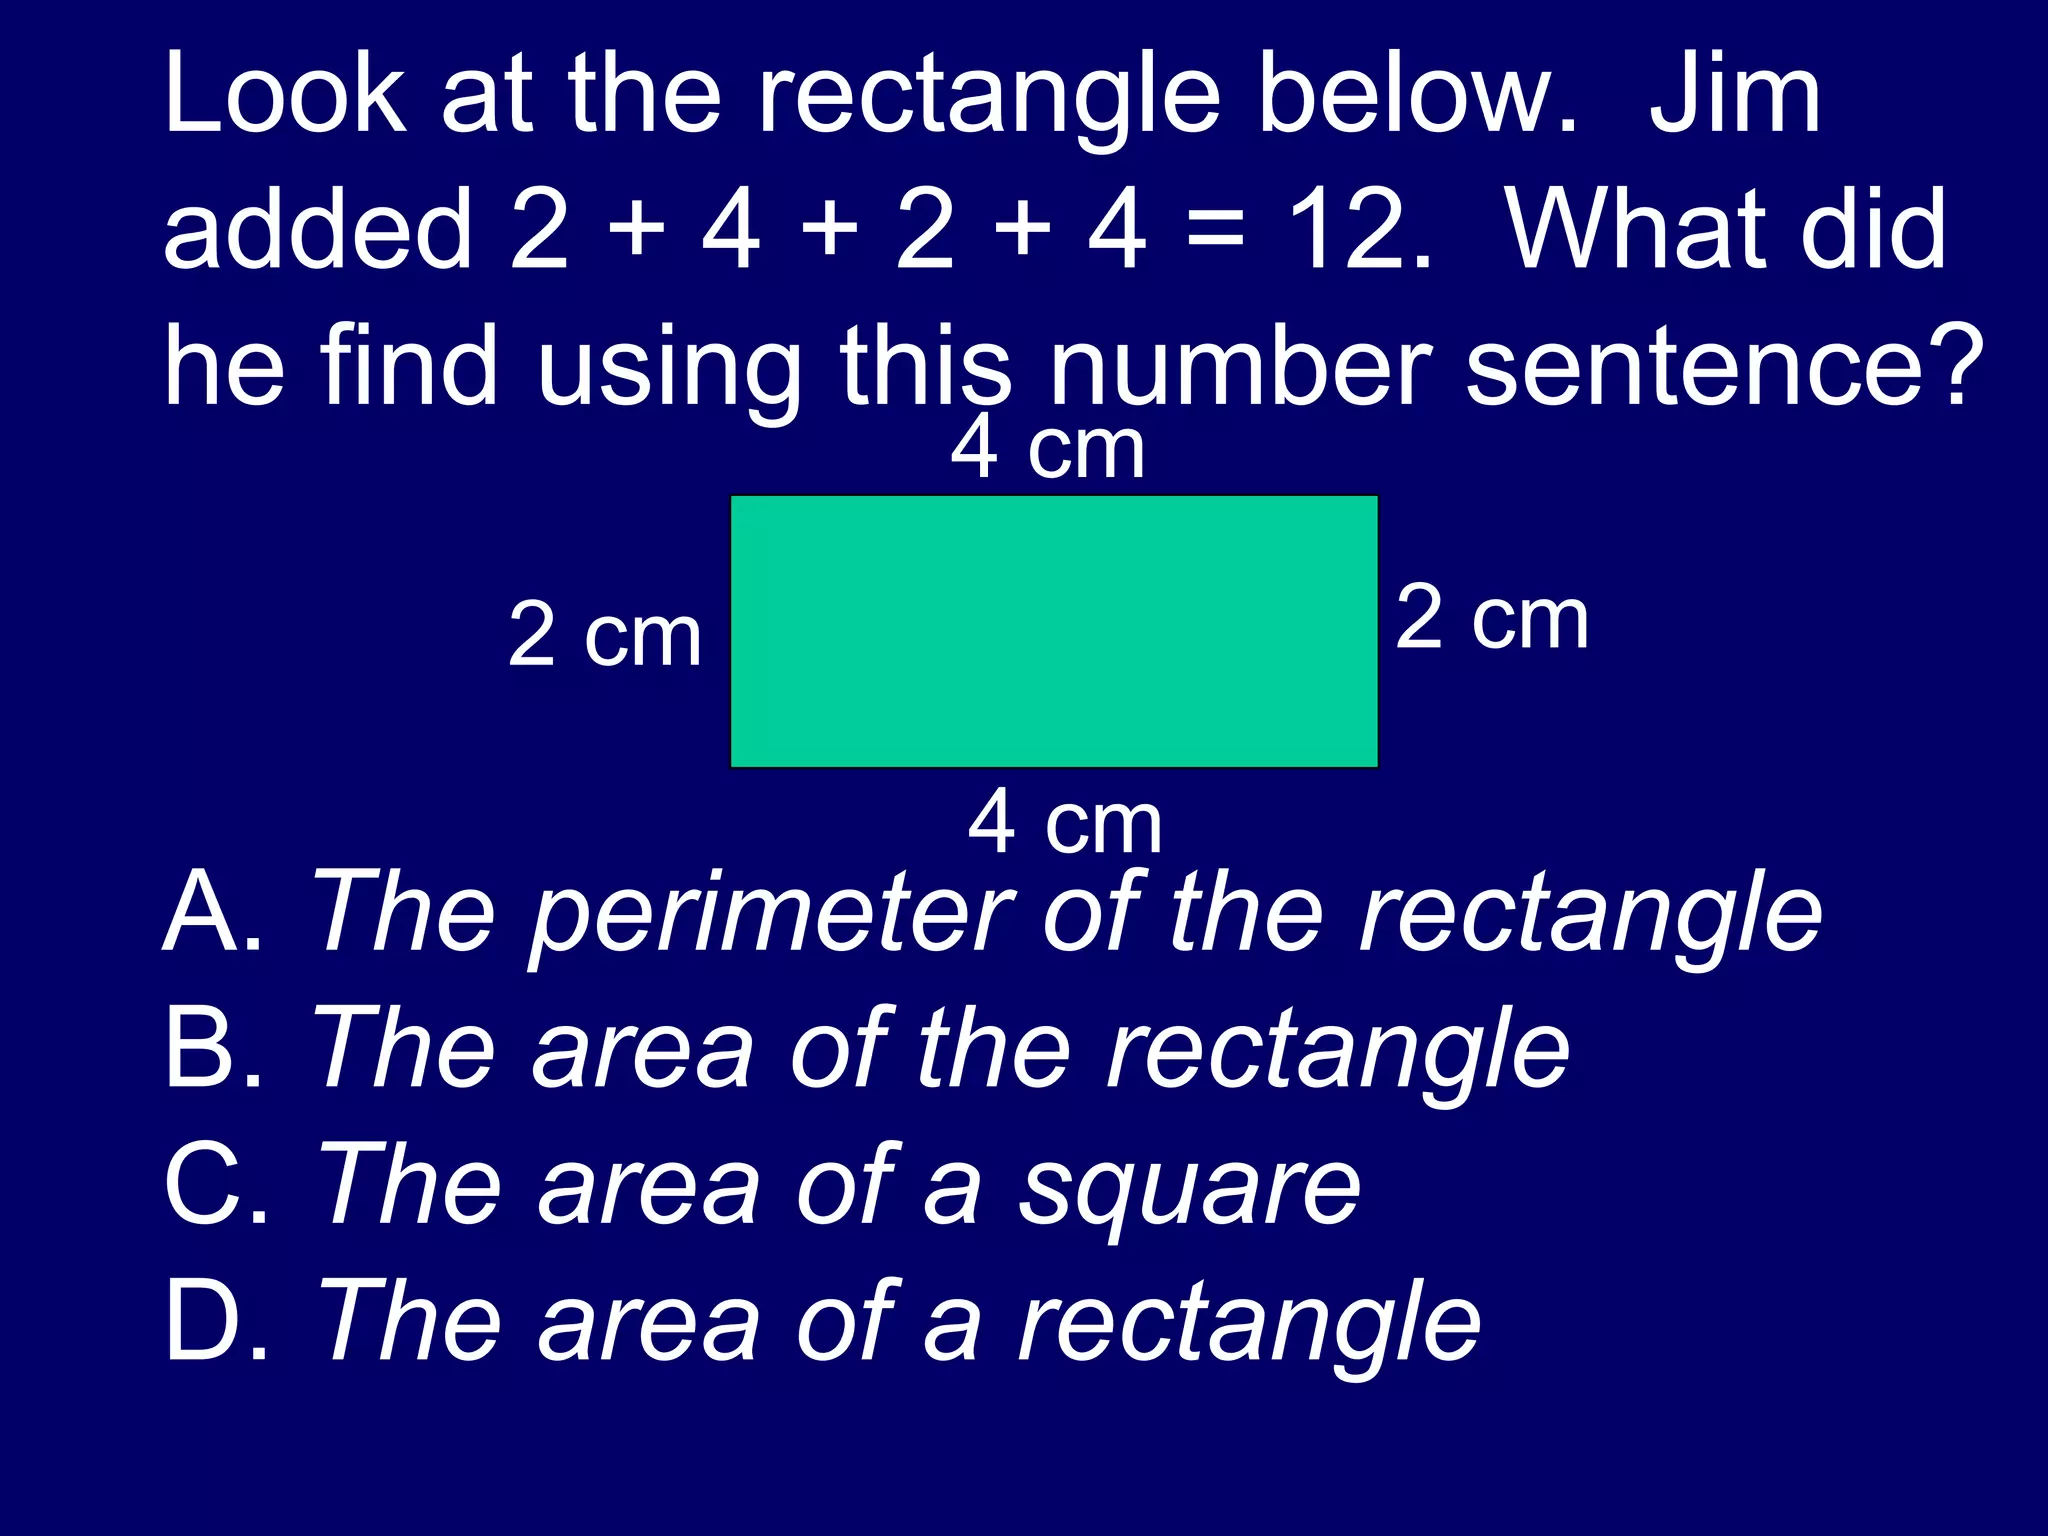
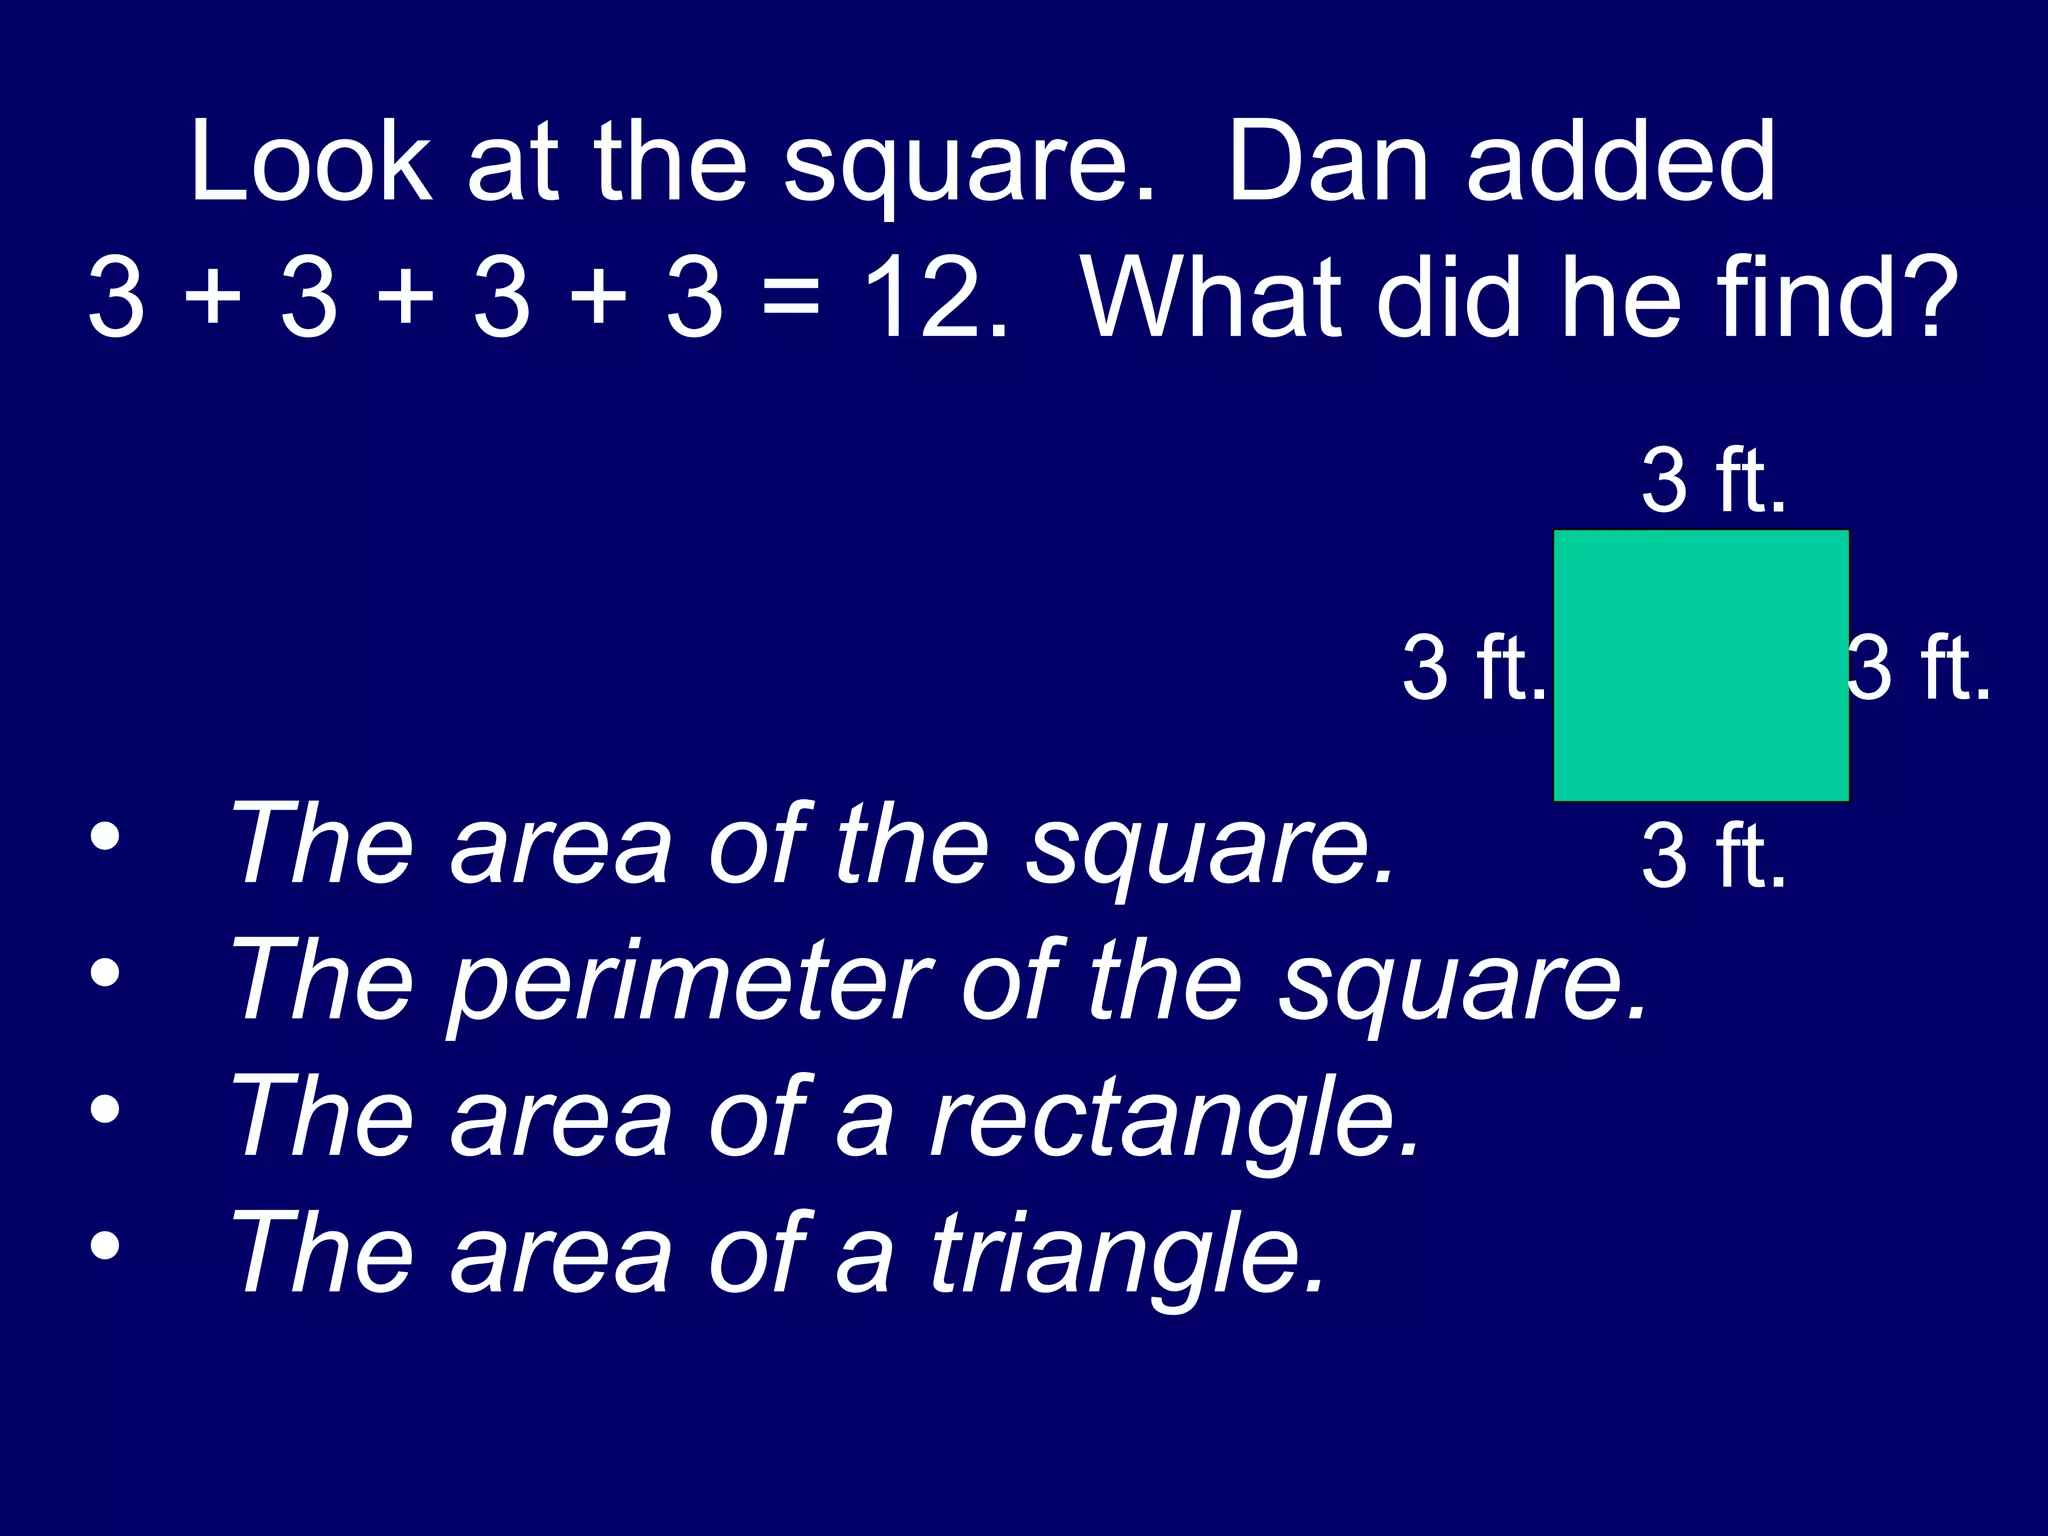
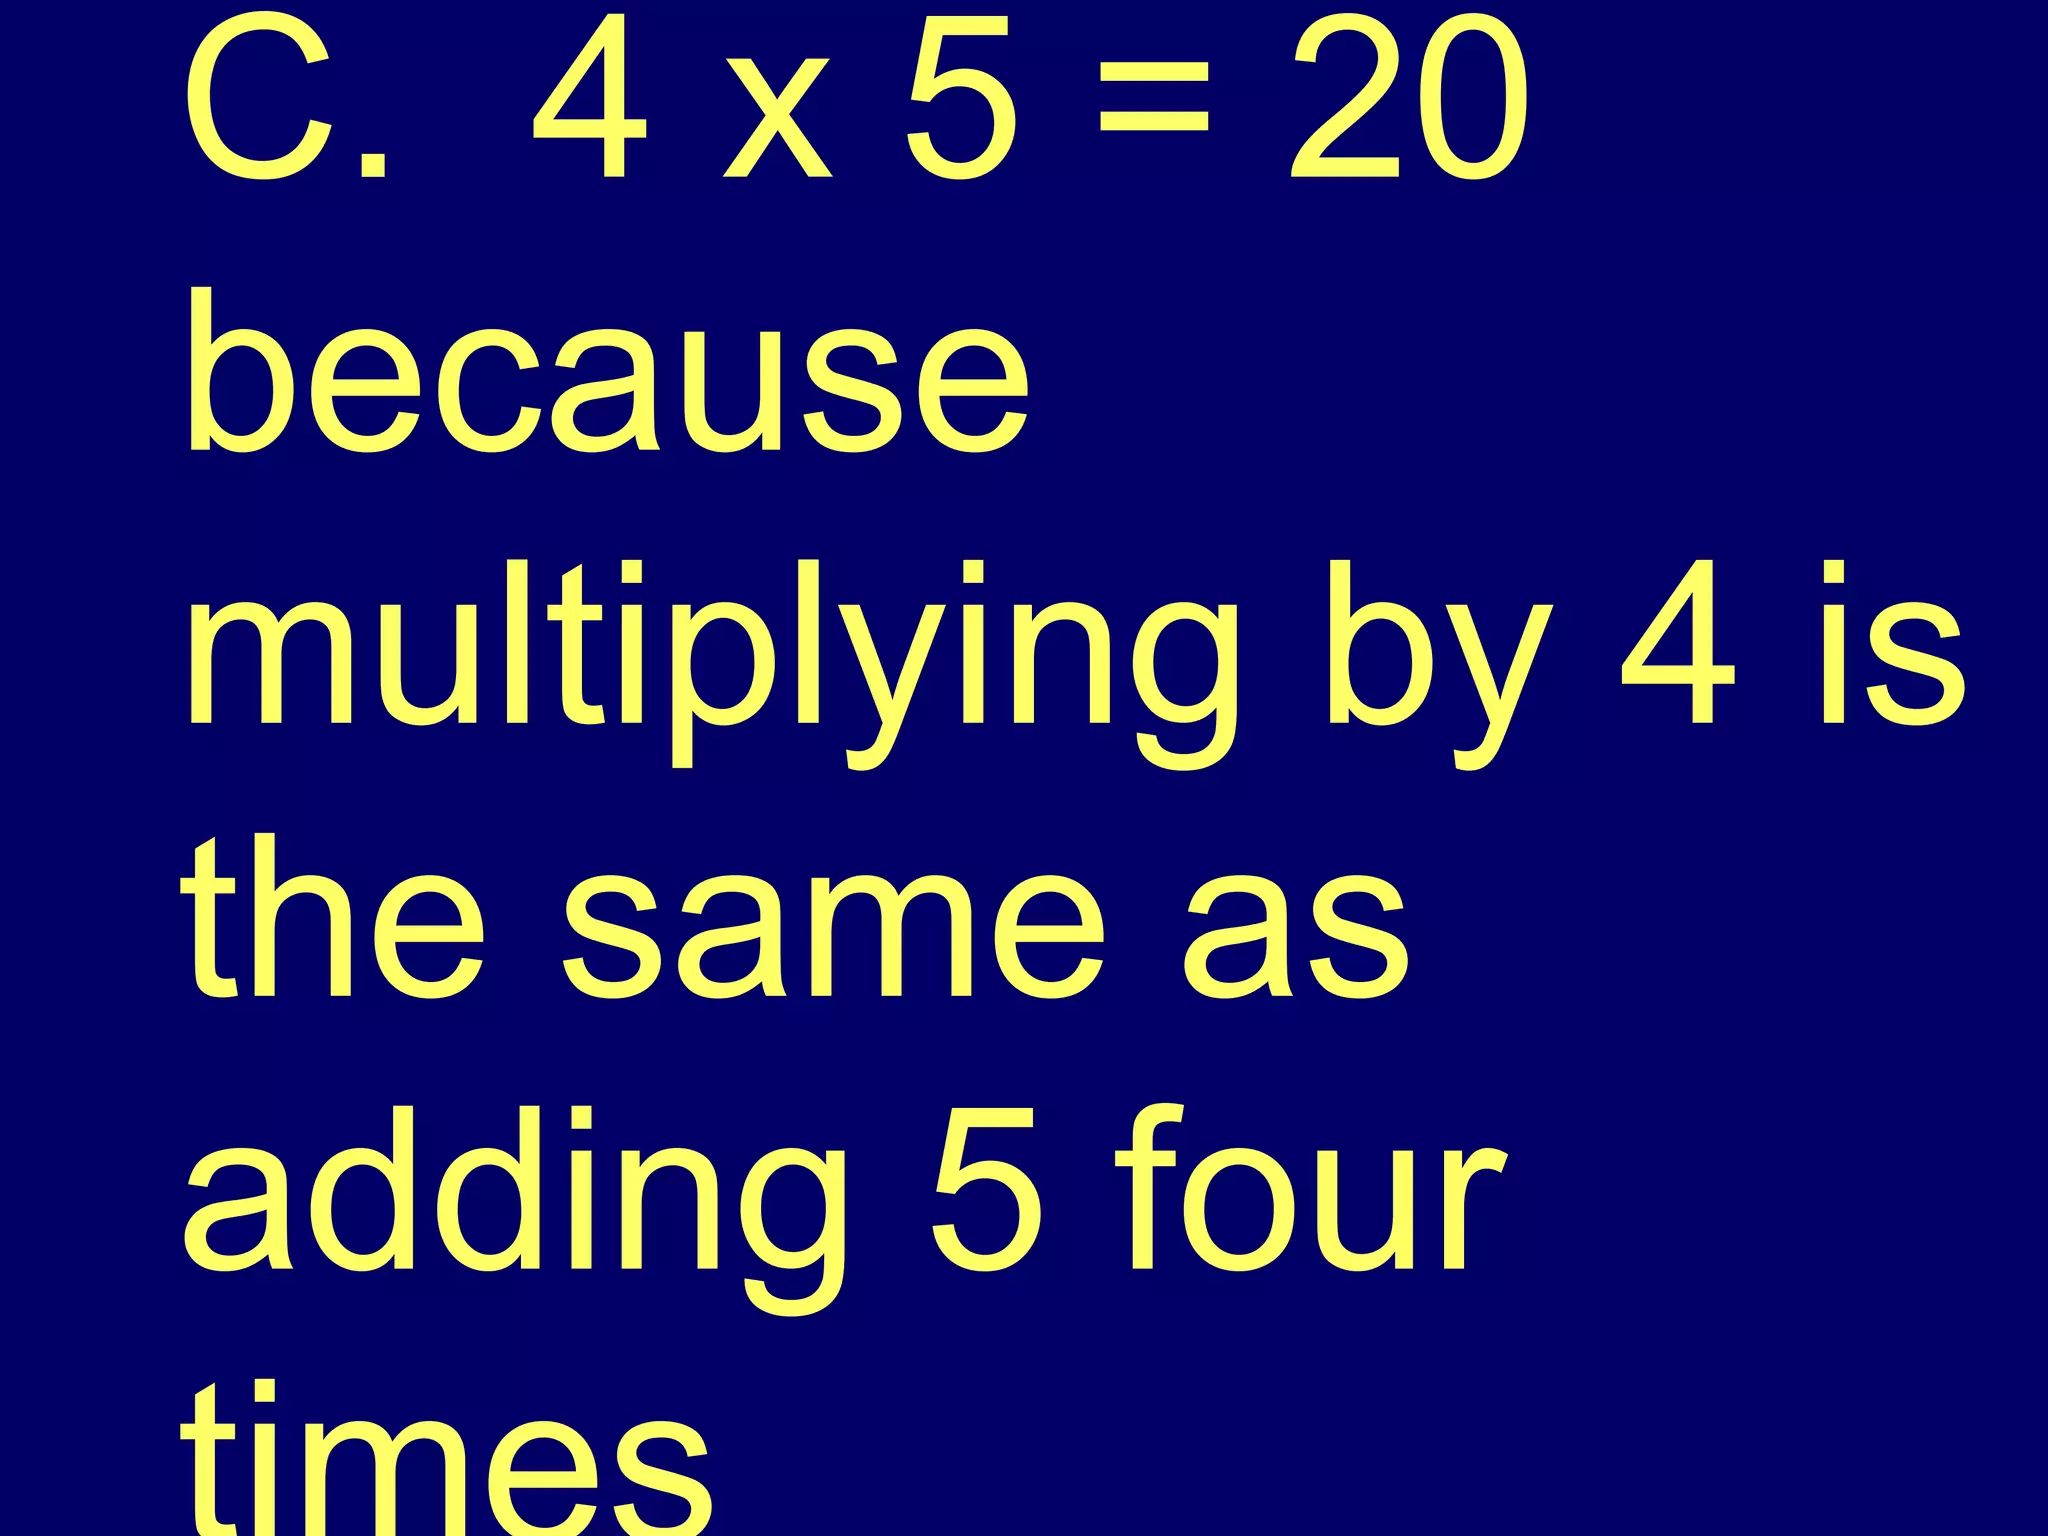
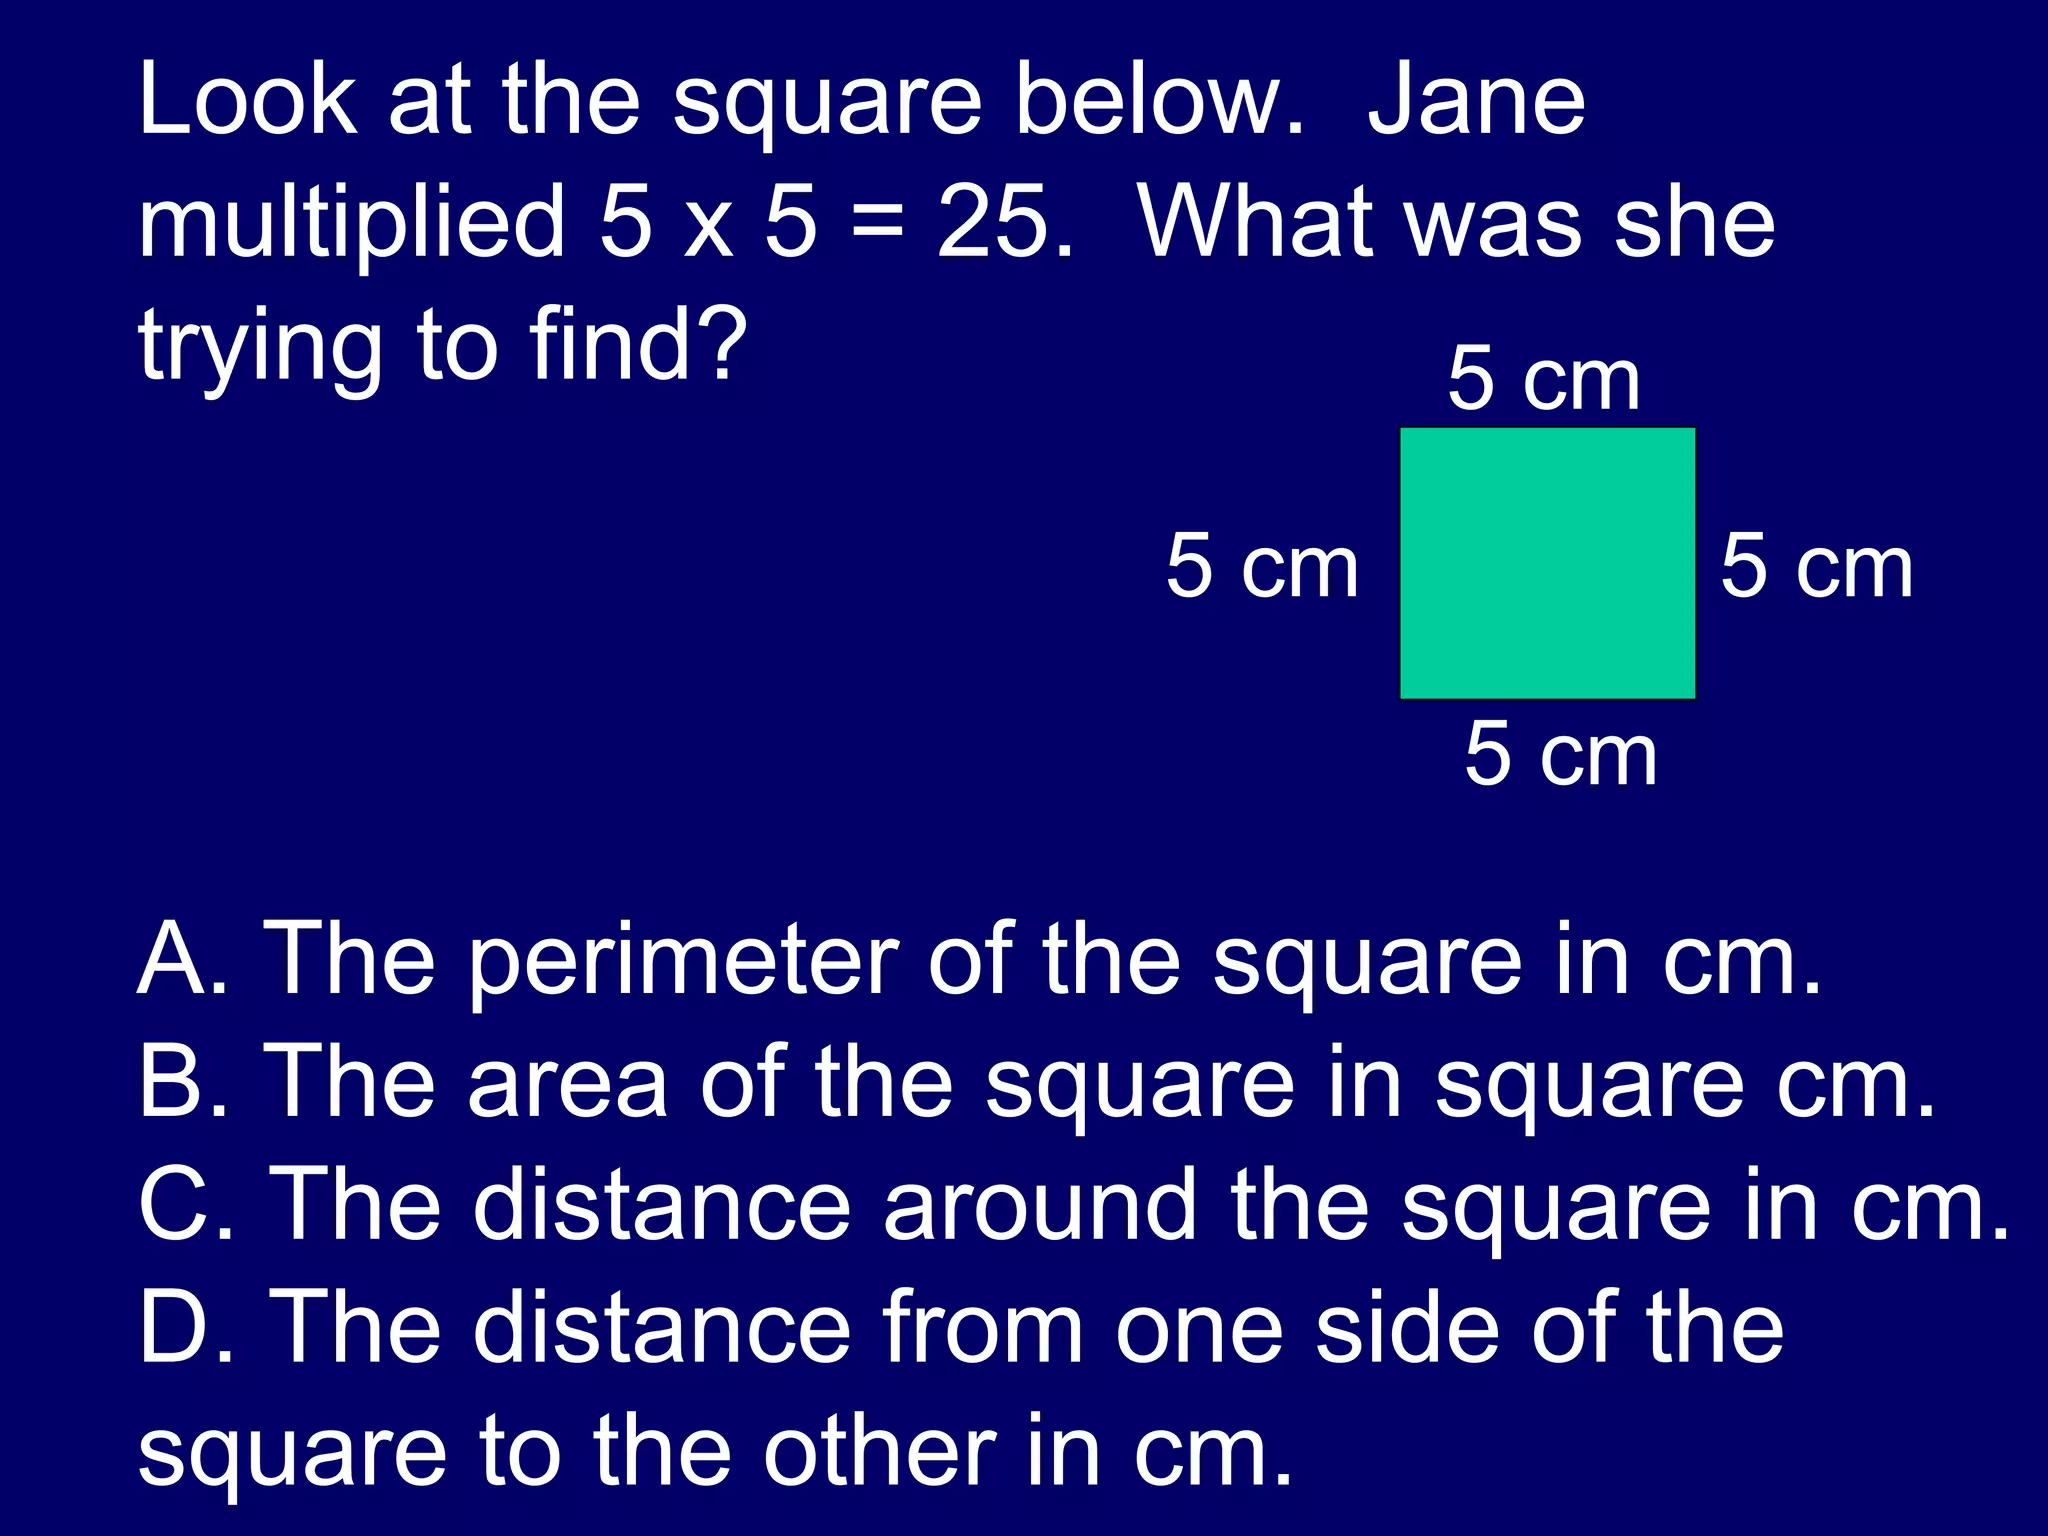
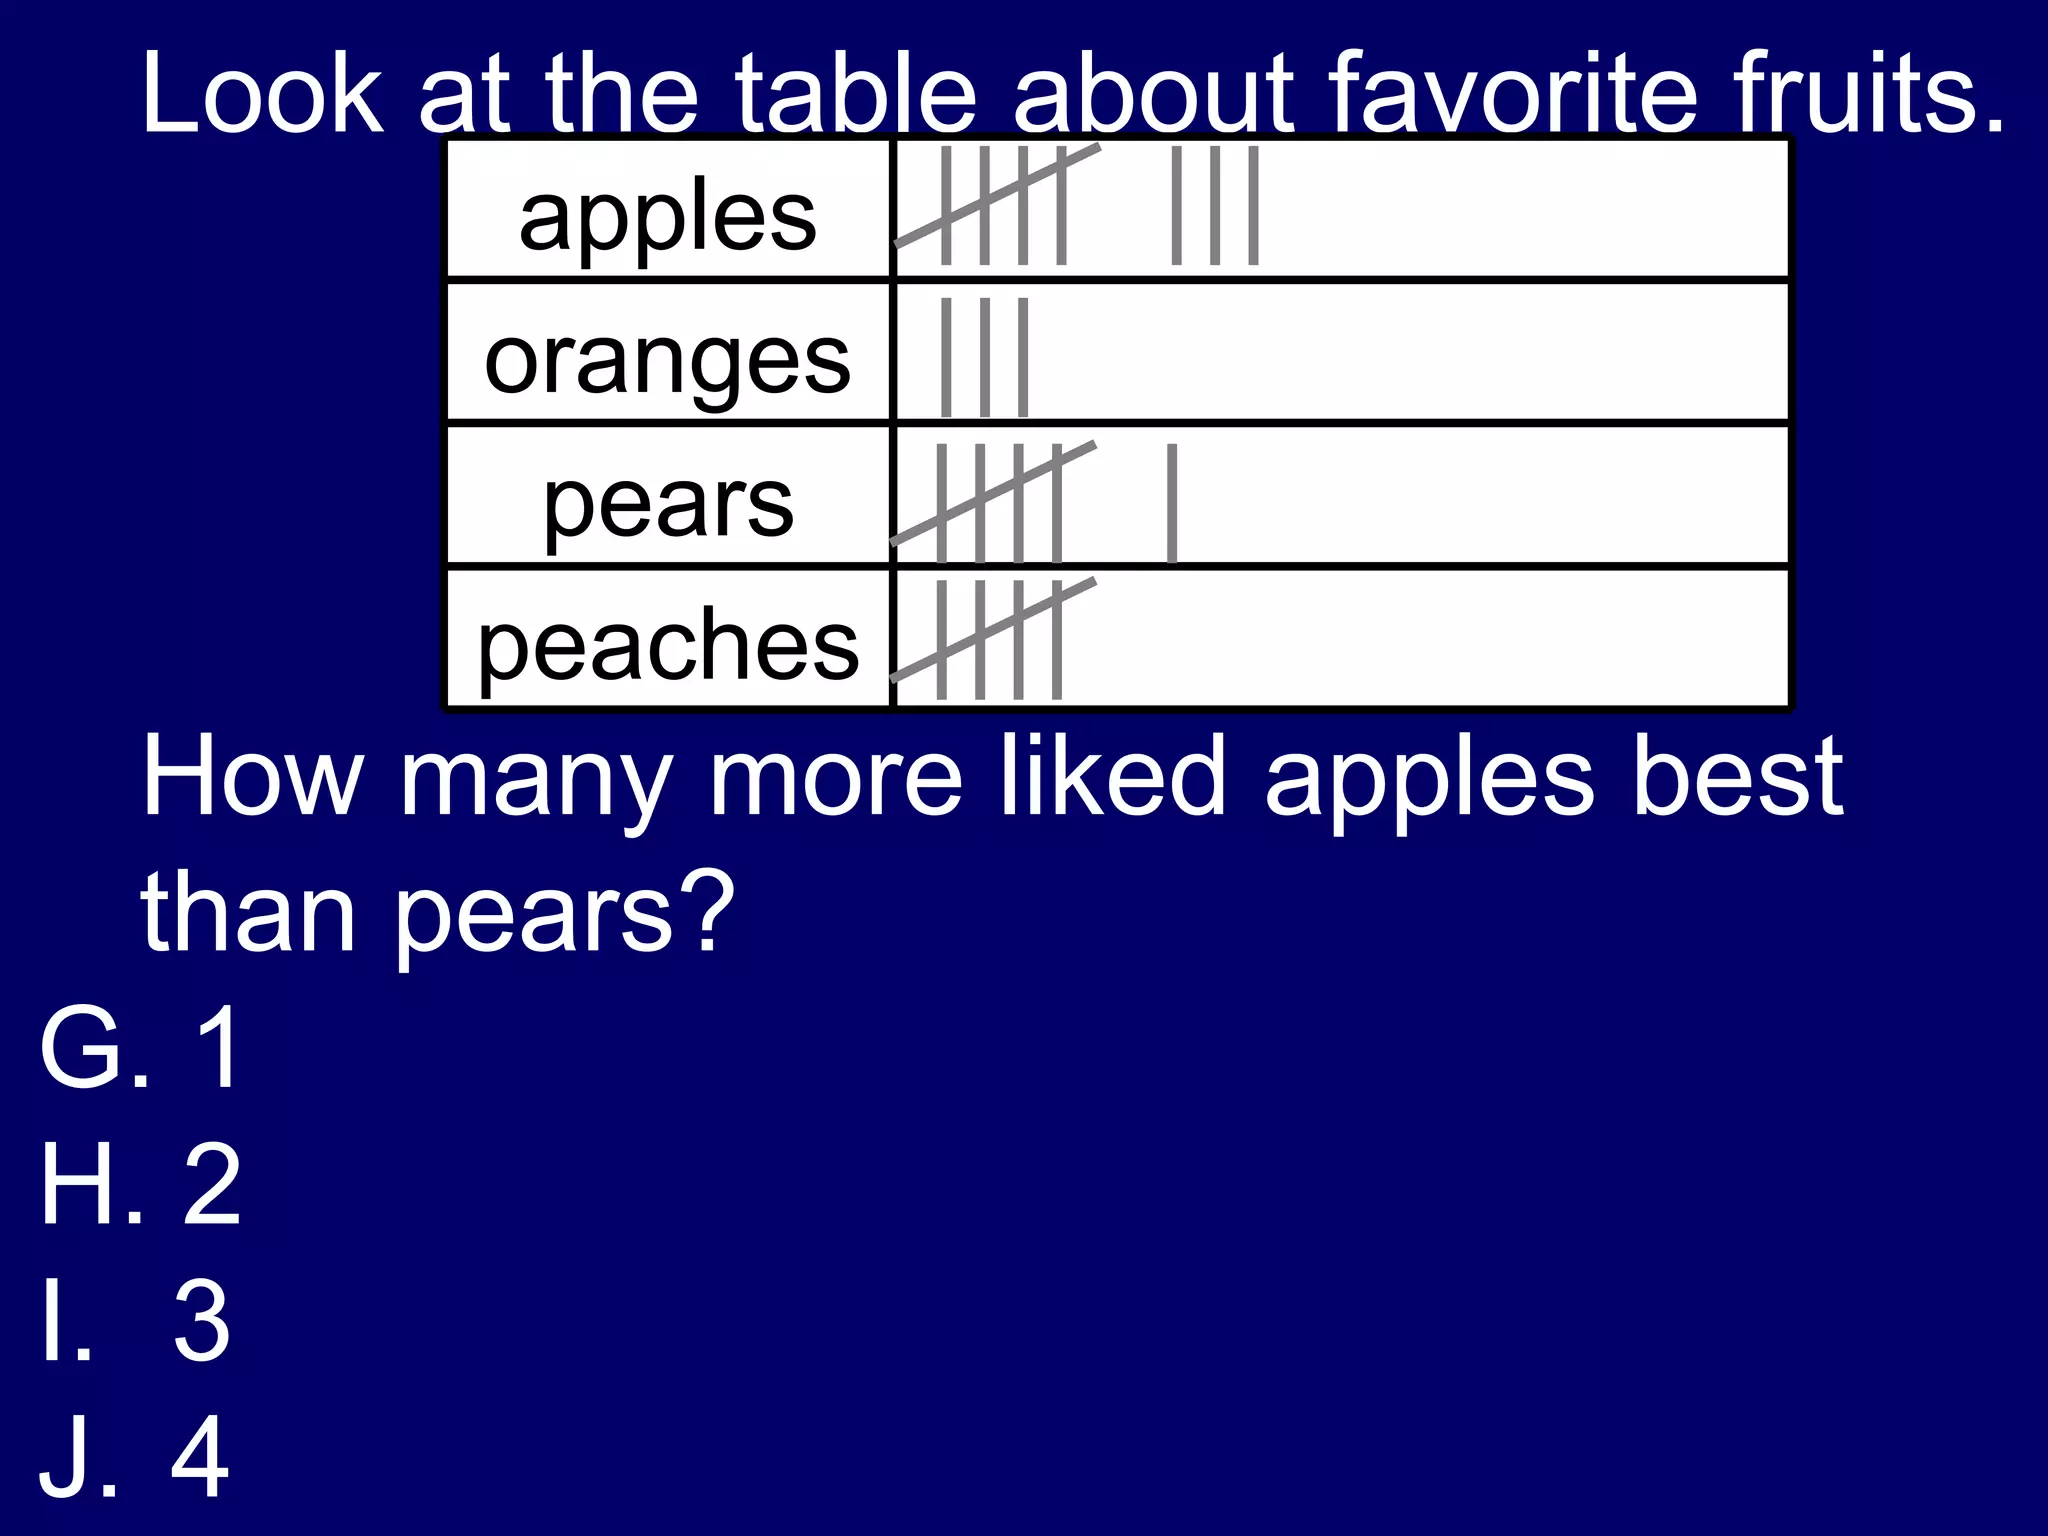
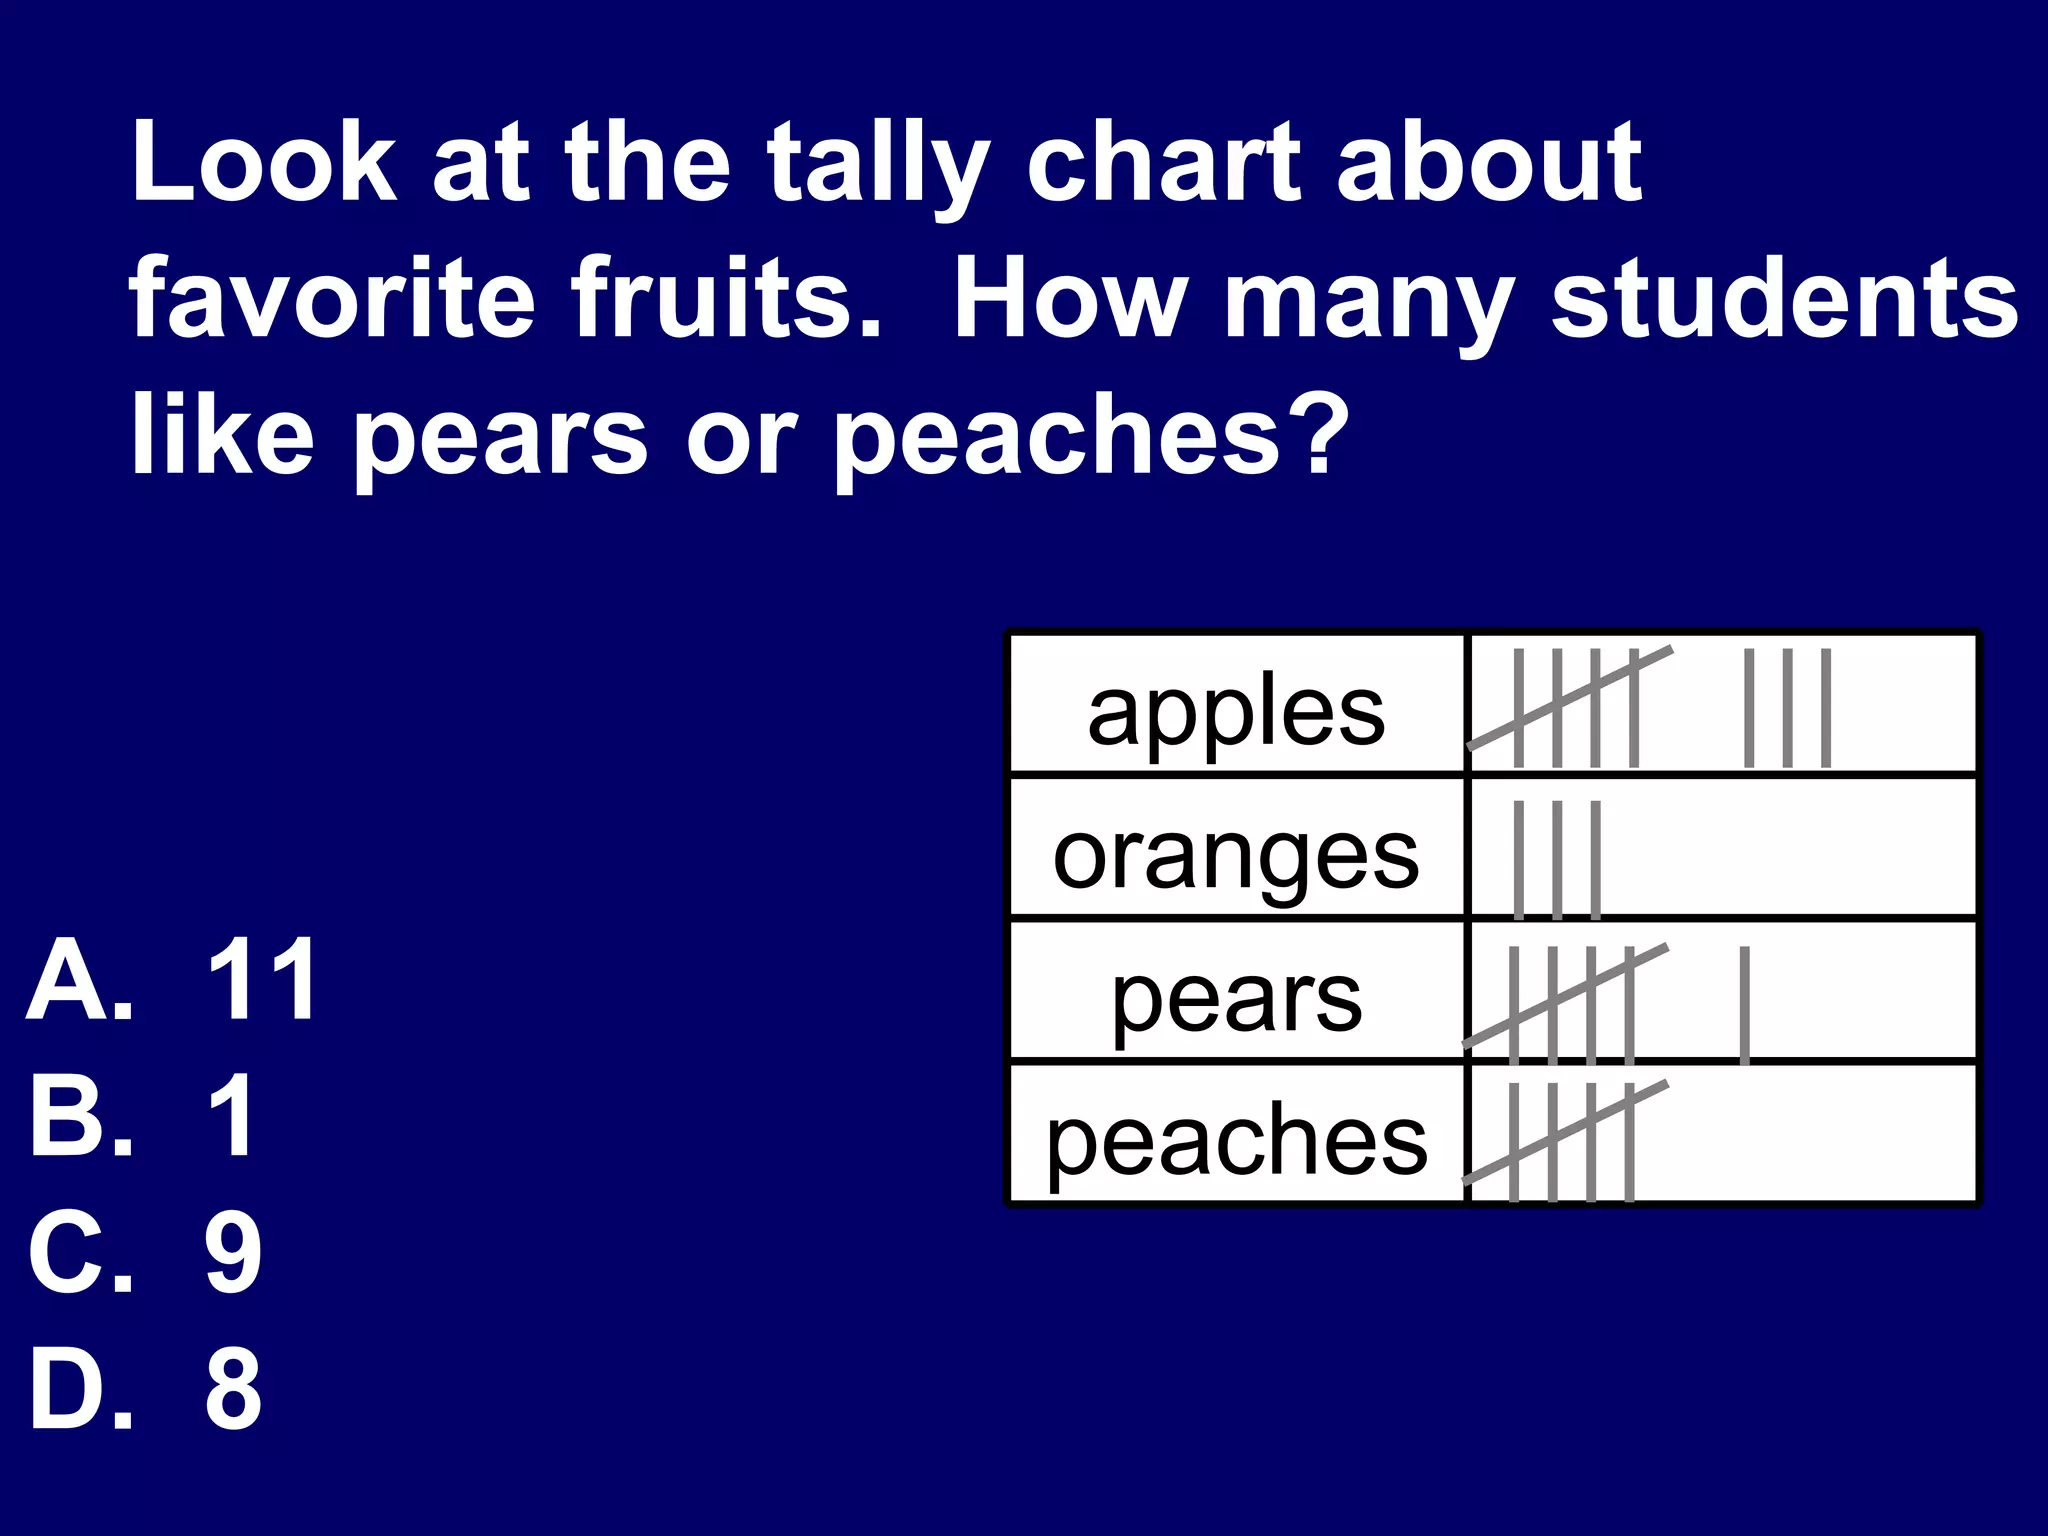
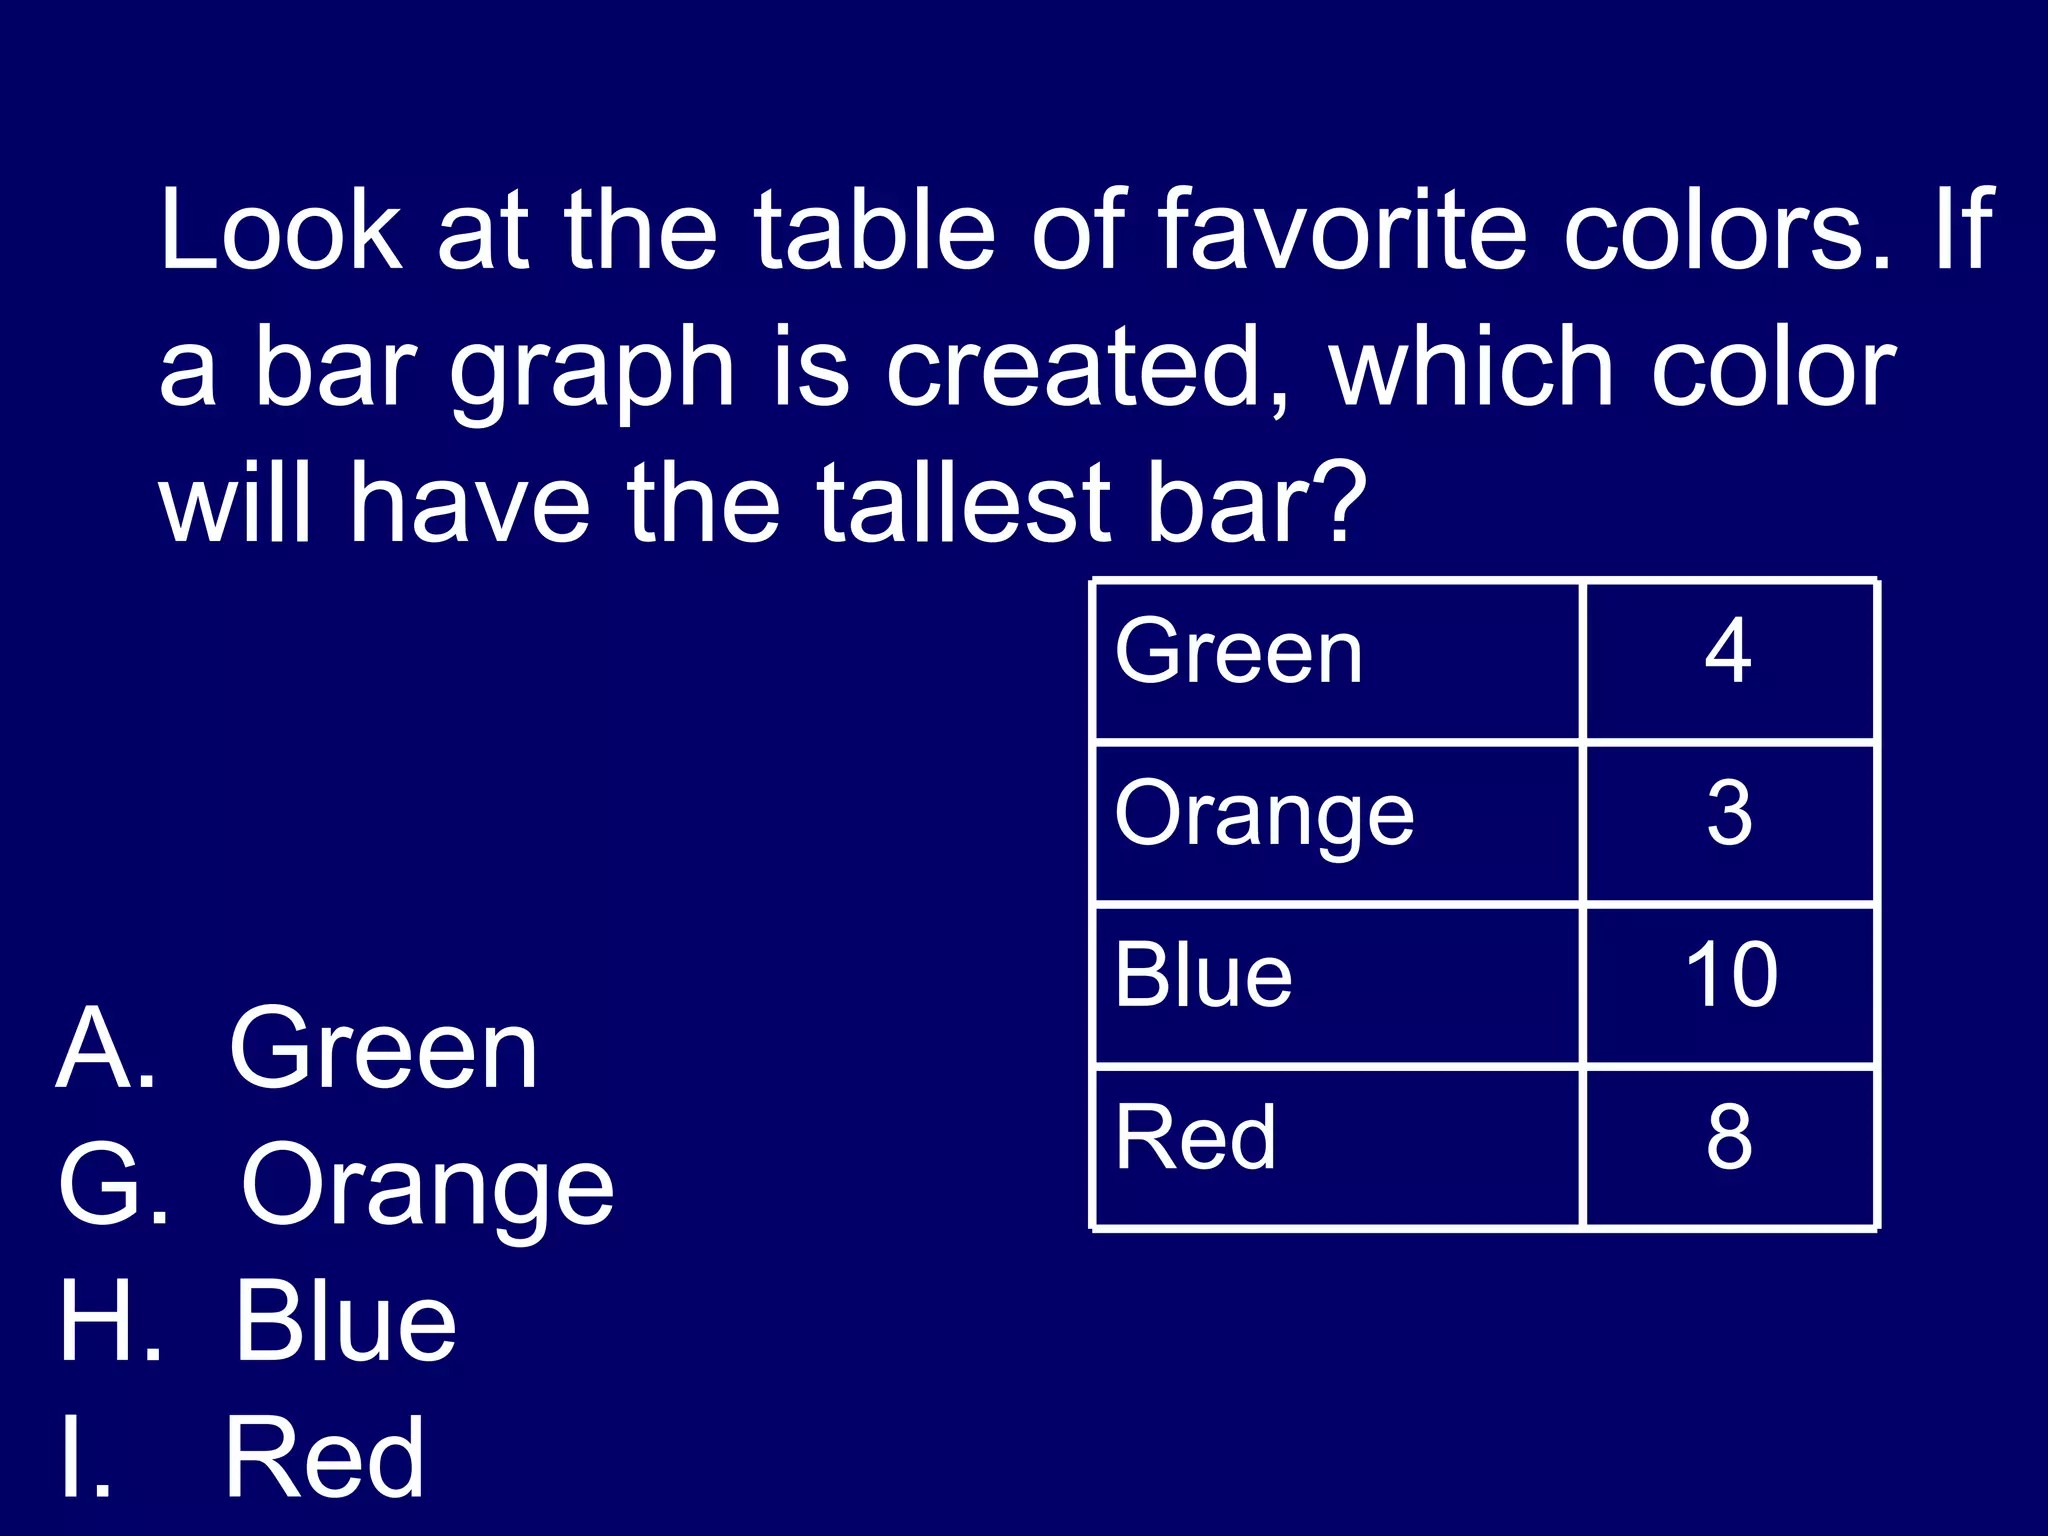
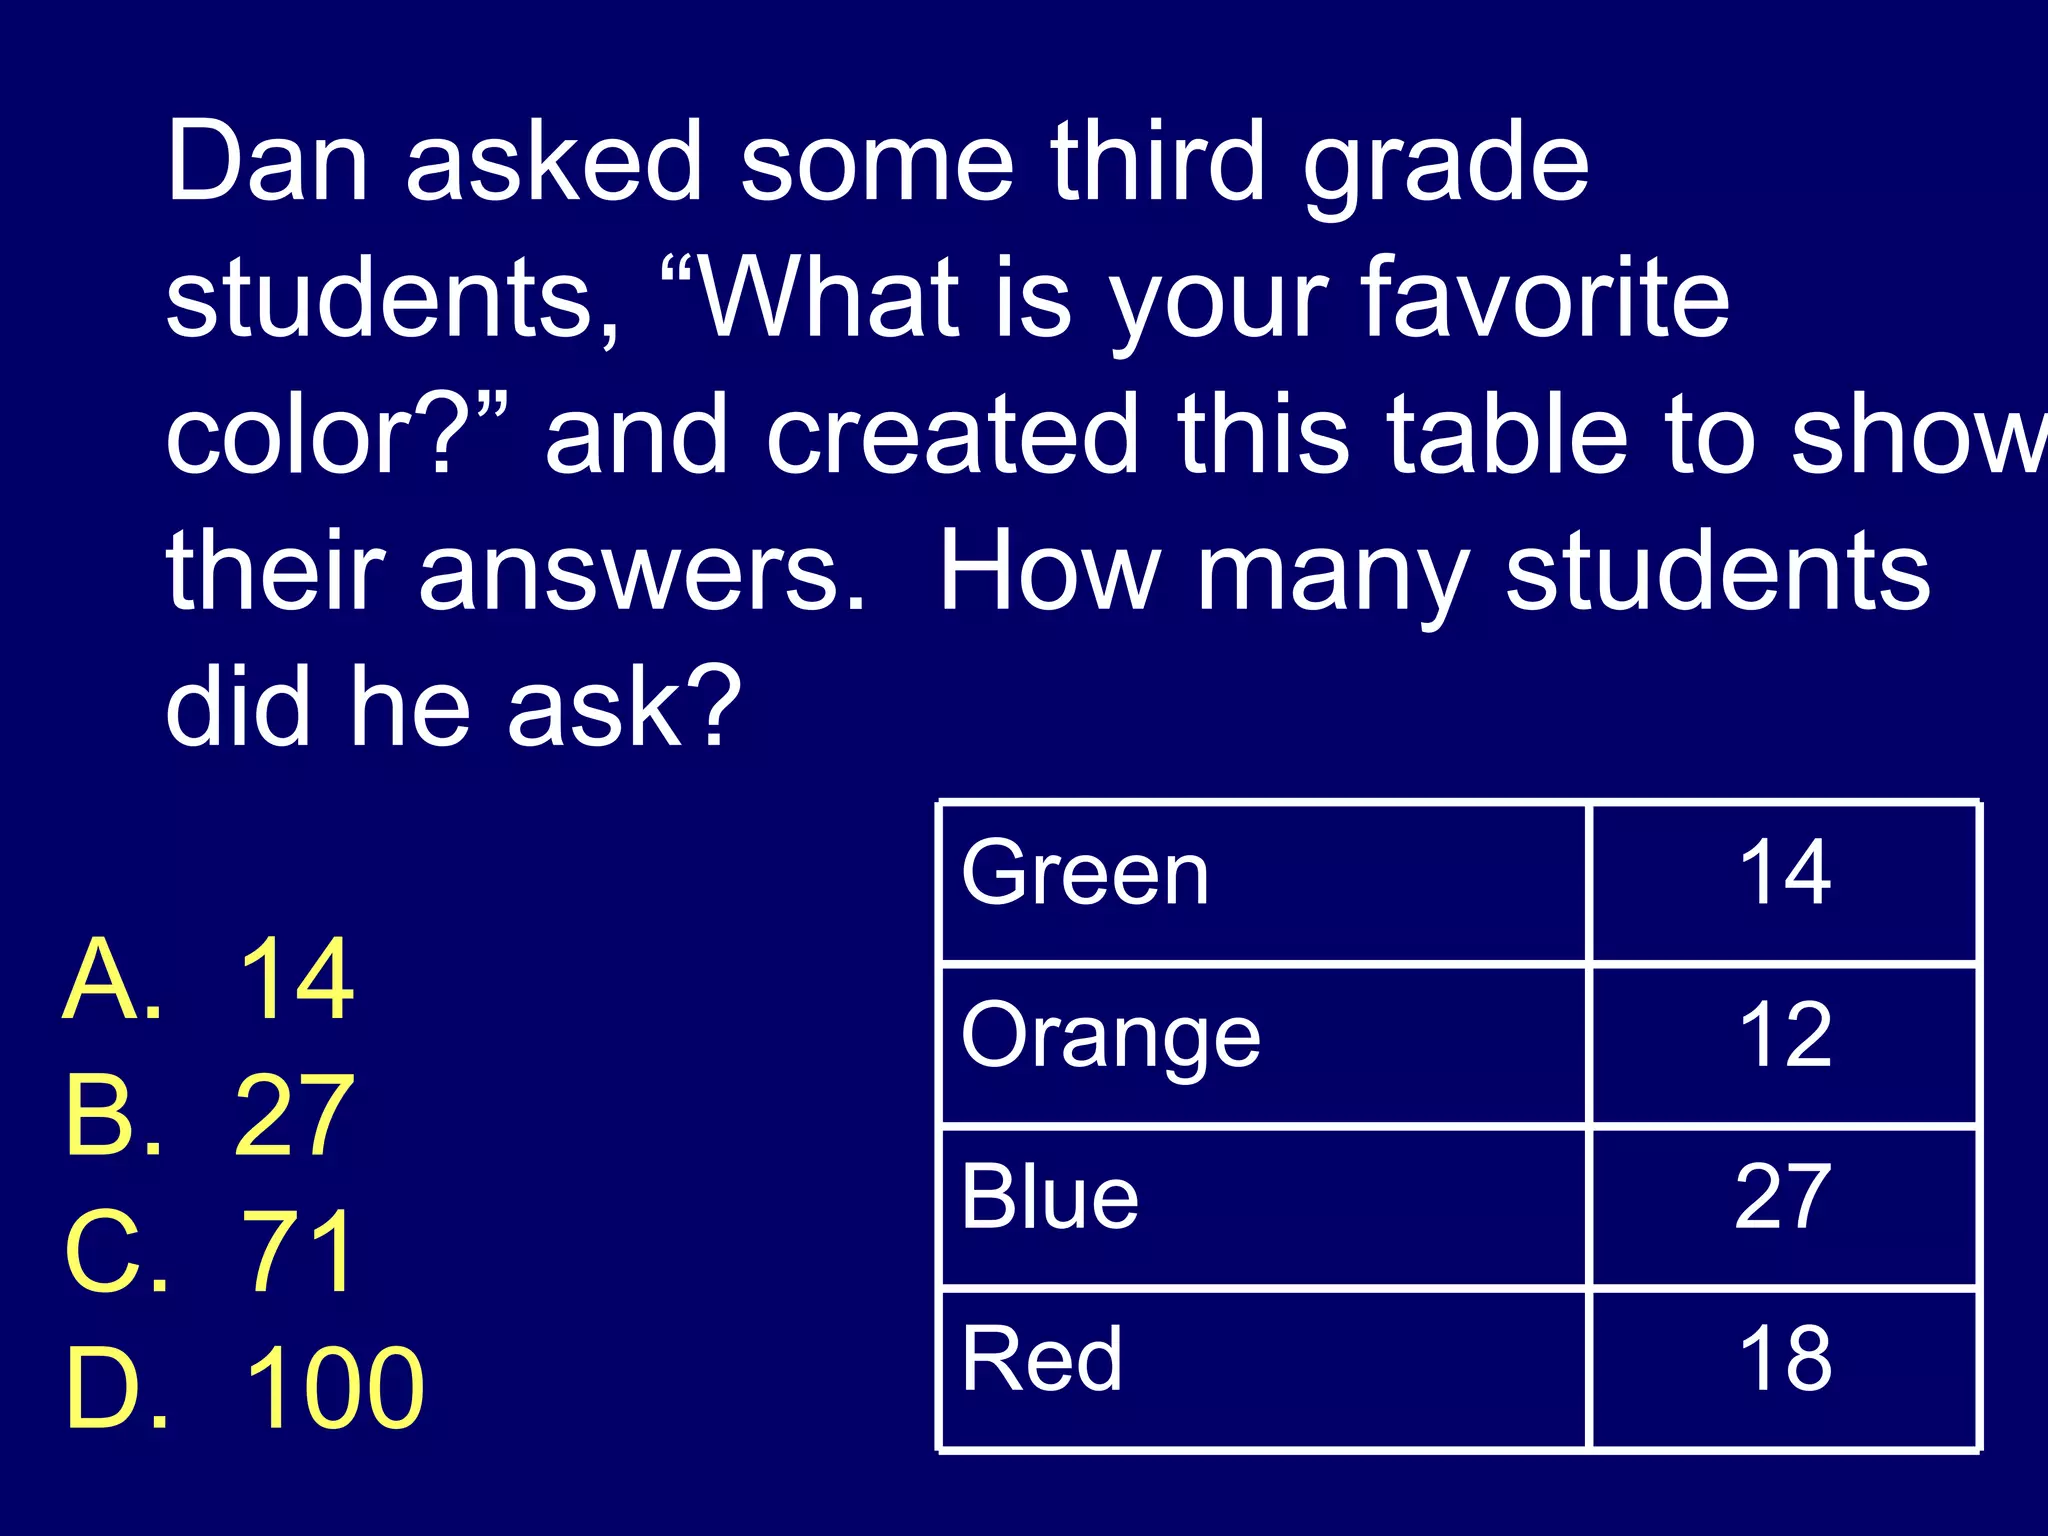
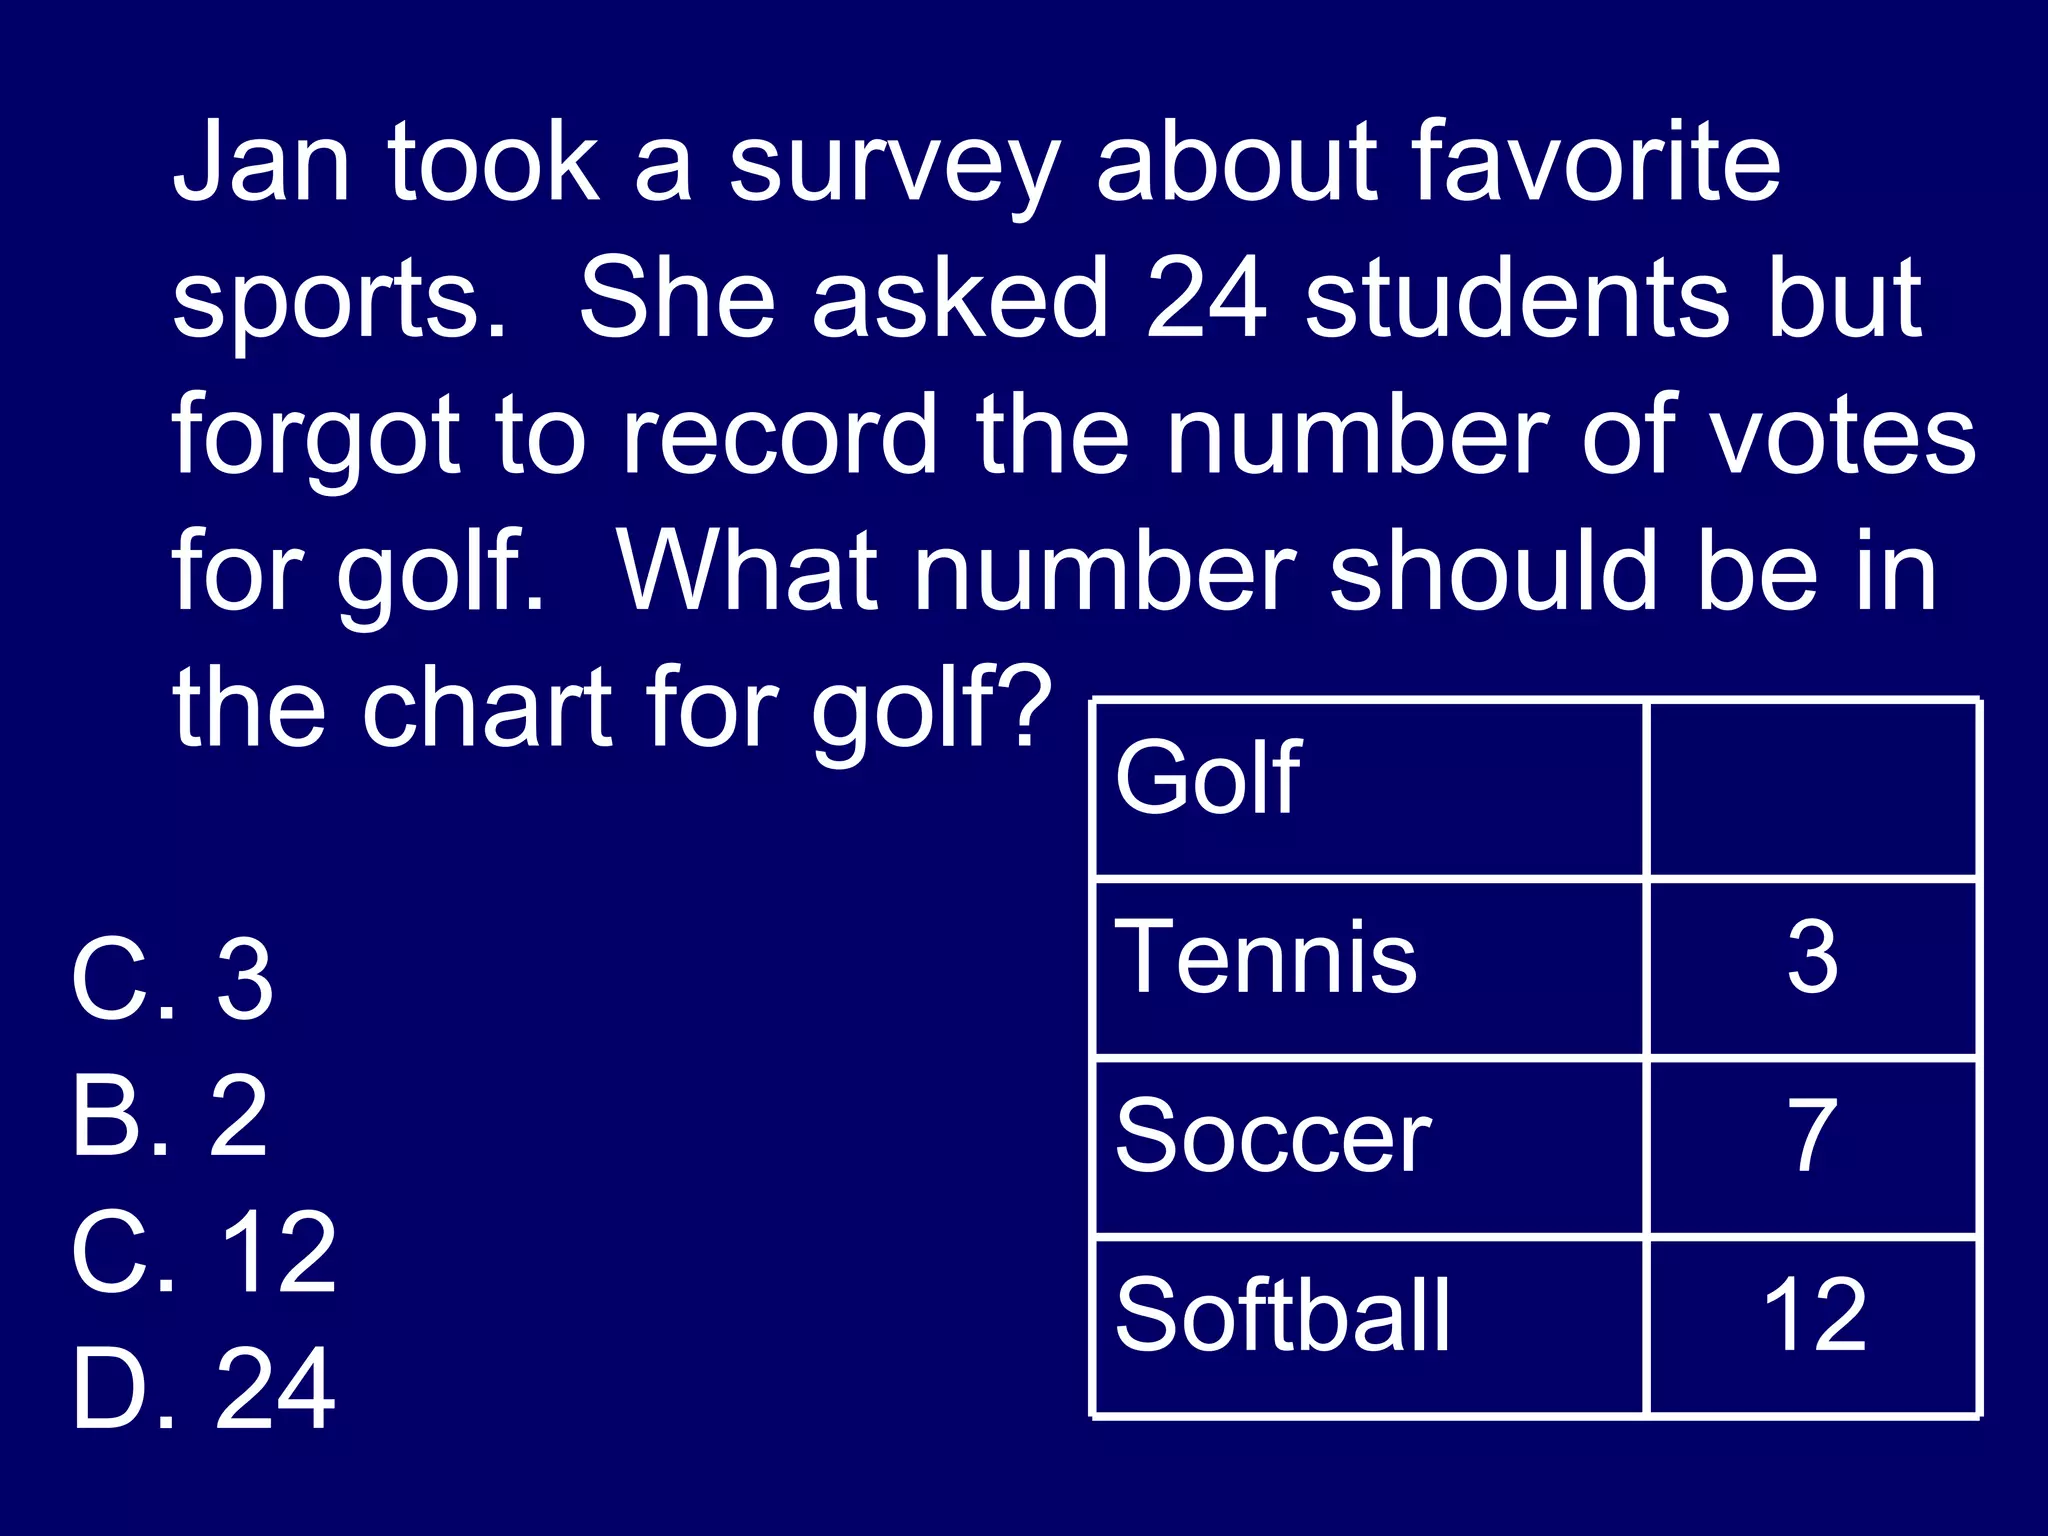
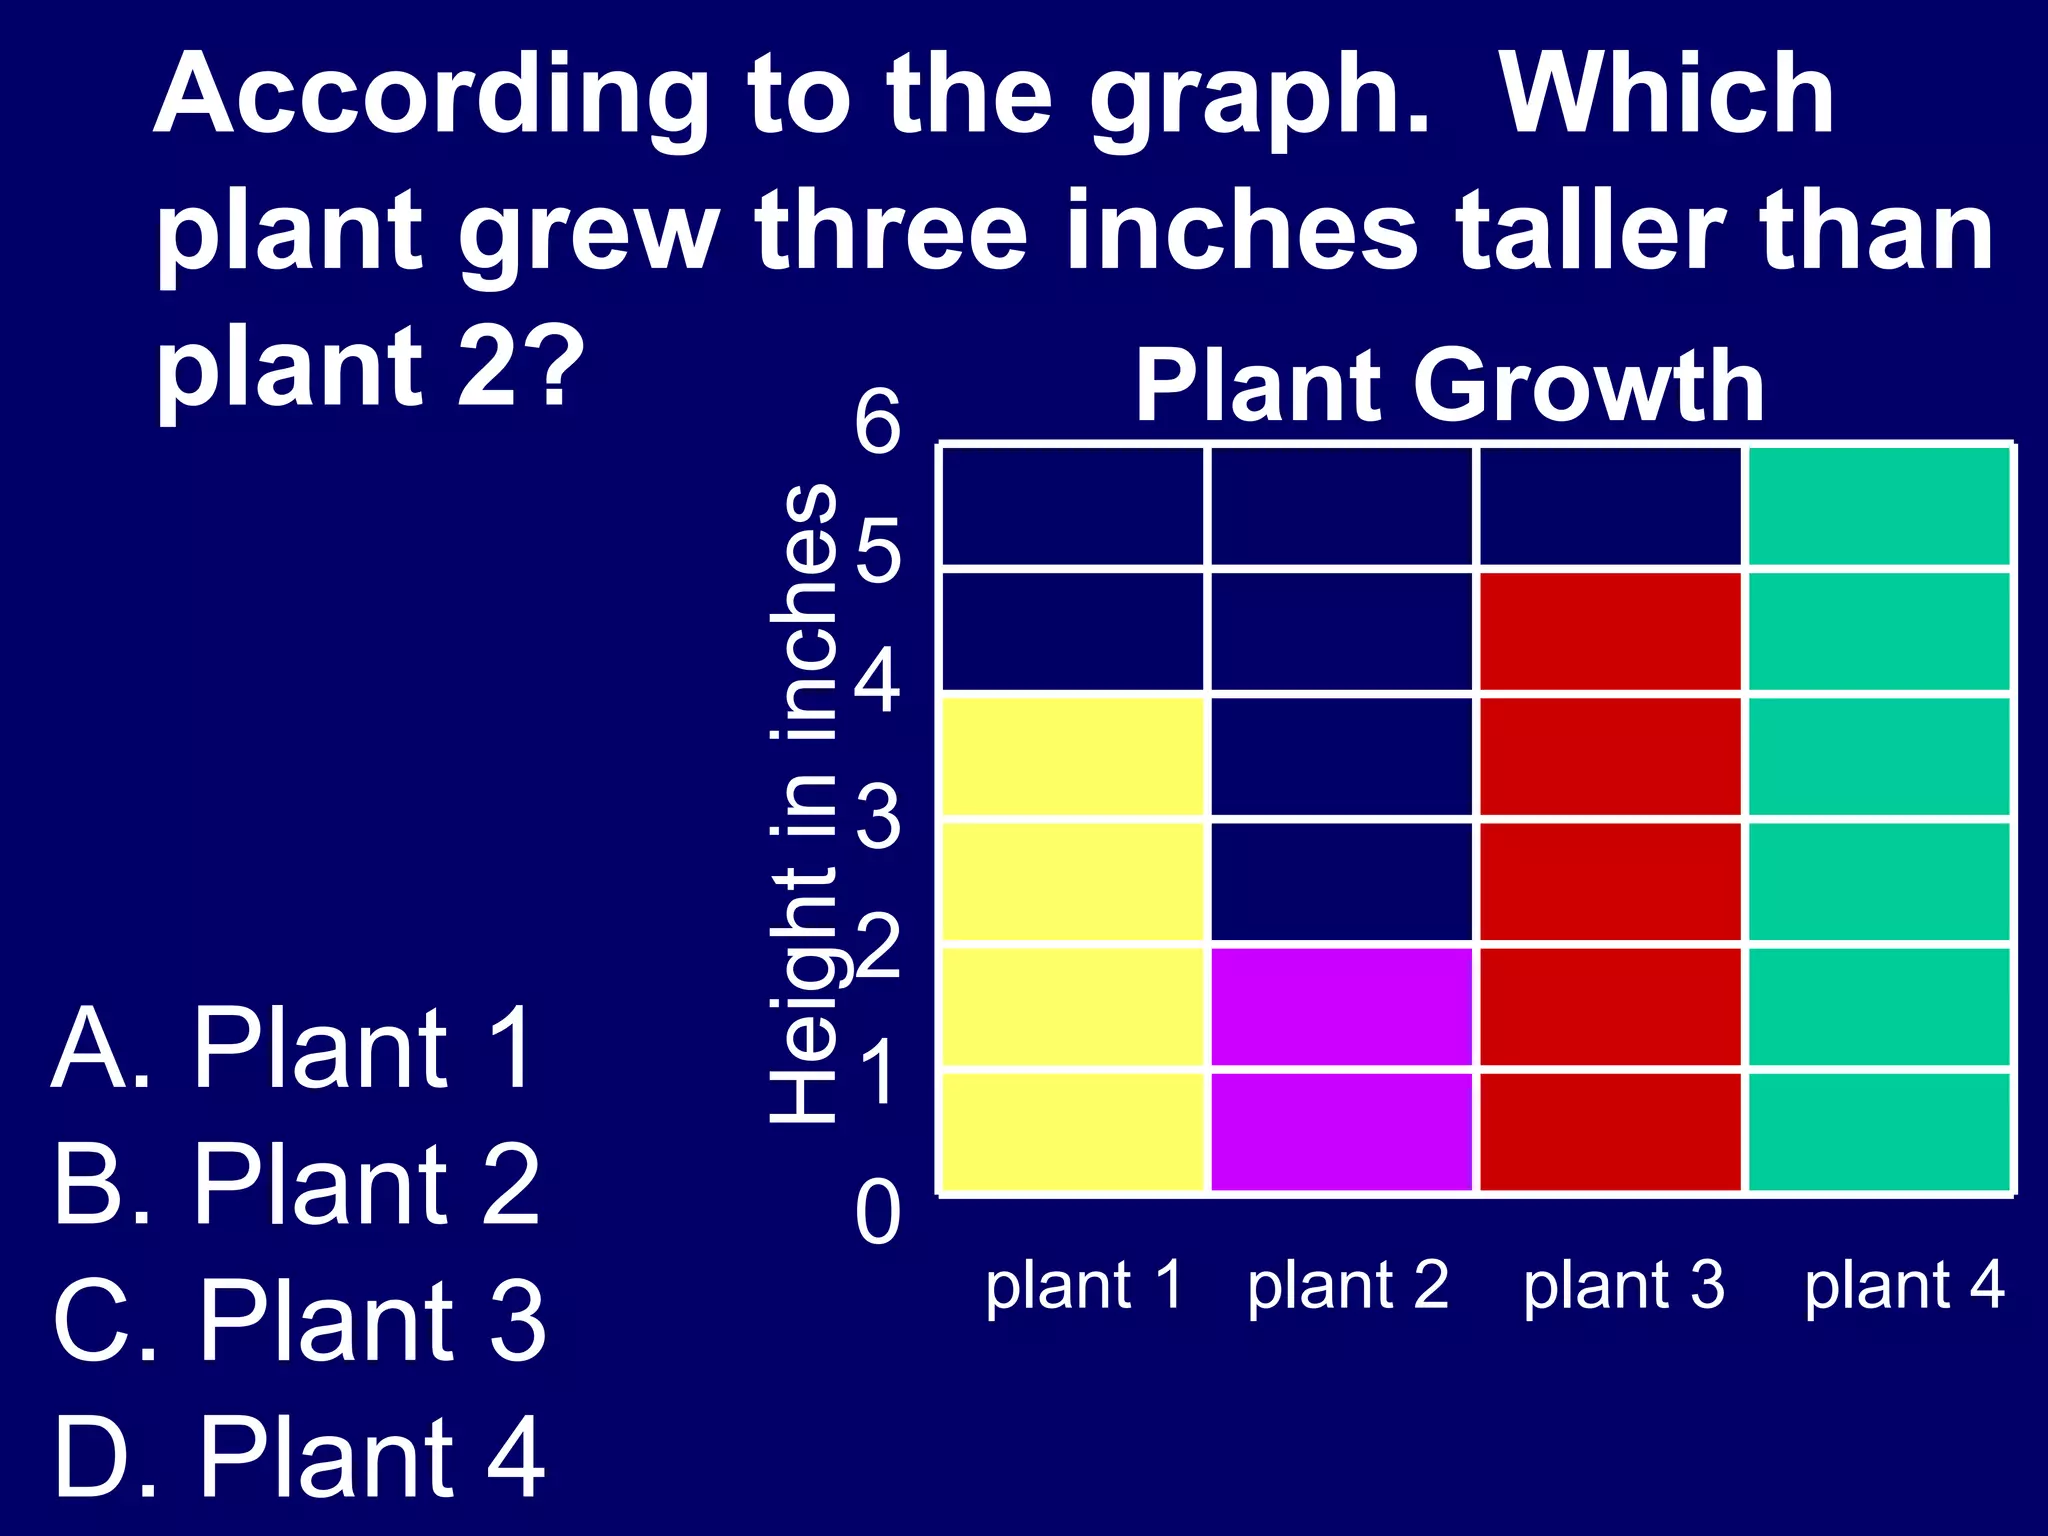
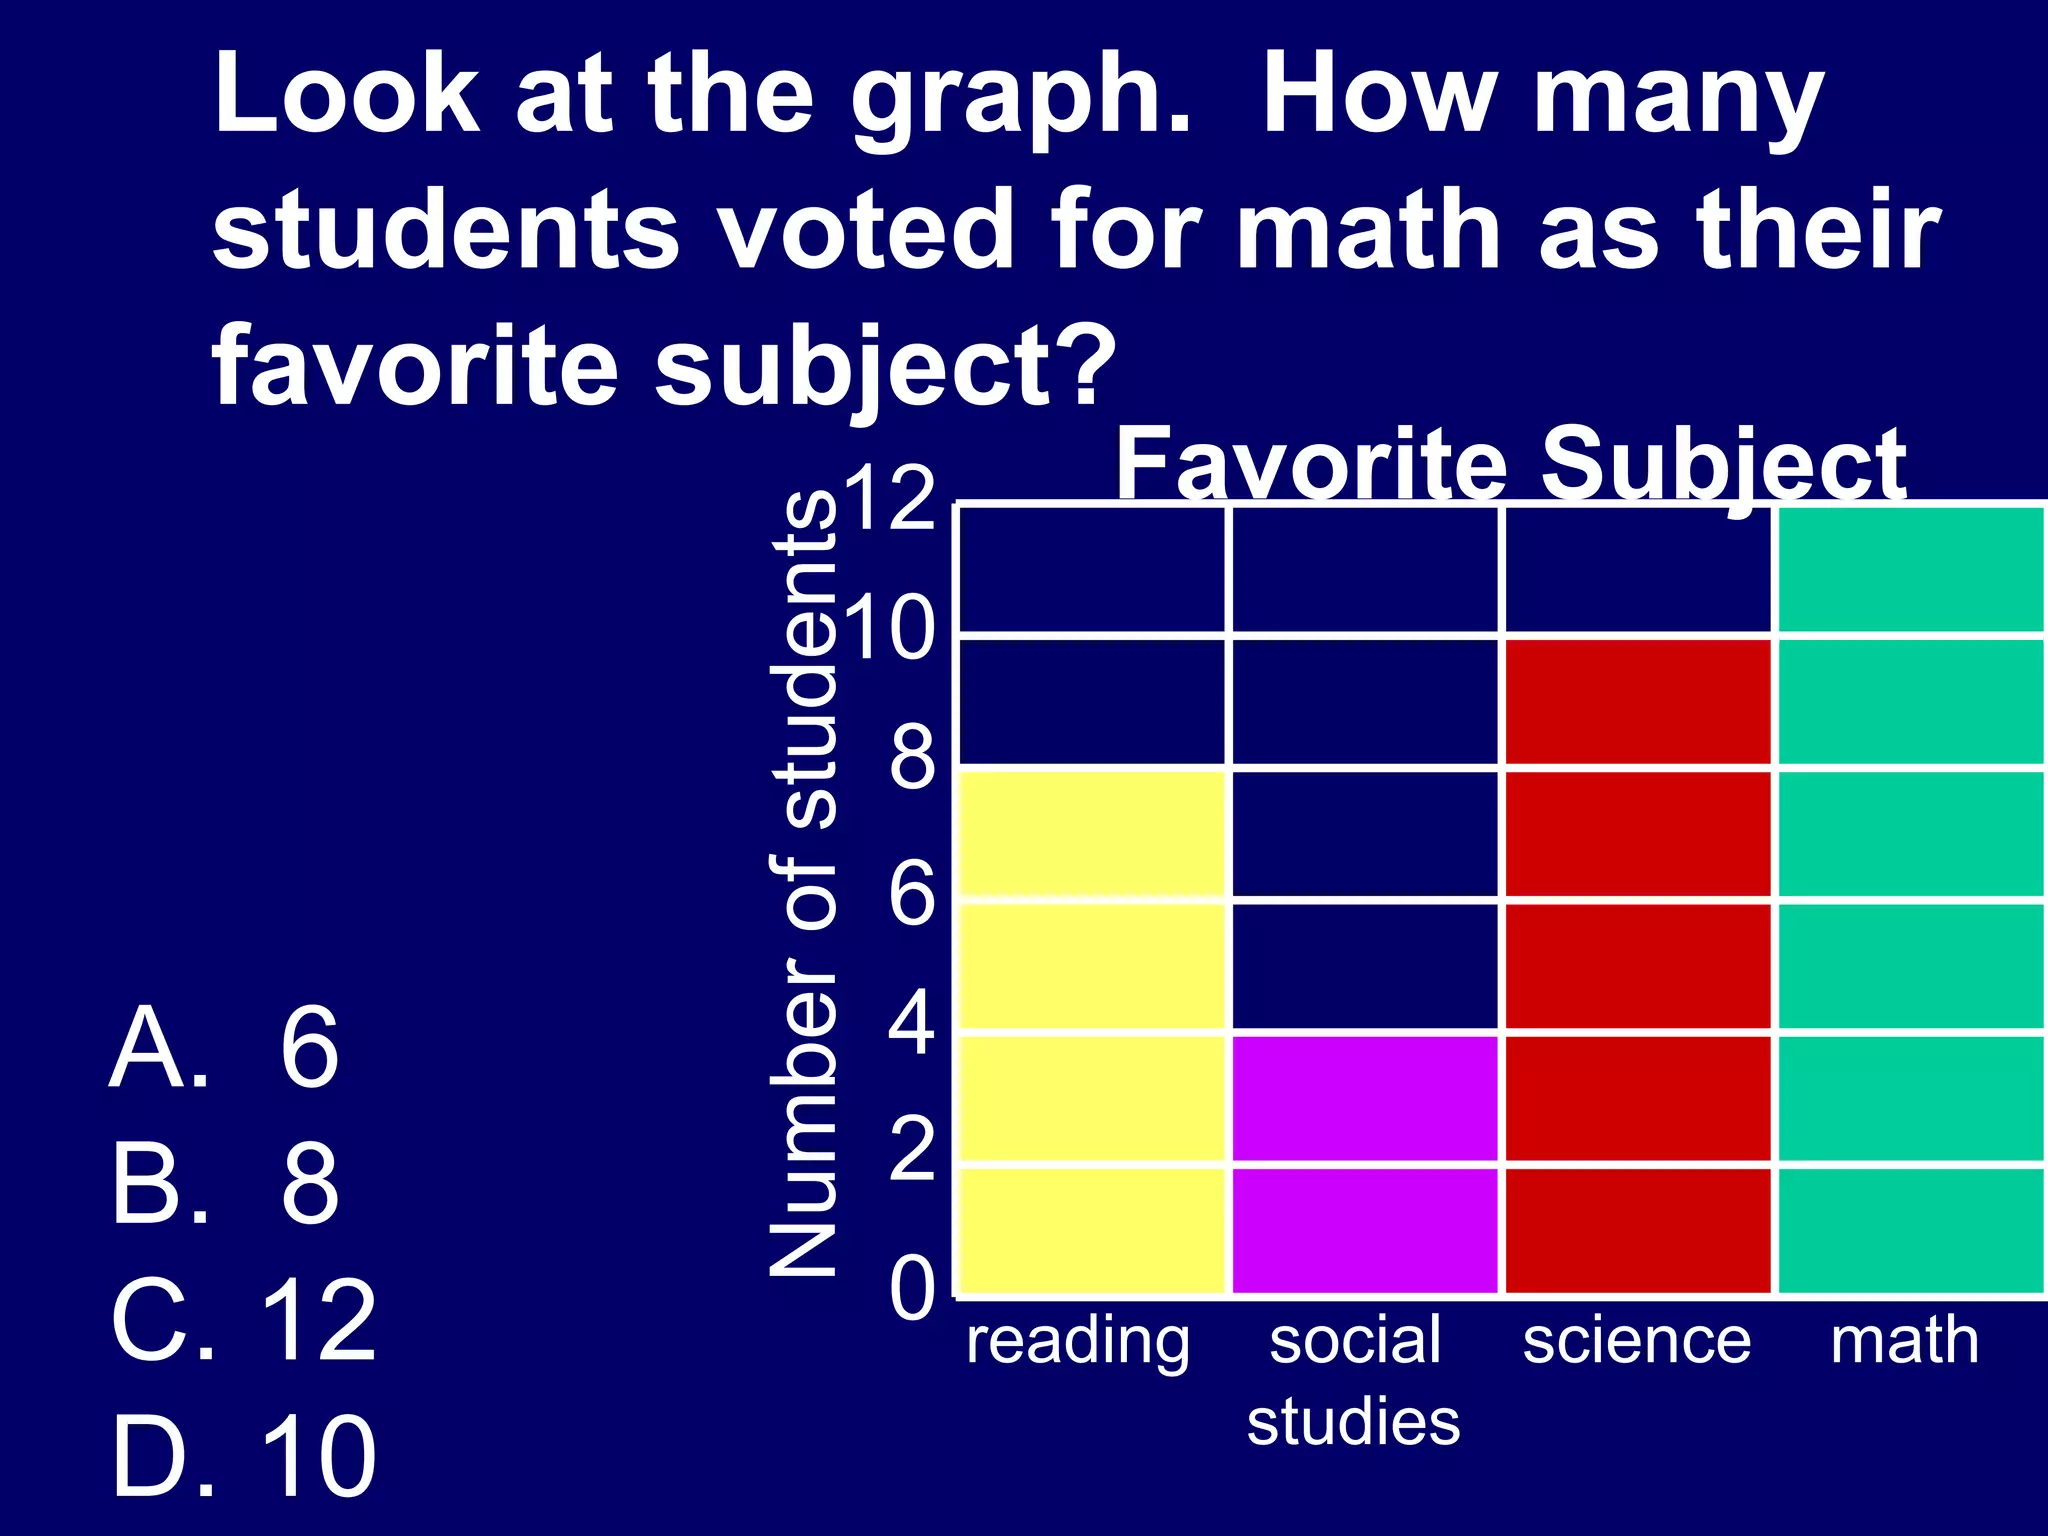
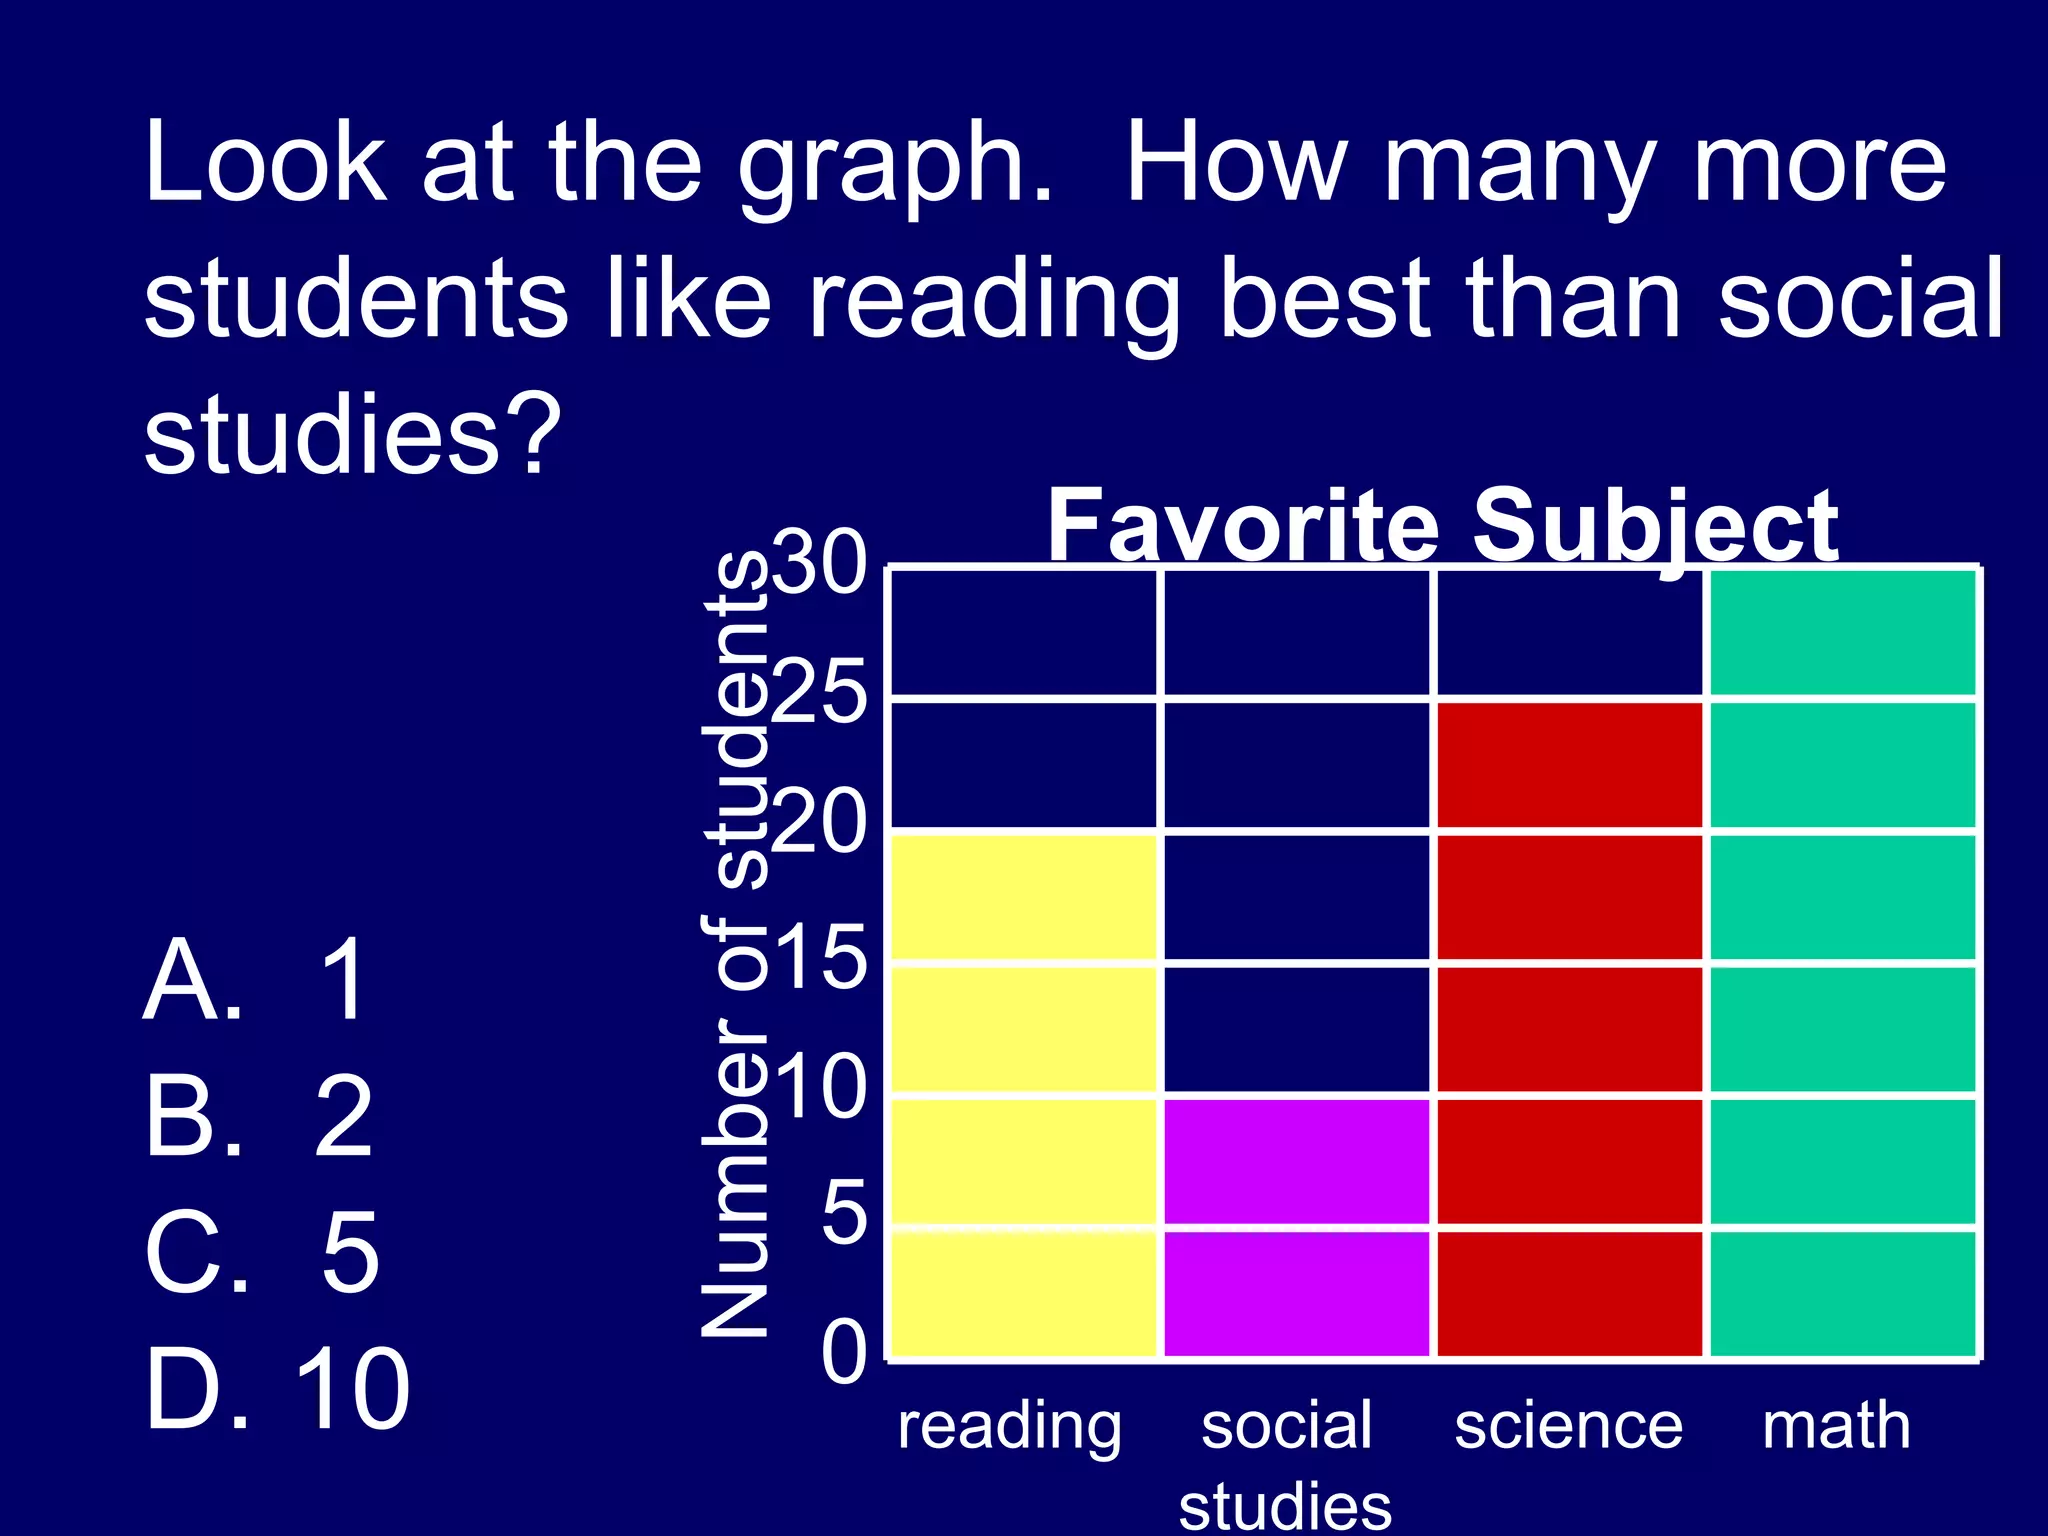
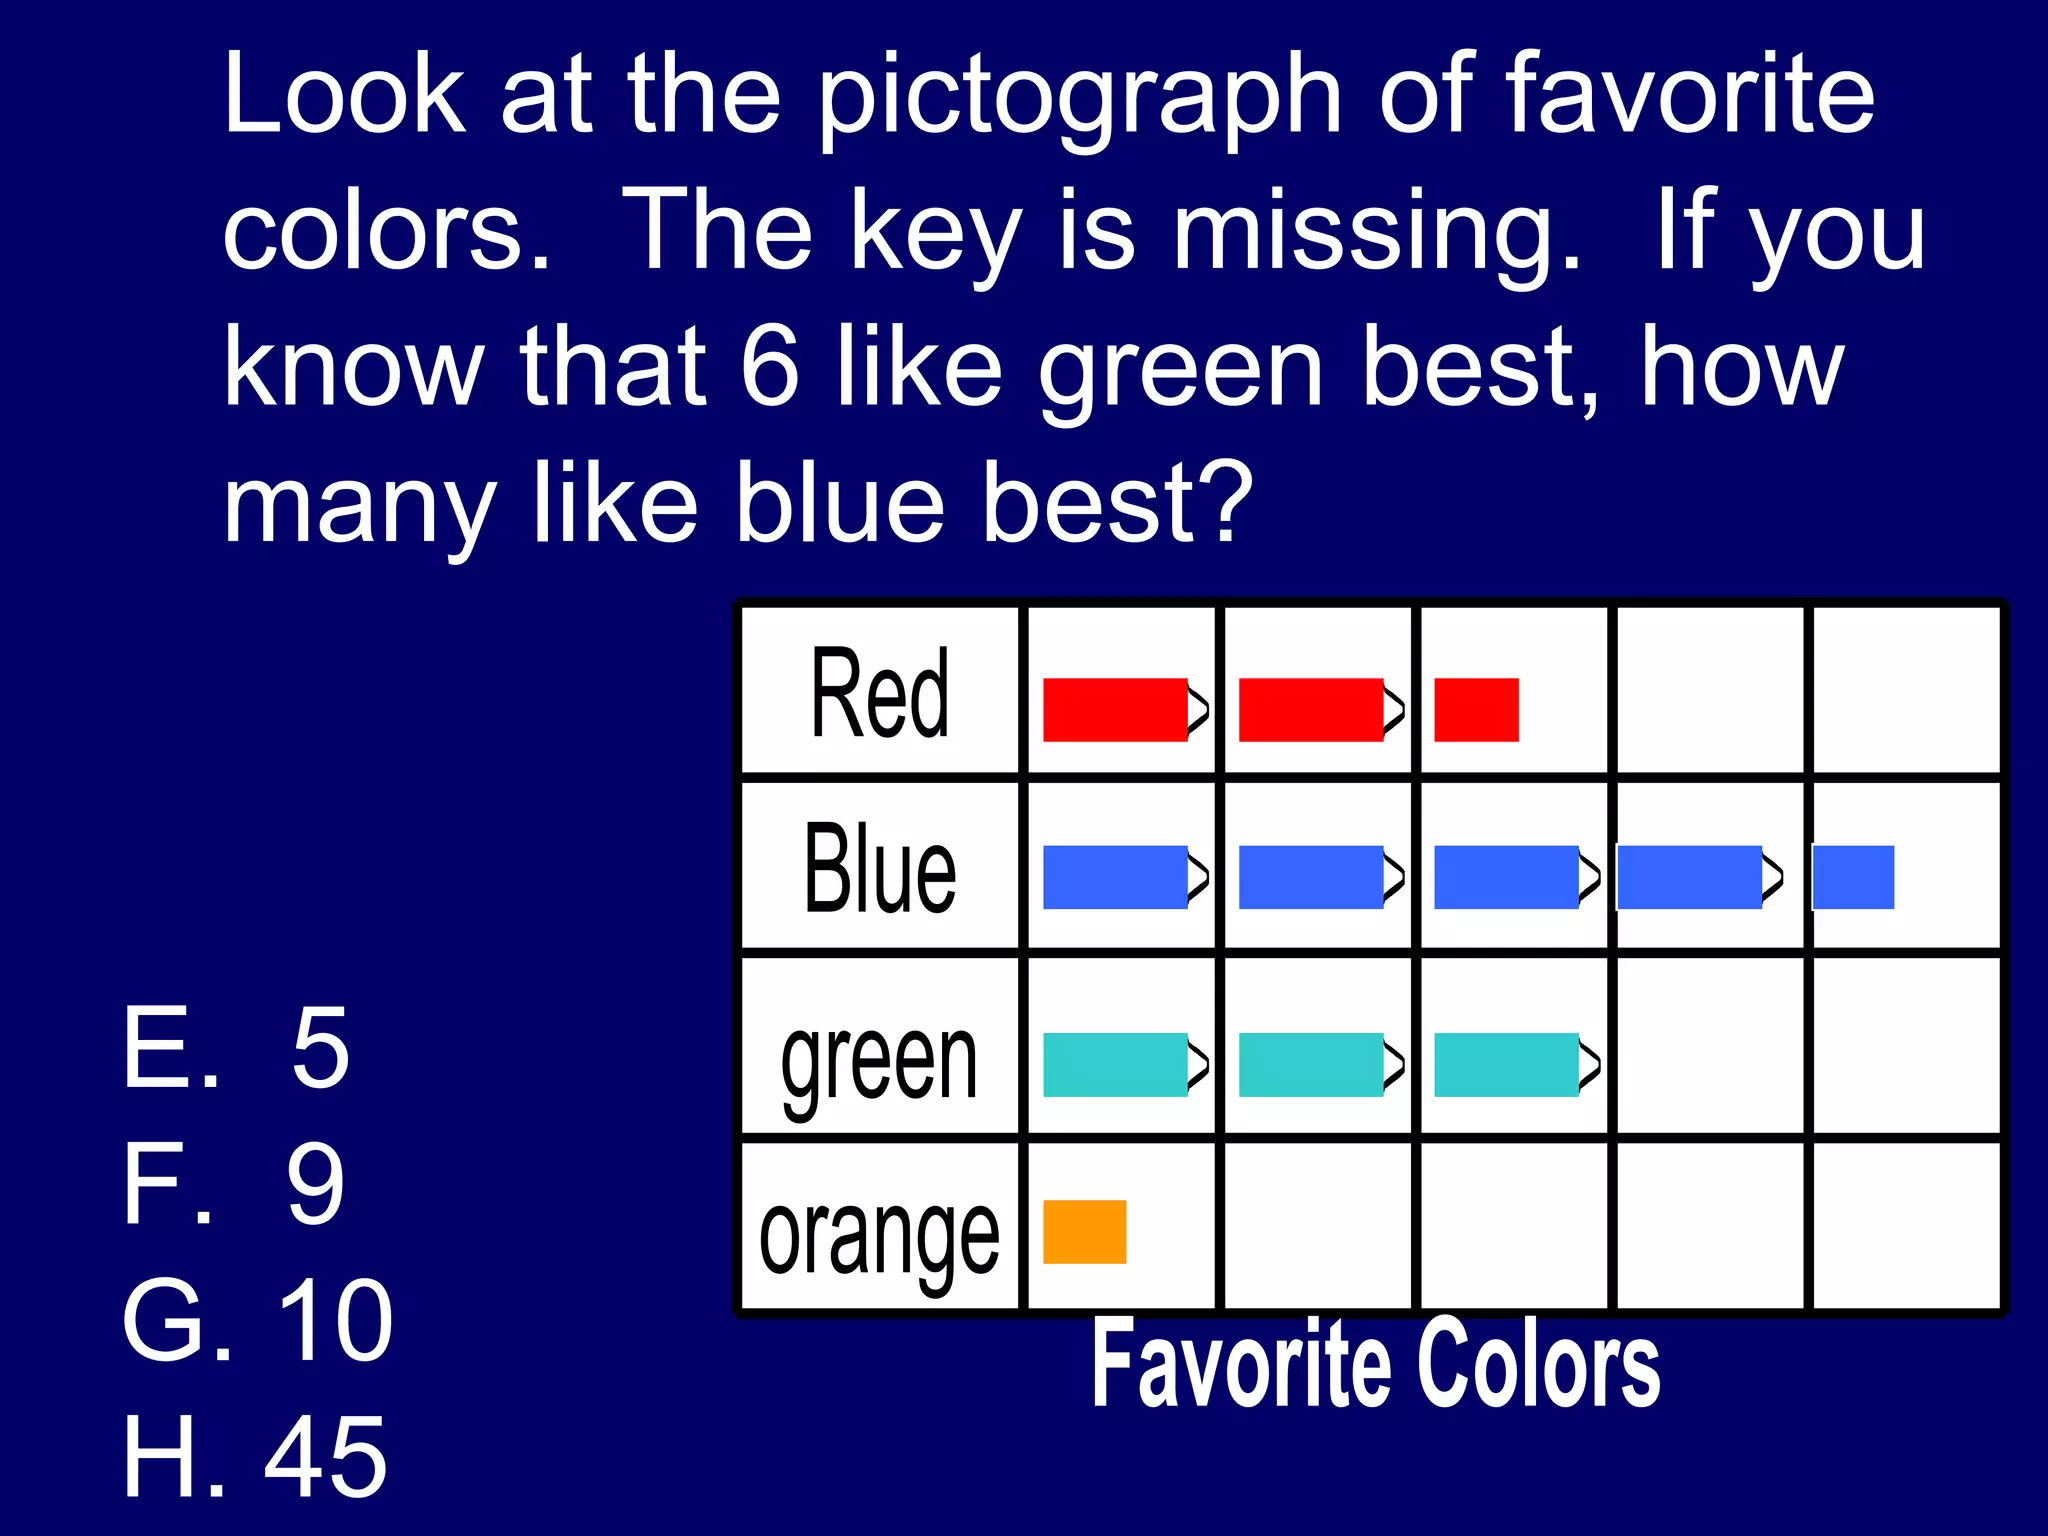
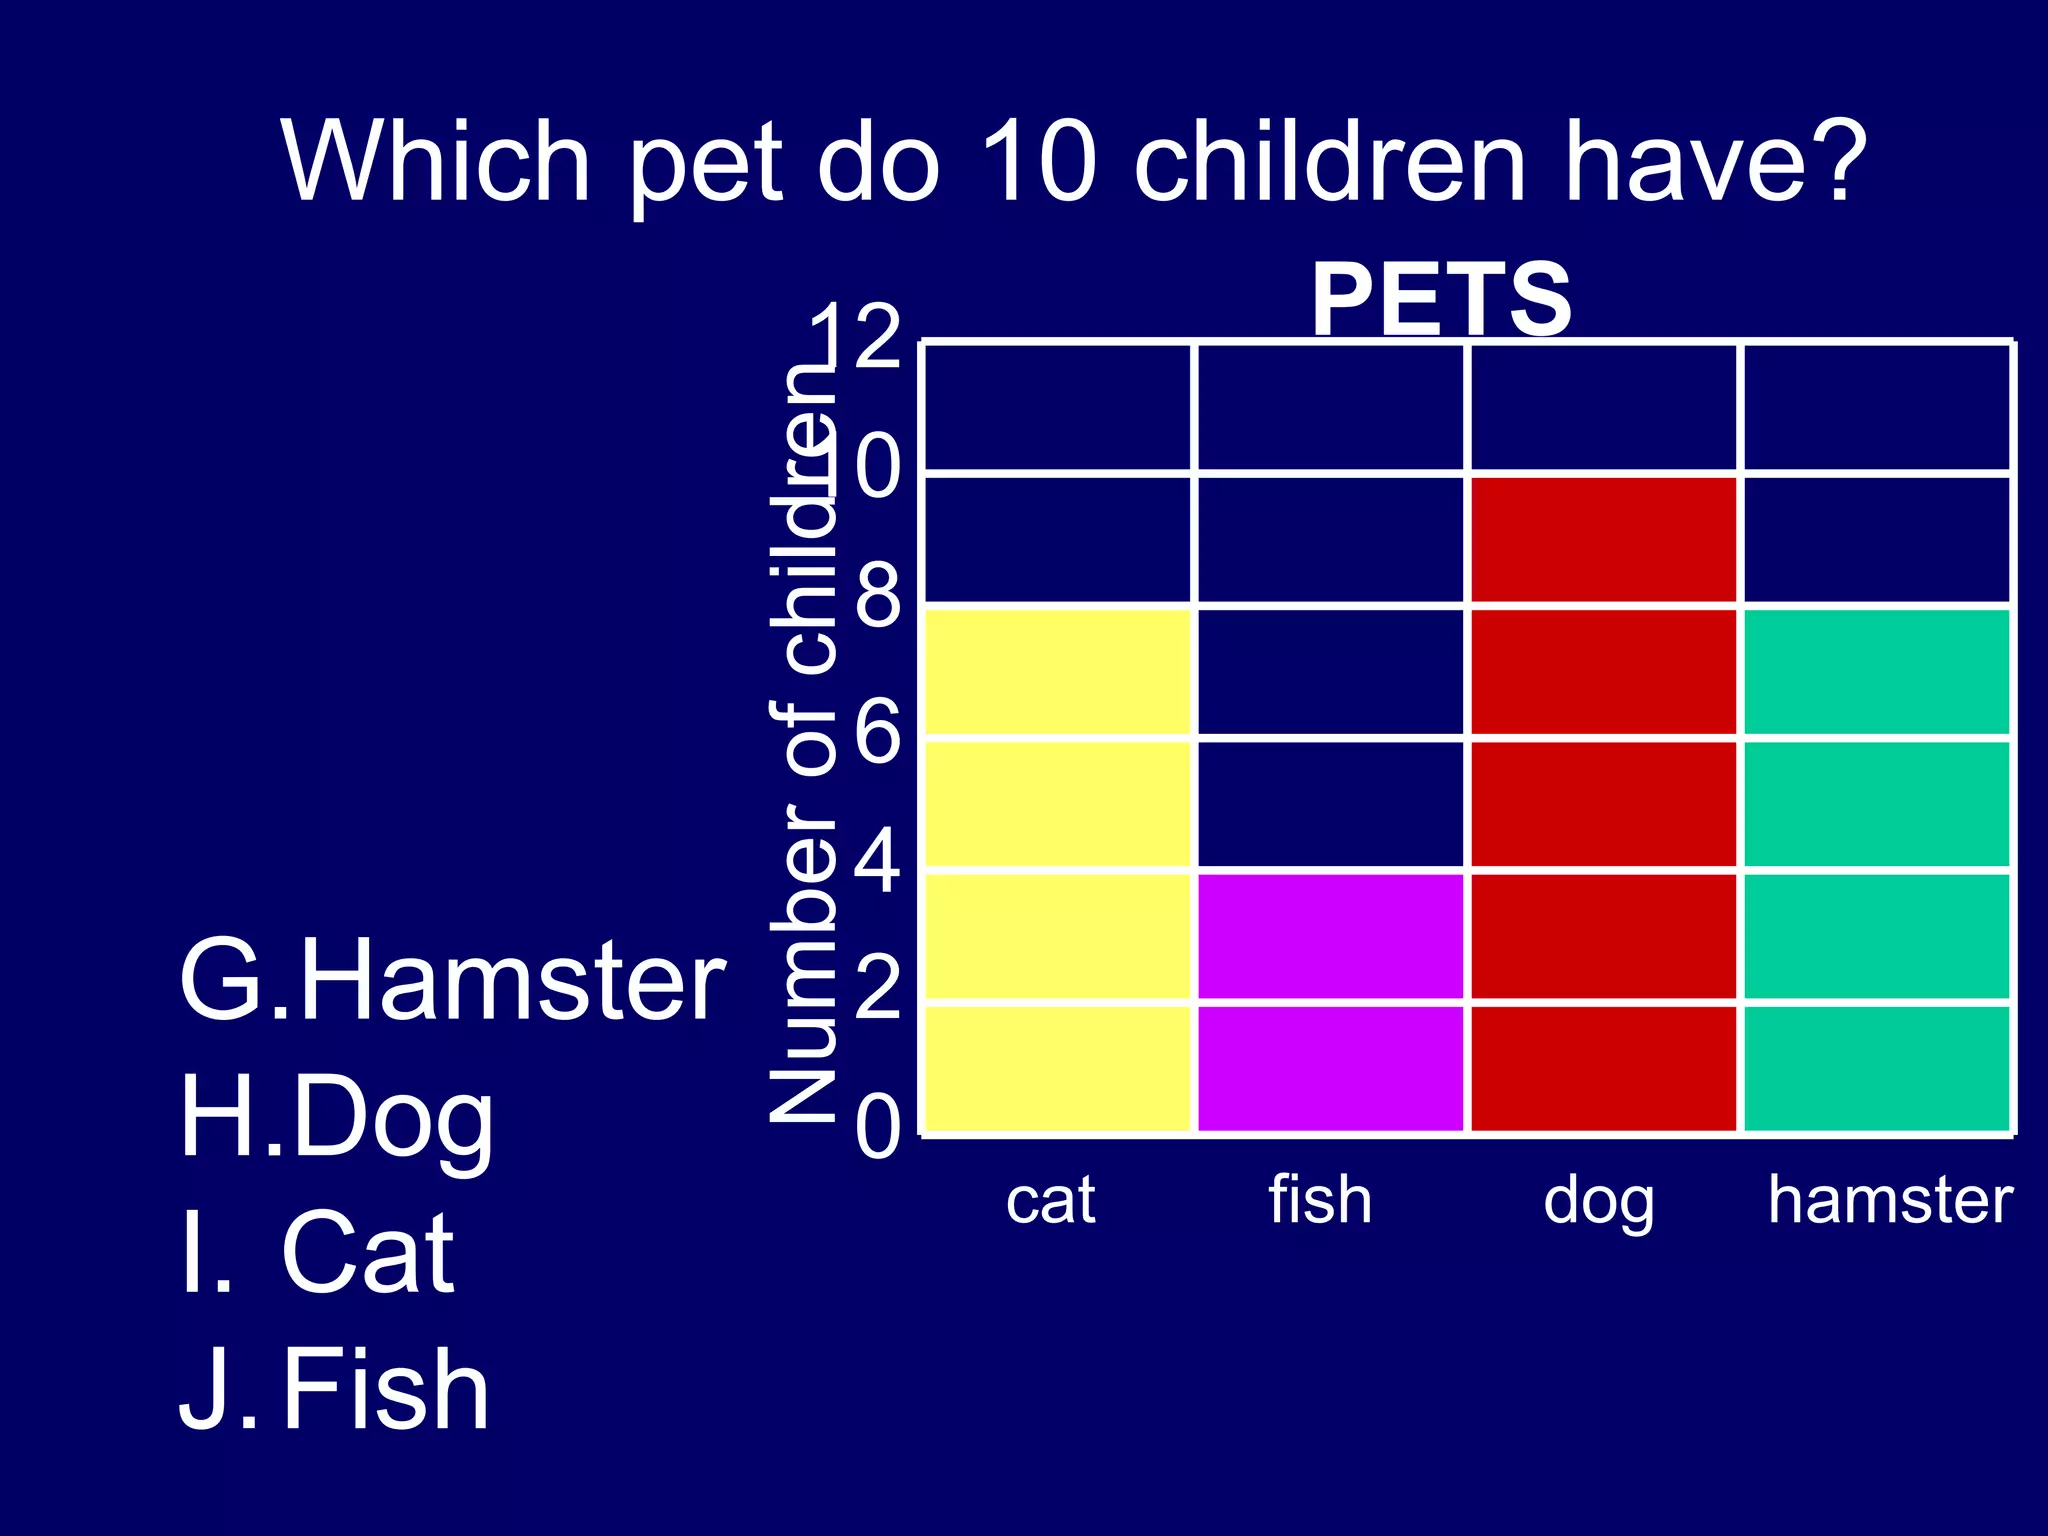
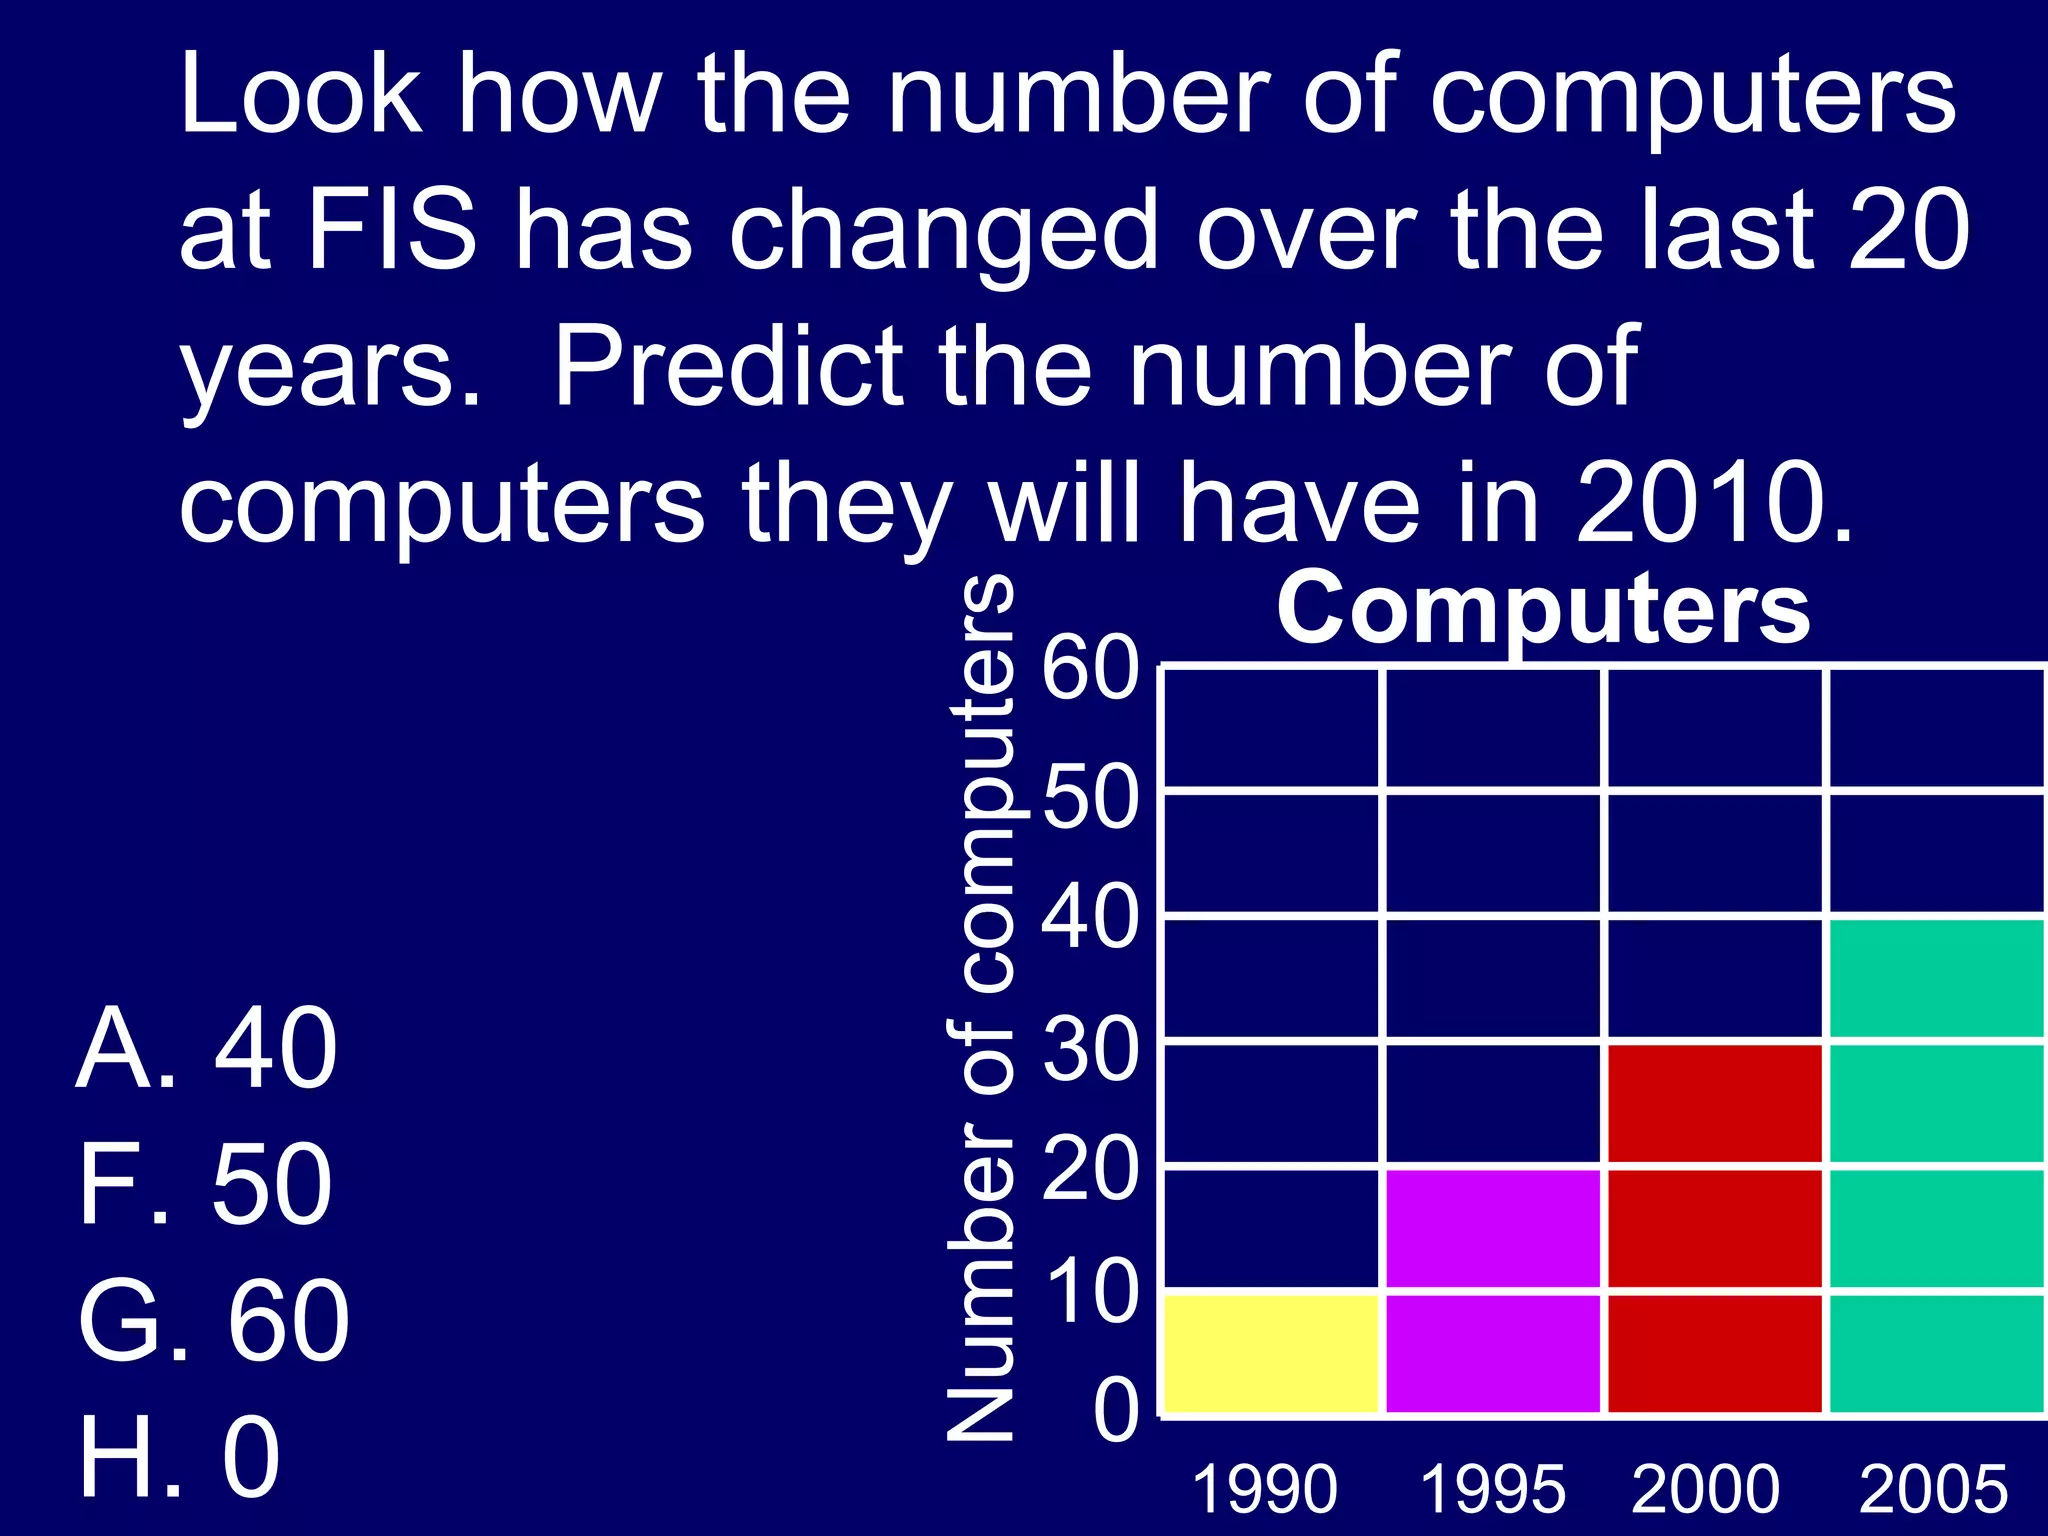
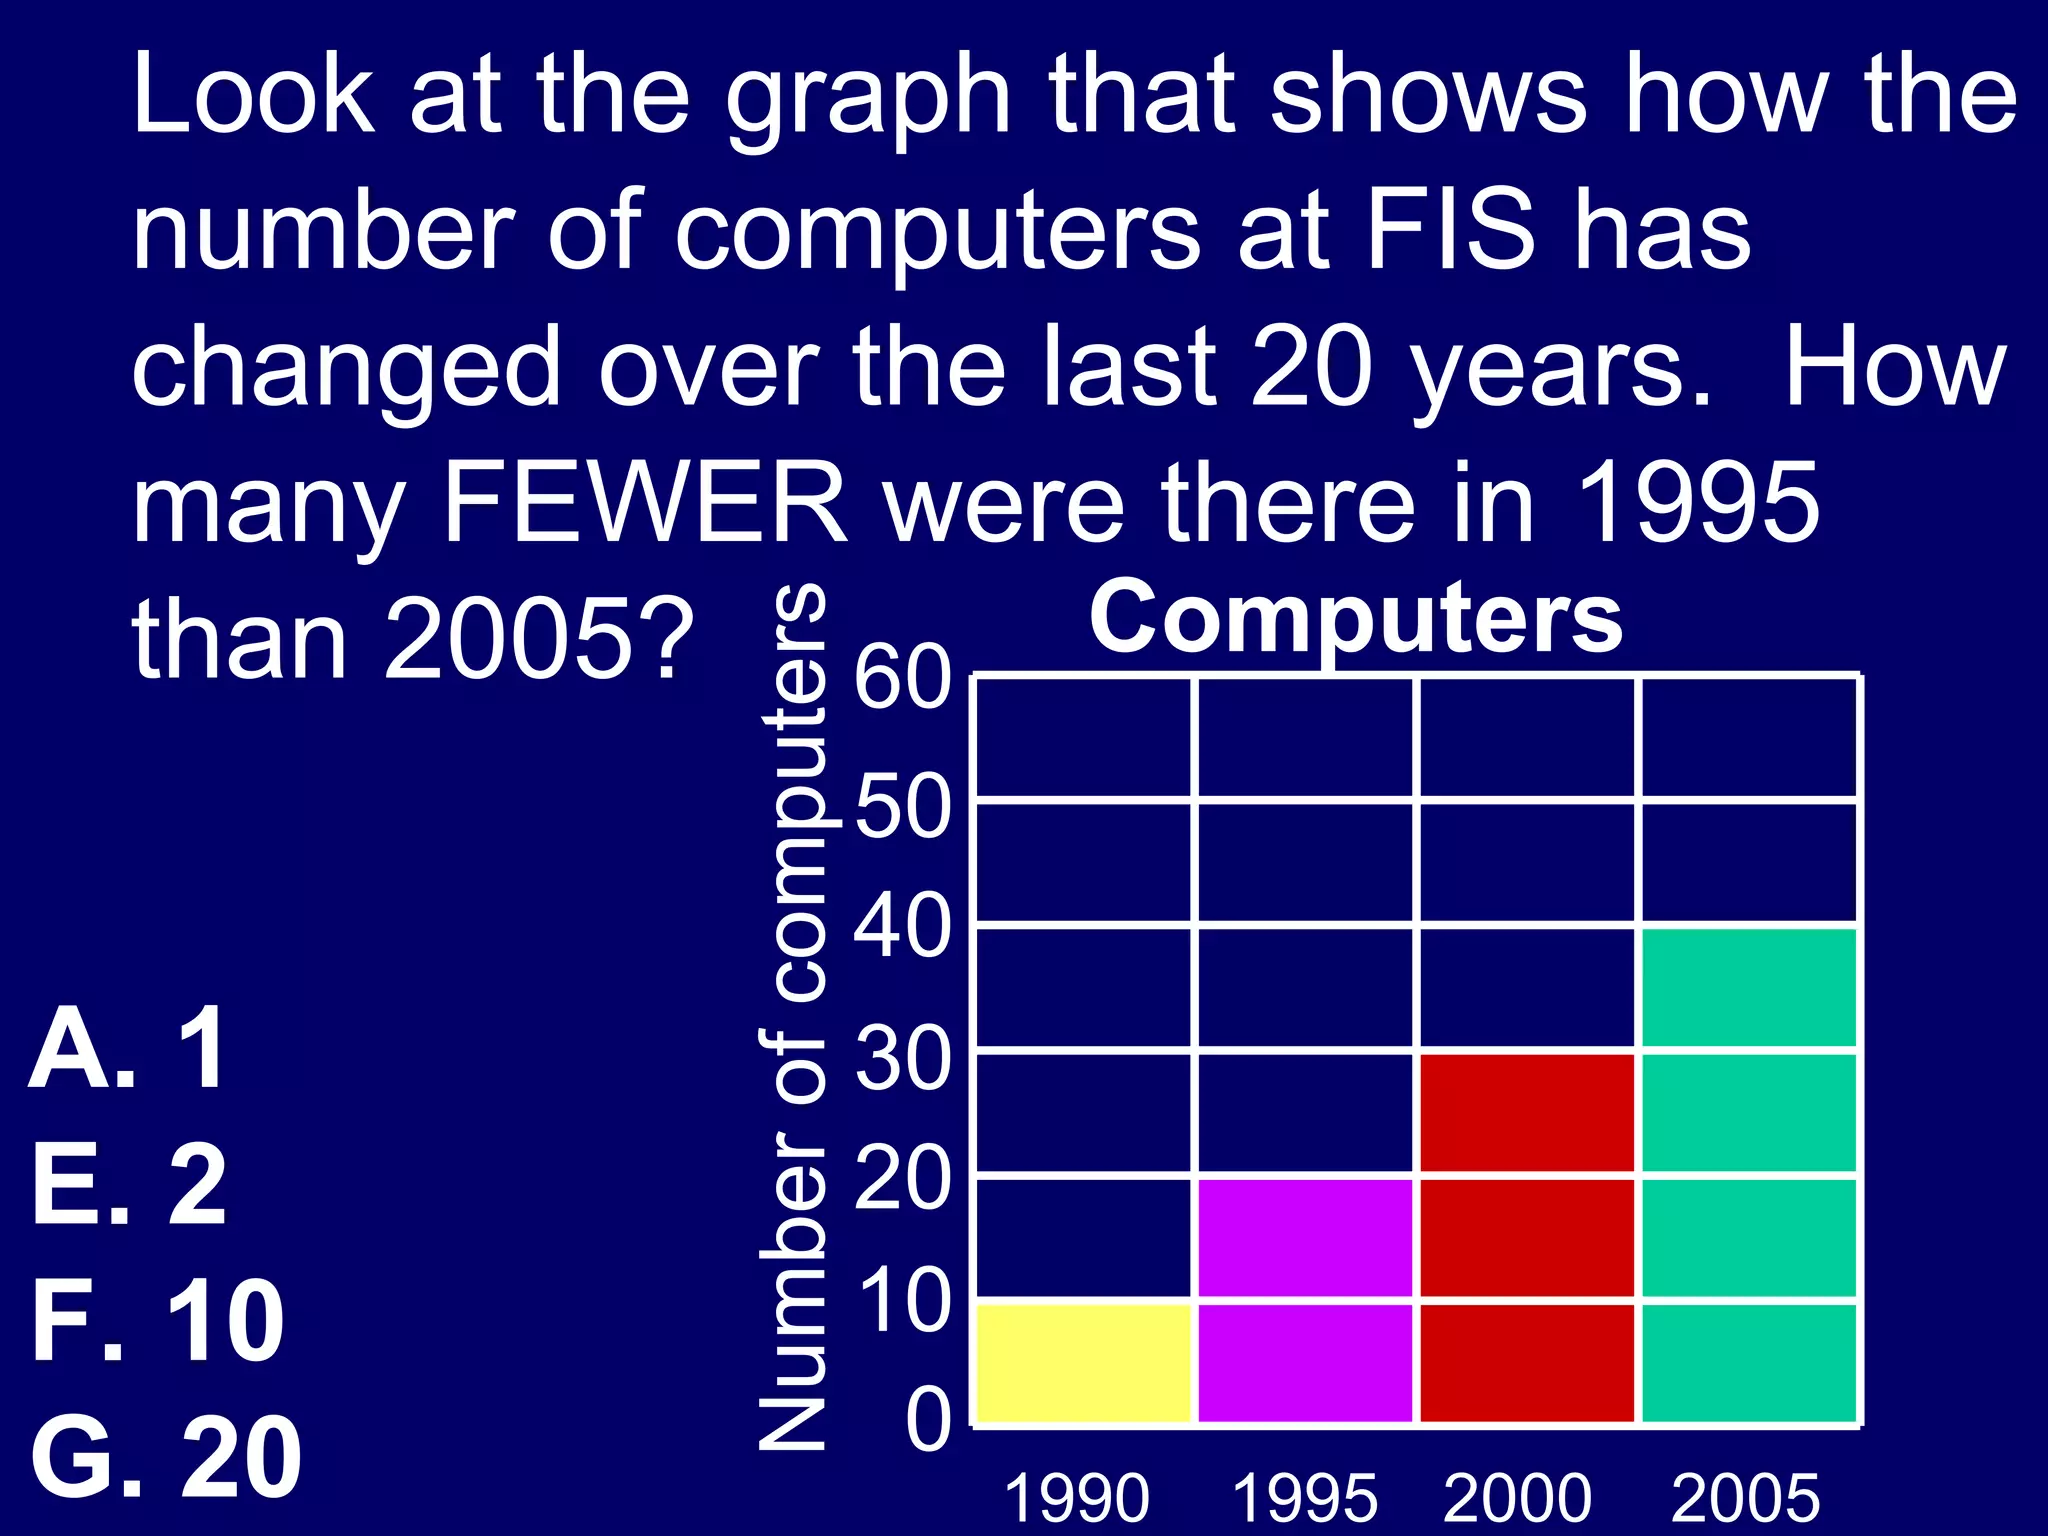
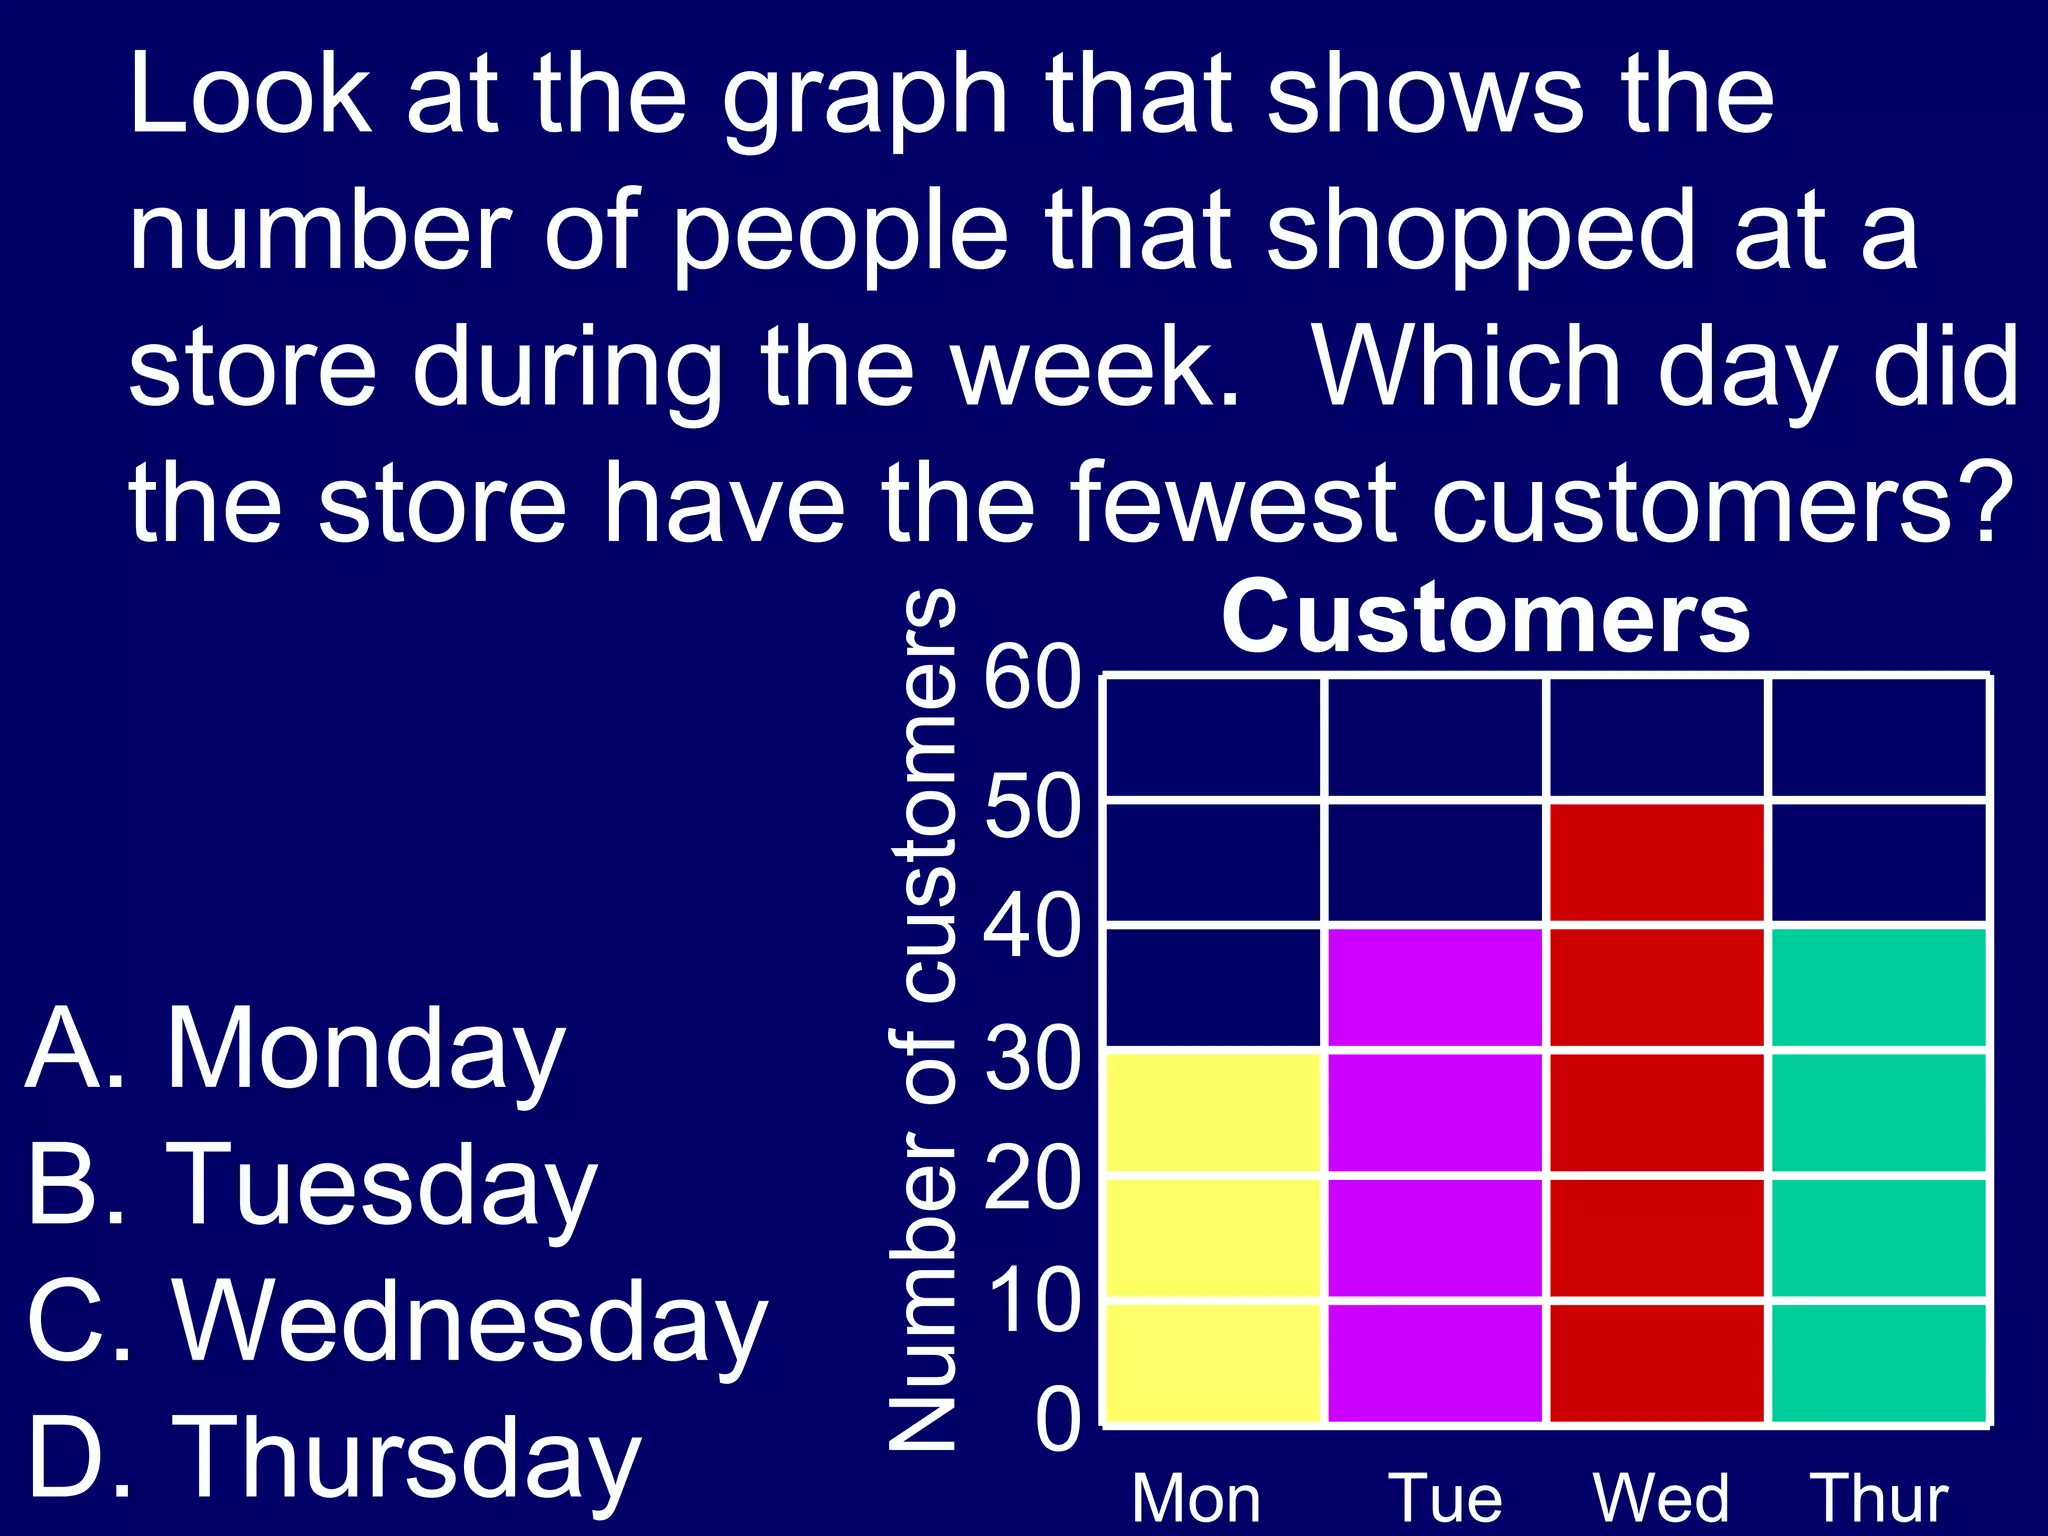
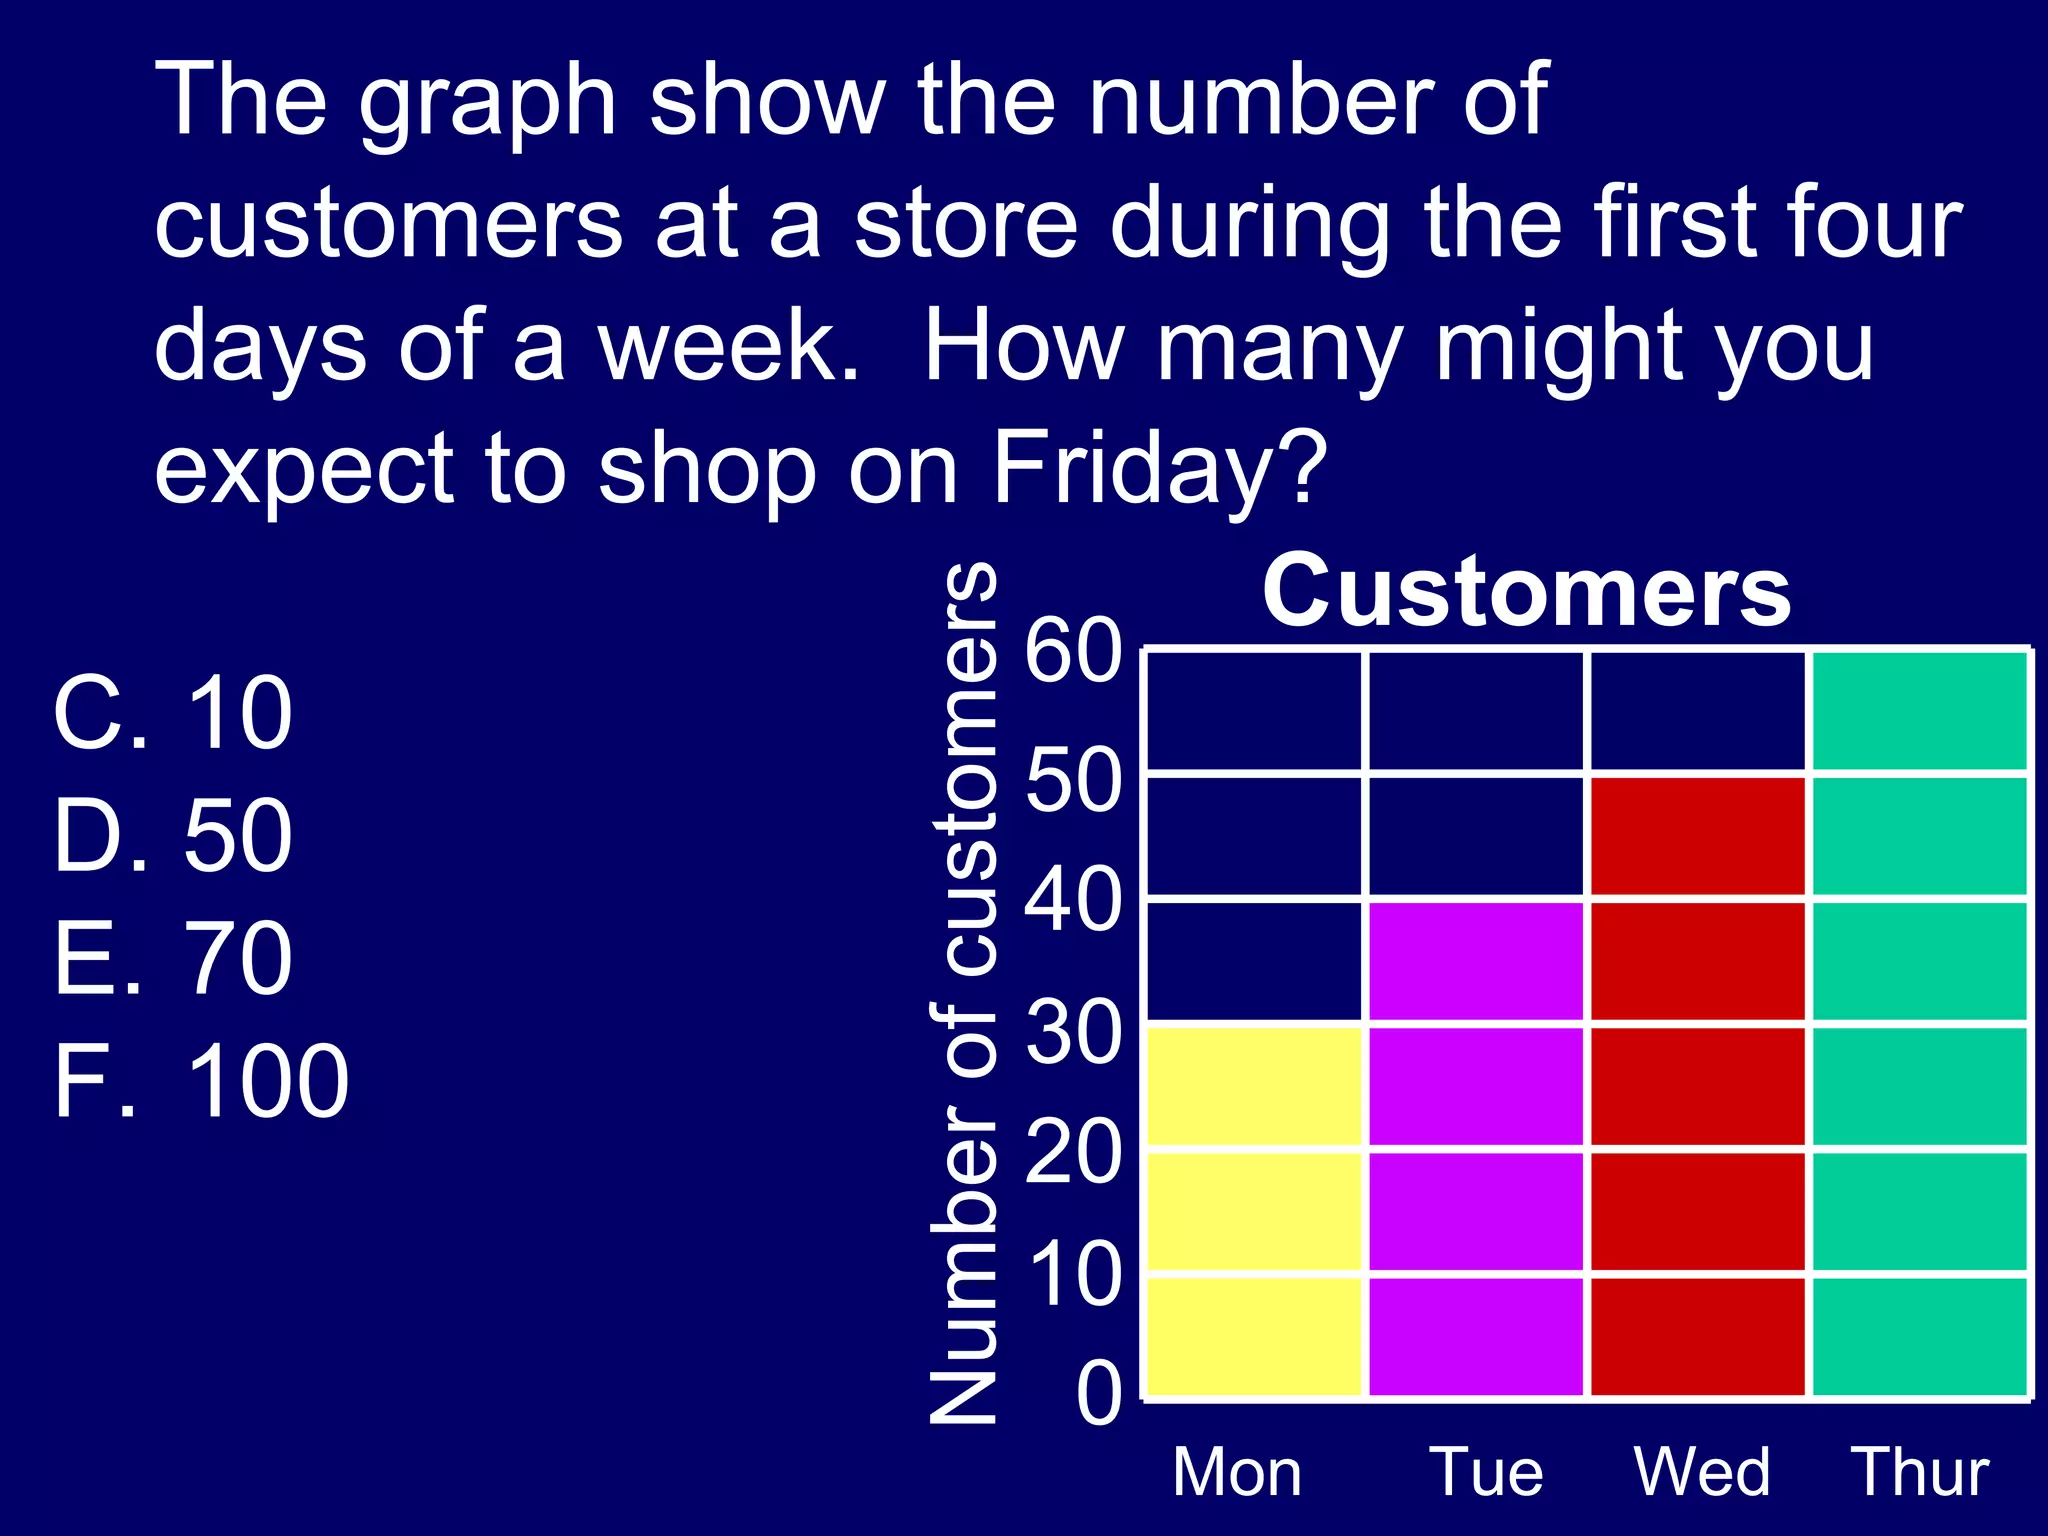
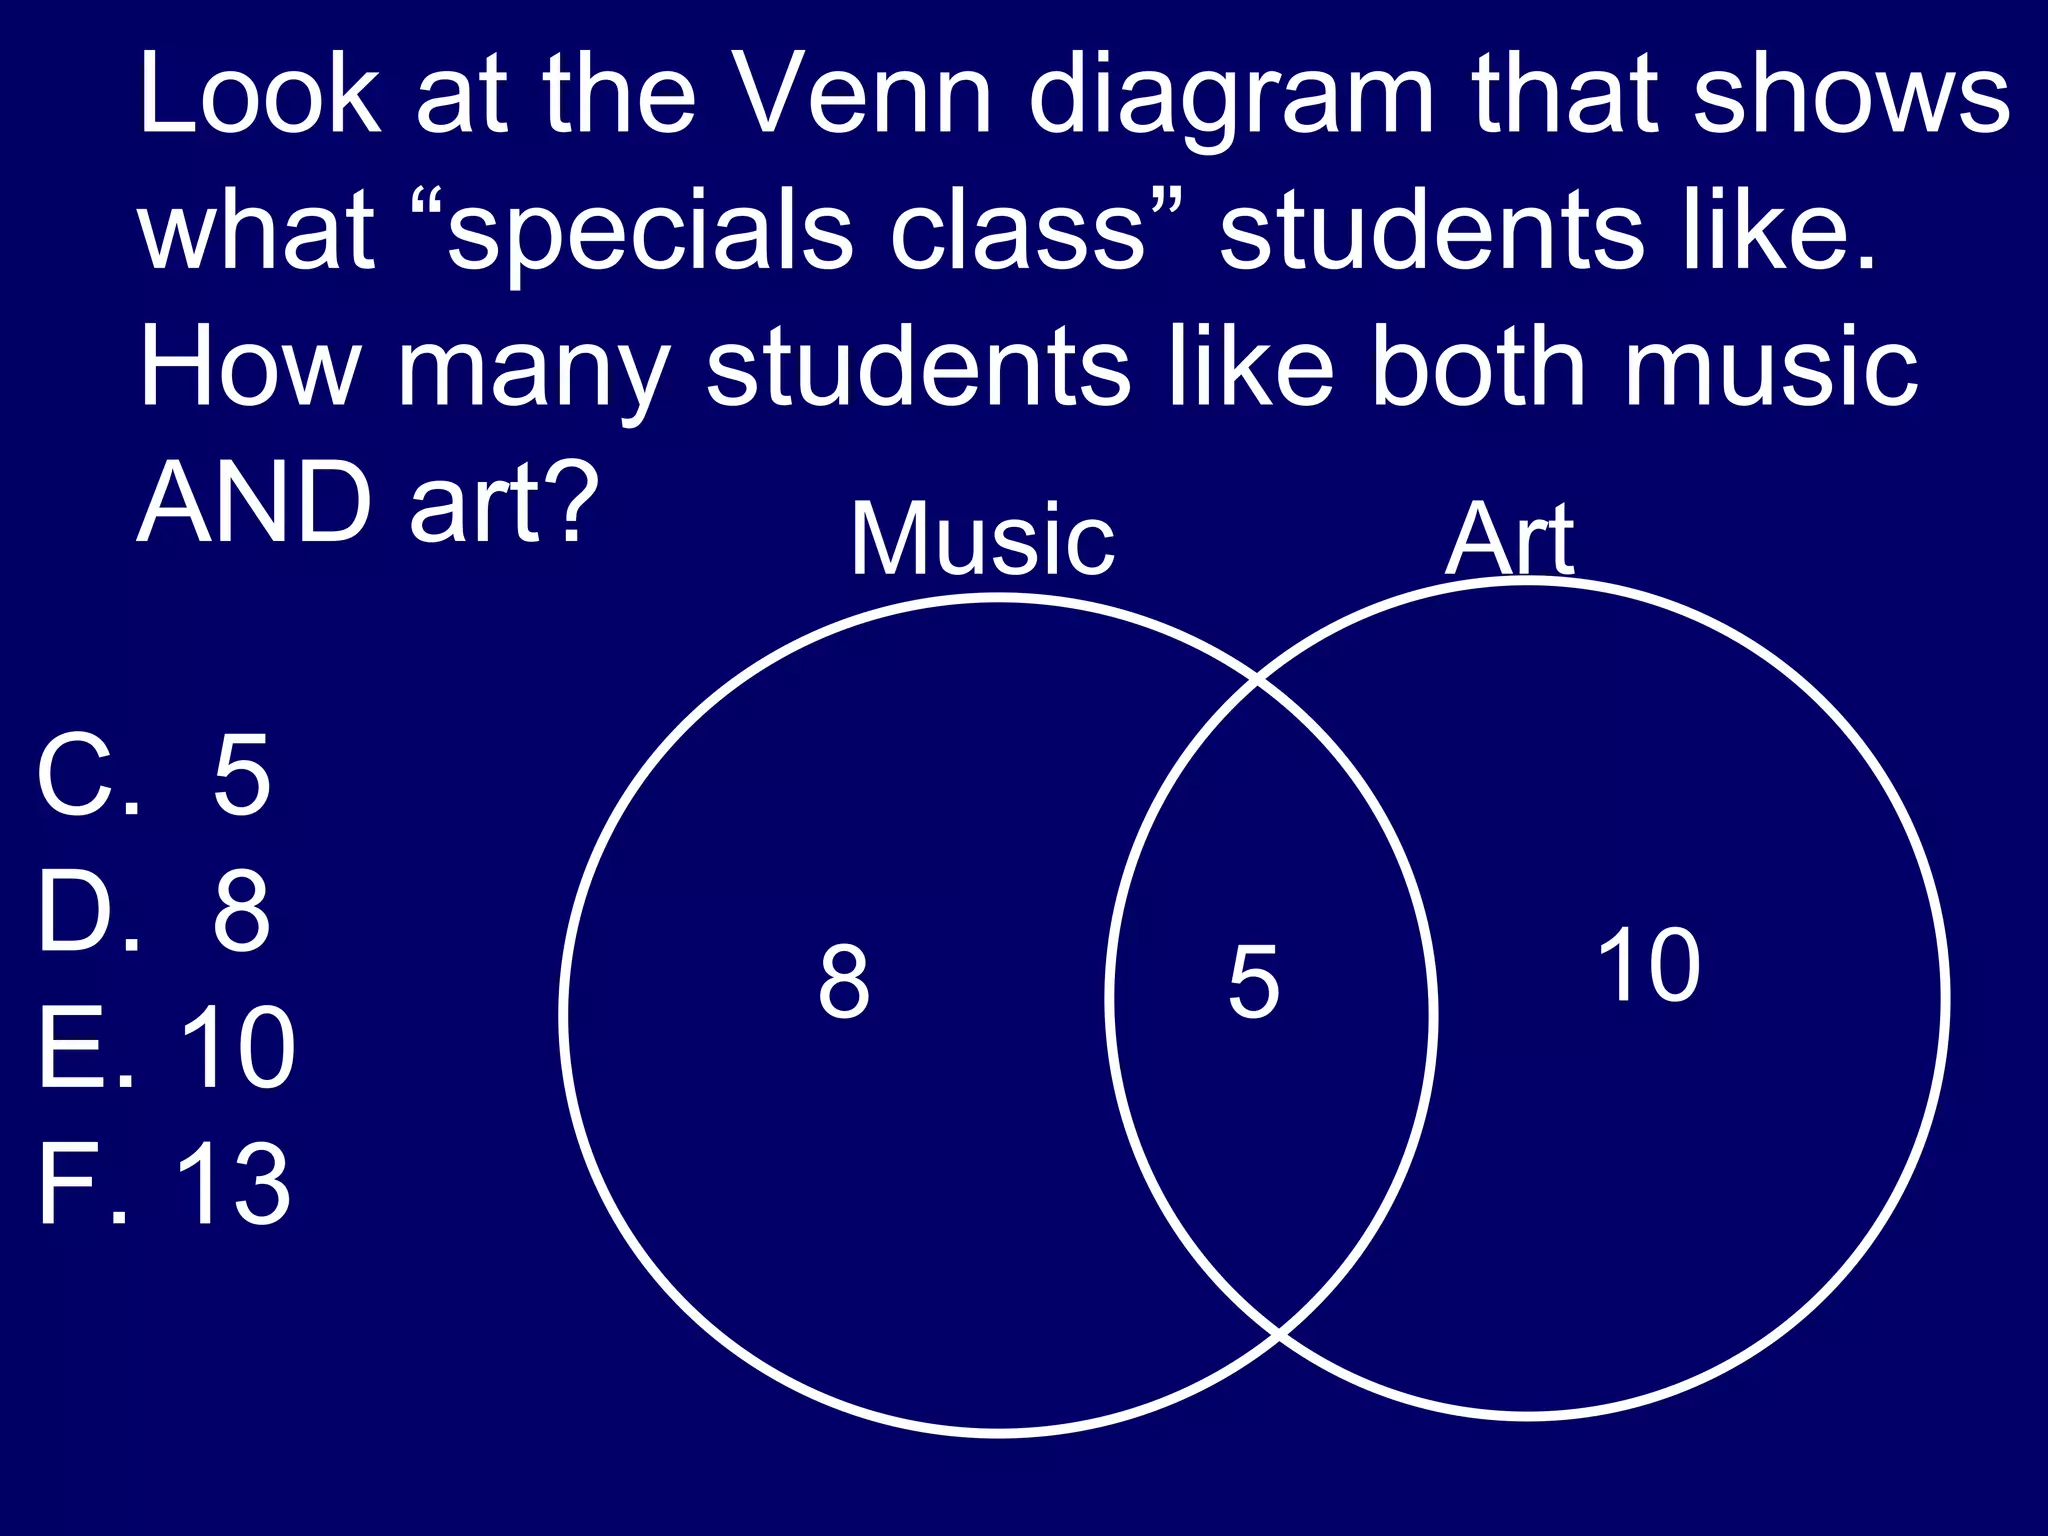
Let’s Play   3 rd   Grade Algebra and Data
 
Patterns
Unknowns
Formulas
Charts and Tables
Graphs
Analyzing Data
20 30 40 50 Patterns Unknowns Formulas Charts and Tables Graphs Analyzing Data 10 20 30 40 50 10 20 30 40 50 10 20 30 40 50 10 20 30 40 50 30 40 50 10 10 20
Final Jeopardy
Final Jeopardy Answer
Students who will succeed on the CRCT
Who are PCES  Third Graders?
Which number is missing from this pattern? 41, 44, 47, ___, 53, 56 50 48 52 51
A.  50
Which figure will be the 10 th  figure in this pattern?
B.
Which number comes next in this pattern? 85, 81, 77, 73, 69, 65, 61, ___ 51 59 60 57
D.  57
Which best describes this pattern? 4, 8, 12, 16, 20, 24, 28, 32 Multiply by 2 to get the next number Add 4 to get the next number Multiply by 3 to get the next number Subtract 4 to get the next number
B.  Add 4 to get the next number
Which best describes this pattern? Add 1 more side to get the next figure Hexagon will be the next figure. Double the number of sides each time There is no pattern.
A.  Add 1 more side to get the next figure
What number goes in the  to make the number sentence TRUE?  4 x  = 32 A. 7 B. 8 C. 9 D. 6
B. 8
What is the missing number? 28  ÷   = 4 A. 5 B. 6 C. 7 D. 8
C.  7
Which number belongs in the  to make the number sentence TRUE ? 35 +  = 24 + 35 A. 0 B. 59 C. 35 D. 24
D. 24
Which number belongs in the  to make the number sentence TRUE? 45 +  = 65 + 35 A. 55 B. 65 C. 75 D. 85
A. 55
What is the missing number? 8 x 3 = 4 x ___ A. 3 7 6 8
C. 6
Look at the rectangle below.  Jim added 2 + 4 + 2 + 4 = 12.  What did he find using this number sentence? A.  The perimeter of the rectangle B.  The area of the rectangle C.  The area of a square D.  The area of a rectangle 4 cm 4 cm 2 cm 2 cm
A.  The perimeter of the rectangle
Look at the square.  Dan added  3 + 3 + 3 + 3 = 12.  What did he find? The area of the square. The perimeter of the square. The area of a rectangle. The area of a triangle. 3 ft. 3 ft. 3 ft. 3 ft.
B.  The perimeter of the square.
Look at the rectangle below.  Pam multiplied 4 x 2 = 8.  Why did she do that? She was finding the area of the rectangle. She was finding the perimeter of the rectangle. She was finding the length of 2 sides. To find perimeter, you multiply the sides. 4 cm 4 cm 2 cm 2 cm
A. She was finding the area of the rectangle.
Al found the perimeter of the square below by adding 5 + 5 + 5 + 5 = 20 cm.  Which would be another way to find the perimeter of the square? 4 + 4 + 4 + 4 + 4 = 20 cm 5 x 5 = 25 square cm 4 x 5 = 20 cm 4 x 4 = 16 square cm 5 cm 5 cm 5 cm 5 cm
C.  4 x 5 = 20 because multiplying by 4 is the same as adding 5 four times
Look at the square below.  Jane multiplied 5 x 5 = 25.  What was she trying to find? A. The perimeter of the square in cm. B. The area of the square in square cm. C. The distance around the square in cm. D. The distance from one side of the square to the other in cm. 5 cm 5 cm 5 cm 5 cm
B.  The area of the square in square cm.
Look at the table about favorite fruits. How many more liked apples best than pears? 1 2 3 4 peaches pears oranges apples
B.  2
Look at the tally chart about favorite fruits.  How many students like pears or peaches? A.  11 B.  1 C.  9 D.  8 peaches pears oranges apples
A.  11
Look at the table of favorite colors. If a bar graph is created, which color will have the tallest bar? A.  Green Orange Blue Red  8 Red 10 Blue 3 Orange 4 Green
C.  Blue
Dan asked some third grade students, “What is your favorite color?” and created this table to show their answers.  How many students did he ask? A.  14 B.  27 C.  71 D.  100 18 Red 27 Blue 12 Orange 14 Green
C. 71
Jan took a survey about favorite sports.  She asked 24 students but forgot to record the number of votes for golf.  What number should be in the chart for golf? 3 B. 2 C. 12 D. 24 12 Softball 7 Soccer 3 Tennis Golf
B.  2
According to the graph.  Which plant grew three inches taller than plant 2? A. Plant 1 B. Plant 2 C. Plant 3 D. Plant 4 Height in inches 6 5 4 3 2 1 0 plant 1  plant 2  plant 3  plant 4 Plant Growth
C.  Plant 3
Look at the graph.  How many students voted for math as their favorite subject? A.  6 B.  8 C. 12  D. 10 Number of students 12 10 8 6 4 2 0 reading  social  science  math    studies Favorite Subject
C.  12
Look at the graph.  How many more students like reading best than social studies? A.  1 B.  2 C.  5 D. 10 Number of students 30 25 20 15 10 5 0 reading  social  science  math    studies Favorite Subject
D.  10
Look at the pictograph of favorite colors.  The key is missing.  If you know that 6 like green best, how many like blue best?   5 9 10 45
B.  9
Which pet do 10 children have? Hamster Dog Cat Fish 12 10 8 6 4 2 0 cat  fish    dog    hamster PETS Number of children
B.  Dog
Look how the number of computers at FIS has changed over the last 20 years.  Predict the number of computers they will have in 2010. A. 40 50 60 0   Computers 60 50 40 30 20 10 0 Number of computers 1990  1995   2000  2005
B. 50
Look at the graph that shows how the number of computers at FIS has changed over the last 20 years.  How many FEWER were there in 1995 than 2005? A. 1 2 10 20 Computers 60 50 40 30 20 10 0 Number of computers 1990  1995   2000  2005
D.  20
Look at the graph that shows the number of people that shopped at a store during the week.  Which day did the store have the fewest customers? A. Monday B. Tuesday C. Wednesday D. Thursday  Customers 60 50 40 30 20 10 0 Number of customers Mon   Tue   Wed  Thur
A.  Monday
The graph show the number of customers at a store during the first four days of a week.  How many might you expect to shop on Friday? 10 50 70 100 Customers 60 50 40 30 20 10 0 Number of customers Mon   Tue   Wed  Thur
C.  70
Look at the Venn diagram that shows what “specials class” students like.  How many students like both music AND art? 5 8 10 13 Music Art 8 5 10
A. 5

Algebra and Data Analysis

  • 1.
  • 2.
    Let’s Play 3 rd Grade Algebra and Data
  • 3.
  • 4.
  • 5.
  • 6.
  • 7.
  • 8.
  • 9.
  • 10.
    20 30 4050 Patterns Unknowns Formulas Charts and Tables Graphs Analyzing Data 10 20 30 40 50 10 20 30 40 50 10 20 30 40 50 10 20 30 40 50 30 40 50 10 10 20
  • 11.
  • 12.
  • 13.
    Students who willsucceed on the CRCT
  • 14.
    Who are PCES Third Graders?
  • 15.
    Which number ismissing from this pattern? 41, 44, 47, ___, 53, 56 50 48 52 51
  • 16.
  • 17.
    Which figure willbe the 10 th figure in this pattern?
  • 18.
  • 19.
    Which number comesnext in this pattern? 85, 81, 77, 73, 69, 65, 61, ___ 51 59 60 57
  • 20.
  • 21.
    Which best describesthis pattern? 4, 8, 12, 16, 20, 24, 28, 32 Multiply by 2 to get the next number Add 4 to get the next number Multiply by 3 to get the next number Subtract 4 to get the next number
  • 22.
    B. Add4 to get the next number
  • 23.
    Which best describesthis pattern? Add 1 more side to get the next figure Hexagon will be the next figure. Double the number of sides each time There is no pattern.
  • 24.
    A. Add1 more side to get the next figure
  • 25.
    What number goesin the to make the number sentence TRUE? 4 x = 32 A. 7 B. 8 C. 9 D. 6
  • 26.
  • 27.
    What is themissing number? 28 ÷ = 4 A. 5 B. 6 C. 7 D. 8
  • 28.
  • 29.
    Which number belongsin the to make the number sentence TRUE ? 35 + = 24 + 35 A. 0 B. 59 C. 35 D. 24
  • 30.
  • 31.
    Which number belongsin the to make the number sentence TRUE? 45 + = 65 + 35 A. 55 B. 65 C. 75 D. 85
  • 32.
  • 33.
    What is themissing number? 8 x 3 = 4 x ___ A. 3 7 6 8
  • 34.
  • 35.
    Look at therectangle below. Jim added 2 + 4 + 2 + 4 = 12. What did he find using this number sentence? A. The perimeter of the rectangle B. The area of the rectangle C. The area of a square D. The area of a rectangle 4 cm 4 cm 2 cm 2 cm
  • 36.
    A. Theperimeter of the rectangle
  • 37.
    Look at thesquare. Dan added 3 + 3 + 3 + 3 = 12. What did he find? The area of the square. The perimeter of the square. The area of a rectangle. The area of a triangle. 3 ft. 3 ft. 3 ft. 3 ft.
  • 38.
    B. Theperimeter of the square.
  • 39.
    Look at therectangle below. Pam multiplied 4 x 2 = 8. Why did she do that? She was finding the area of the rectangle. She was finding the perimeter of the rectangle. She was finding the length of 2 sides. To find perimeter, you multiply the sides. 4 cm 4 cm 2 cm 2 cm
  • 40.
    A. She wasfinding the area of the rectangle.
  • 41.
    Al found theperimeter of the square below by adding 5 + 5 + 5 + 5 = 20 cm. Which would be another way to find the perimeter of the square? 4 + 4 + 4 + 4 + 4 = 20 cm 5 x 5 = 25 square cm 4 x 5 = 20 cm 4 x 4 = 16 square cm 5 cm 5 cm 5 cm 5 cm
  • 42.
    C. 4x 5 = 20 because multiplying by 4 is the same as adding 5 four times
  • 43.
    Look at thesquare below. Jane multiplied 5 x 5 = 25. What was she trying to find? A. The perimeter of the square in cm. B. The area of the square in square cm. C. The distance around the square in cm. D. The distance from one side of the square to the other in cm. 5 cm 5 cm 5 cm 5 cm
  • 44.
    B. Thearea of the square in square cm.
  • 45.
    Look at thetable about favorite fruits. How many more liked apples best than pears? 1 2 3 4 peaches pears oranges apples
  • 46.
  • 47.
    Look at thetally chart about favorite fruits. How many students like pears or peaches? A. 11 B. 1 C. 9 D. 8 peaches pears oranges apples
  • 48.
  • 49.
    Look at thetable of favorite colors. If a bar graph is created, which color will have the tallest bar? A. Green Orange Blue Red 8 Red 10 Blue 3 Orange 4 Green
  • 50.
  • 51.
    Dan asked somethird grade students, “What is your favorite color?” and created this table to show their answers. How many students did he ask? A. 14 B. 27 C. 71 D. 100 18 Red 27 Blue 12 Orange 14 Green
  • 52.
  • 53.
    Jan took asurvey about favorite sports. She asked 24 students but forgot to record the number of votes for golf. What number should be in the chart for golf? 3 B. 2 C. 12 D. 24 12 Softball 7 Soccer 3 Tennis Golf
  • 54.
  • 55.
    According to thegraph. Which plant grew three inches taller than plant 2? A. Plant 1 B. Plant 2 C. Plant 3 D. Plant 4 Height in inches 6 5 4 3 2 1 0 plant 1 plant 2 plant 3 plant 4 Plant Growth
  • 56.
  • 57.
    Look at thegraph. How many students voted for math as their favorite subject? A. 6 B. 8 C. 12 D. 10 Number of students 12 10 8 6 4 2 0 reading social science math studies Favorite Subject
  • 58.
  • 59.
    Look at thegraph. How many more students like reading best than social studies? A. 1 B. 2 C. 5 D. 10 Number of students 30 25 20 15 10 5 0 reading social science math studies Favorite Subject
  • 60.
  • 61.
    Look at thepictograph of favorite colors. The key is missing. If you know that 6 like green best, how many like blue best? 5 9 10 45
  • 62.
  • 63.
    Which pet do10 children have? Hamster Dog Cat Fish 12 10 8 6 4 2 0 cat fish dog hamster PETS Number of children
  • 64.
  • 65.
    Look how thenumber of computers at FIS has changed over the last 20 years. Predict the number of computers they will have in 2010. A. 40 50 60 0 Computers 60 50 40 30 20 10 0 Number of computers 1990 1995 2000 2005
  • 66.
  • 67.
    Look at thegraph that shows how the number of computers at FIS has changed over the last 20 years. How many FEWER were there in 1995 than 2005? A. 1 2 10 20 Computers 60 50 40 30 20 10 0 Number of computers 1990 1995 2000 2005
  • 68.
  • 69.
    Look at thegraph that shows the number of people that shopped at a store during the week. Which day did the store have the fewest customers? A. Monday B. Tuesday C. Wednesday D. Thursday Customers 60 50 40 30 20 10 0 Number of customers Mon Tue Wed Thur
  • 70.
  • 71.
    The graph showthe number of customers at a store during the first four days of a week. How many might you expect to shop on Friday? 10 50 70 100 Customers 60 50 40 30 20 10 0 Number of customers Mon Tue Wed Thur
  • 72.
  • 73.
    Look at theVenn diagram that shows what “specials class” students like. How many students like both music AND art? 5 8 10 13 Music Art 8 5 10
  • 74.