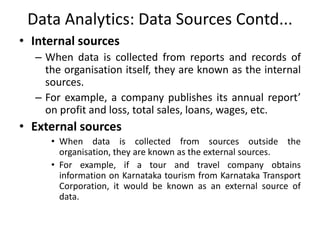
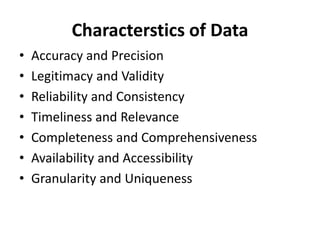
SlideShare a Scribd company logo
1 of 71
Data Analytics
Dr. Vijay Kumar Dwivedi
Associate Professor, UCER
Data Analytics: Data Sources
• Data collection is the process of acquiring,
collecting, extracting, and storing the voluminous
amount of data which may be in the structured or
unstructured form like text, video, audio, XML
files, records, or other image files used in later
stages of data analysis.
• Relational
• Multidimensional (OLAP)
• Dimensionally modeled relational
Data Analytics: Data Sources Contd...
• Internal sources
– When data is collected from reports and records of
the organisation itself, they are known as the internal
sources.
– For example, a company publishes its annual report’
on profit and loss, total sales, loans, wages, etc.
• External sources
• When data is collected from sources outside the
organisation, they are known as the external sources.
• For example, if a tour and travel company obtains
information on Karnataka tourism from Karnataka Transport
Corporation, it would be known as an external source of
data.
Data Growth Over the Years(2010-2025)
Types of Data
• Primary
– The data which is Raw, original, and extracted directly from
the official sources is known as primary data.
– This type of data is collected directly by performing
techniques such as questionnaires, interviews, and
surveys.
– The data collected must be according to the demand and
requirements of the target audience on which analysis is
performed otherwise it would be a burden in the data
processing.
• Secondary
– Secondary data is the data which has already been
collected and reused again for some valid purpose. This
type of data is previously recorded from primary data and
it has two types of sources named internal source and
external source.
Data Collection Sources
Types of Data Collection: Primary Data
• Interview Method
• Survey Method
• Observation Method
• Experimental Method
Primary Data Collection: Interview Method
• The data collected during this process is through
interviewing the target audience by a person
called interviewer and the person who answers
the interview is known as the interviewee.
• Some basic business or product related questions
are asked and noted down in the form of notes,
audio, or video and this data is stored for
processing.
• These can be both structured and unstructured
like personal interviews or formal interviews
through telephone, face to face, email, etc.
Primary Data Collection: Survey Method
• The survey method is the process of research
where a list of relevant questions are asked and
answers are noted down in the form of text,
audio, or video.
• The survey method can be obtained in both
online and offline mode like through website
forms and email.
• Then that survey answers are stored for analyzing
data.
• Examples are online surveys or surveys through
social media polls.
Primary Data Collection: Observation Method
• The observation method is a method of data
collection in which the researcher keenly
observes the behavior and practices of the target
audience using some data collecting tool and
stores the observed data in the form of text,
audio, video, or any raw formats.
• In this method, the data is collected directly by
posting a few questions on the participants.
• For example, observing a group of customers and
their behavior towards the products. The data
obtained will be sent for processing.
Primary Data Collection: Experimental Method
• The experimental method is the process of
collecting data through performing
experiments, research, and investigation.
• The most frequently used experiment
methods are:
– CRD- Completely Randomized Design
– RBD- Randomized Block Design
– LSD – Latin Square Design
– FD- Factorial Design
Types of Experimental Methods
• CRD- Completely Randomized design
– A simple experimental design used in data analytics
which is based on randomization and replication.
– It is mostly used for comparing the experiments.
• RBD- Randomized Block Design
– An experimental design in which the experiment is
divided into small units called blocks.
– Random experiments are performed on each of the
blocks and results are drawn using a technique known
as analysis of variance (ANOVA). RBD was originated
from the agriculture sector.
Types of Experimental Methods
• LSD – Latin Square Design
– An experimental design that is similar to CRD and RBD
blocks but contains rows and columns.
– It is an arrangement of NxN squares with an equal
amount of rows and columns which contain letters
that occurs only once in a row.
– Hence the differences can be easily found with fewer
errors in the experiment.
– Sudoku puzzle is an example of a Latin square design.
• FD- Factorial design:
– An experimental design where each experiment has
two factors each with possible values and on
performing trail other combinational factors are
derived.
Secondary Data: Sources
• Internal source:
– These types of data can easily be found within the
organization such as market record, a sales record,
transactions, customer data, accounting resources, etc.
– The cost and time consumption is less in obtaining internal
sources
• External source:
– The data which can’t be found at internal organizations
and can be gained through external third party resources is
external source data.
– The cost and time consumption is more because this
contains a huge amount of data.
– Examples of external sources are Government
publications, news publications, Registrar General of India,
planning commission, international labor bureau,
syndicate services, and other non-governmental
publications.
Secondary Data: Sources Contd...
• Other sources:
– Sensors data: With the advancement of IoT devices, the
sensors of these devices collect data which can be used for
sensor data analytics to track the performance and usage
of products.
– Satellites data: Satellites collect a lot of images and data in
terabytes on daily basis through surveillance cameras
which can be used to collect useful information.
– Web traffic: Due to fast and cheap internet facilities many
formats of data which is uploaded by users on different
platforms can be predicted and collected with their
permission for data analysis.
– The search engines also provide their data through
keywords and queries searched mostly.
Classification of data (structured, semi-structured,
unstructured)
• Structured Data
Classification of data (Structured, Semi-
Structured, Unstructured) Contd...
• Semi-structured data is information that does not
reside in a relational database but that have
some organizational properties that make it
easier to analyze.
• With some process, you can store them in the
relation database (it could be very hard for some
kind of semi-structured data), but Semi-
structured exist to ease space. Example: XML
data.
Classification of data (Structured, Semi-
Structured, Unstructured) Contd...
• Unstructured Data
Differences between Structured, Semi-
structured and Unstructured data
Differences between Structured, Semi-
structured and Unstructured data Contd...
Characterstics of Data
• Accuracy and Precision
• Legitimacy and Validity
• Reliability and Consistency
• Timeliness and Relevance
• Completeness and Comprehensiveness
• Availability and Accessibility
• Granularity and Uniqueness
Characteristics of Data: Accuracy and Precision
• This characteristic refers to the exactness of the data.
• It cannot have any erroneous elements and must
convey the correct message without being misleading.
• This accuracy and precision have a component that
relates to its intended use.
• Without understanding how the data will be
consumed, ensuring accuracy and precision could be
off-target or more costly than necessary.
• For example, accuracy in healthcare might be more
important than in another industry (which is to say,
inaccurate data in healthcare could have more serious
consequences) and, therefore, justifiably worth higher
levels of investment.
Characteristics of Data: Legitimacy and Validity
• Requirements governing data set the boundaries of
this characteristic.
• For example, on surveys, items such as gender,
ethnicity, and nationality are typically limited to a set
of options and open answers are not permitted.
• Any answers other than these would not be considered
valid or legitimate based on the survey’s requirement.
• This is the case for most data and must be carefully
considered when determining its quality.
• The people in each department in an organization
understand what data is valid or not to them, so the
requirements must be leveraged when evaluating data
quality.
Characteristics of Data: Reliability and Consistency
• Many systems in today’s environments use
and/or collect the same source data.
• Regardless of what source collected the data
or where it resides, it cannot contradict a
value residing in a different source or
collected by a different system.
• There must be a stable and steady mechanism
that collects and stores the data without
contradiction or unwarranted variance.
Characteristics of Data: Timeliness and Relevance
• There must be a valid reason to collect the
data to justify the effort required, which also
means it has to be collected at the right
moment in time.
• Data collected too soon or too late could
misrepresent a situation and drive inaccurate
decisions.
Characteristics of Data: Completeness and Comprehensiveness
• Incomplete data is as dangerous as inaccurate
data.
• Gaps in data collection lead to a partial view of
the overall picture to be displayed.
• Without a complete picture of how operations
are running, uninformed actions will occur.
• It’s important to understand the complete set of
requirements that constitute a comprehensive
set of data to determine whether or not the
requirements are being fulfilled.
Characteristics of Data: Availability and Accessibility
• This characteristic can be tricky at times due
to legal and regulatory constraints.
• Regardless of the challenge, though,
individuals need the right level of access to
the data in order to perform their jobs.
• This presumes that the data exists and is
available for access to be granted.
Characteristics of Data: Granularity and Uniqueness
• The level of detail at which data is collected is
important, because confusion and inaccurate
decisions can otherwise occur.
• Aggregated, summarized and manipulated
collections of data could offer a different meaning
than the data implied at a lower level.
• An appropriate level of granularity must be
defined to provide sufficient uniqueness and
distinctive properties to become visible.
• This is a requirement for operations to function
effectively
Data: Measurement Size
Introduction to Big Data Platform
• Big Data is a collection of data that is huge in
volume, yet growing exponentially with time.
• It is a data with so large size and complexity
that none of traditional data management
tools can store it or process it efficiently.
• Big data is also a data but with huge size.
Big Data: Examples
• 1.7MB of data is created every second by every person
during 2020.
• In the last two years alone, the astonishing 90% of the
world’s data has been created.
• 2.5 quintillion bytes of data are produced by humans
every day.
• 463 exabytes of data will be generated each day by
humans as of 2025
• 95 million photos and videos are shared every day on
Instagram.
• By the end of 2020, 44 zettabytes will make up the
entire digital universe.
• Every day, 306.4 billion emails are sent, and 5 million
Tweets are made.
Big Data: Characteristics
• Volume : the size and amounts of big data that companies
manage and analyze
• Variety : the diversity and range of different data types,
including unstructured data, semi-structured data and raw
data
• Velocity: the speed at which companies receive, store and
manage data – e.g., the specific number of social media
posts or search queries received within a day, hour or other
unit of time
• Veracity: the “truth” or accuracy of data and information
assets, which often determines executive-level confidence
• Value: the value of big data usually comes from insight
discovery and pattern recognition that lead to more
effective operations, stronger customer relationships and
other clear and quantifiable business benefits
What Is Data Analytics?
• Data analytics is the science of analyzing raw
data in order to make conclusions about that
information.
• Data analytics techniques can reveal trends
and metrics that would otherwise be lost in
the mass of information
• This information can then be used to optimize
processes to increase the overall efficiency of
a business or system.
Data Analytics Process: Steps
• To determine the data requirements or how
the data is grouped. Data may be separated by
age, demographic, income, or gender. Data
values may be numerical or be divided by
category.
• Process of collecting data. This can be done
through a variety of sources such as
computers, online sources, cameras,
environmental sources, or through personnel.
Data Analytics Process: Steps Contd...
• Data must be organized so it can be analyzed.
Organization may take place on a spreadsheet or
other form of software that can take statistical
data.
• Data is then cleaned up before analysis. This
means it is scrubbed and checked to ensure there
is no duplication or error, and that it is not
incomplete. This step helps correct any errors
before it goes on to a data analyst to be analyzed.
Why Data Analytics Matters?
• It helps businesses optimize their performances.
• Implementing it into the business model means
companies can help reduce costs by identifying
more efficient ways of doing business and by
storing large amounts of data.
• A company can also use data analytics to make
better business decisions and help analyze
customer trends and satisfaction, which can lead
to new—and better—products and services.
Traditional Data Analytics Architecture
Modern Database Architecture
MASSIVELY PARALLEL PROCESSING SYSTEMS (MPP)
• An MPP database spreads data out into independent
pieces managed by independent storage and central
processing unit (CPU) resources.
• Conceptually, it is like having pieces of data loaded
onto multiple network connected personal computers
around a house.
• It removes the constraints of having one central server
with only a single set CPU and disk to manage it.
• The data in an MPP system gets split across a variety of
disks managed by a variety of CPUs spread across a
number of servers.
MASSIVELY PARALLEL PROCESSING SYSTEMS
(MPP) Contd...
Cloud Computing
• Enterprises incur no infrastructure or capital costs, only
operational costs.
• Those operational costs will be incurred on a pay - per - use
basis with no contractual obligations.
• Capacity can be scaled up or down dynamically, and
immediately.
• This differentiates clouds from traditional hosting service
providers where there may have been limits placed on
scaling.
• The underlying hardware can be anywhere geographically.
• The architectural specifics are abstracted from the user.
• In addition, the hardware will run in multi - tenancy mode
where multiple users from multiple organizations can be
accessing the exact same infrastructure simultaneously.
Grid Computing
• Grid computing also helps organizations balance
workloads, prioritize jobs, and offer high
availability for analytic processing
• A grid configuration can help both cost and
performance.
• It falls into the classification of “high
performance computing. ”
• Instead of having a single high - end server (or
maybe a few of them), a large number of lower -
cost machines are put in place.
Grid Computing Contd...
• As opposed to having one server managing its
CPU and resources across jobs, jobs are parcelled
out individually to the different machines to be
processed in parallel.
• Each machine may only be able to handle a
fraction of the work of the original server and can
potentially handle only one job at a time.
• In aggregate, however, the grid can handle quite
a bit.
• Grids can therefore be a cost effective mechanism
to improve overall throughput and capacity.
Map Reduce
• MapReduce is a parallel programming
framework.
• It’ s neither a database nor a direct competitor
to databases.
• MapReduce is complementary to existing
technologies.
Map Reduce Contd...
Data Analytic Process and Tools
Best Analytic Processes and Big Data Tools
• R-Programming
– R is a free open source software programming
language and a software environment for statistical
computing and graphics. It is used by data miners for
developing statistical software and data analysis. It
has become a highly popular tool for big data in
recent years.
• Datawrapper
– It is an online data visualization tool for making
interactive charts.
– It can be embedded into any other website as well.
– It is easy to use and produces visually effective charts.
Best Analytic Processes and Big Data Tools Contd...
• Tableau Public
– Another popular big data tool.
– It is simple and very intuitive to use.
– It communicates the insights of the data through
data visualisation.
– Through Tableau, an analyst can check a
hypothesis and explore the data before starting to
work on it extensively.
Best Analytic Processes and Big Data Tools Contd...
• Content Grabber
– A data extraction tool.
– It is suitable for people with advanced
programming skills.
– It is a web crawling software.
– Business organizations can use it to extract
content and save it in a structured format.
– It offers editing and debugging facility among
many others for analysis later.
Analysis vs Reporting
• Analytics” means raw data analysis.
• Typical analytics requests usually imply a
once-off data investigation., whereas,
“Reporting” means data to inform decisions.
• Typical reporting requests usually imply
repeatable access to the information, which
could be monthly, weekly, daily, or even real-
time.
Steps involved in Analysis& Reporting
Analysis Reporting
Create Data Hypothesis Understand Business
Requirement
Gather and Manipulate
Data
Connect and Gather
the Data
Present Results to the
Business
Understand the Data
Backgrounds by
Different Dimensions
Re-iterate Re-work the Data
Modern Data Analytics Tools
• R Programming
• Tableau
• Python
– An object-oriented scripting language which is easy to read,
write, maintain and is a free open source tool.
– Supports both functional and structured programming methods.
– Easy to learn as it is very similar to JavaScript, Ruby, and PHP.
– It has rich set of machine learning libraries viz. Scikitlearn,
Theano, Tensorflow and Keras.
– Can be assembled on any platform like SQL server, a MongoDB
database or JSON.
– Can also handle text data very well.
Modern Data Analytics Tools Contd...
• SAS:
– A programming environment and language for data
manipulation and a leader in analytics, developed by
the SAS Institute in 1966 and further developed in
1980’s and 1990’s.
– Easily accessible, manageable and can analyze data
from any sources.
– Introduced a large set of products in 2011 for
customer intelligence and numerous SAS modules for
web, social media and marketing analytics that is
widely used for profiling customers and prospects.
– Can also predict their behaviours, manage, and
optimize communications.
Modern Data Analytics Tools Contd...
• Apache Spark
– A fast large-scale data processing engine and executes
applications in Hadoop clusters 100 times faster in
memory and 10 times faster on disk.
– Built on data science and its concept makes data
science effortless.
– Also popular for data pipelines and machine learning
models development.
– Also includes a library – MLlib, that provides a
progressive set of machine algorithms for repetitive
data science techniques like Classification, Regression,
Collaborative Filtering, Clustering, etc.
Modern Data Analytics Tools Contd...
• Excel
– A basic, popular and widely used analytical tool almost in all
industries
– Analyzes the complex task that summarizes the data with a
preview of pivot tables that helps in filtering the data as per
client requirement.
– It has the advance business analytics option which helps in
modelling capabilities
• RapidMiner:
– A powerful integrated data science platform developed by the
same company that performs predictive analysis and other
advanced analytics like data mining, text analytics, machine
learning and visual analytics without any programming.
– Can incorporate with any data source types, including Access,
Excel, Microsoft SQL, Tera data, Oracle, Sybase, IBM DB2, Ingres,
MySQL, IBM SPSS, Dbase etc.
– Can generate analytics based on real-life data transformation
settings.
Application of Data Analytics
• Security
• Transportation
• Risk Detection
• Risk Management
• Delivery
• Fast Internet Allocation
• Reasonable Expenditure
• Interaction with Customers
• Planning of Cities
• Health Care
Data Analytics Life Cycle: Need
• Data analytics is important because it helps
businesses optimize their performances.
• A company can also use data analytics to
make better business decisions and help
analyze customer trends and satisfaction,
which can lead to new—and better—products
and services
Key Roles for Successful Project: Business User
• The business user is the one who understands
the main area of the project and is also basically
benefited from the results.
• This user gives advice and consult the team
working on the project about the value of the
results obtained and how the operations on the
outputs are done.
• The business manager, line manager, or deep
subject matter expert in the project mains fulfills
this role.
Key Roles for Successful Project: Project Sponsor
• The Project Sponsor is the one who is responsible
to initiate the project.
• Project Sponsor provides the actual requirements
for the project and presents the basic business
issue.
• Generally provides the funds and measures the
degree of value from the final output of the team
working on the project.
• Introduces the prime concern and grooms the
desired output.
Key Roles for Successful Project
• Project Manager
– Ensures that key milestone and purpose of the project is met on
time and of the expected quality.
• Business Intelligence Analyst
– Provides business domain perfection based on a detailed and
deep understanding of the data, key performance indicators
(KPIs), key matrix, and business intelligence from a reporting
point of view.
– Generally creates fascia and reports and knows about the data
feeds and sources.
• Database Administrator (DBA) :
– DBA facilitates and arrange the database environment to
support the analytics need of the team working on a project
Key Roles for Successful Project
• Data Engineer :
– Data engineer grasps deep technical skills to assist with
tuning SQL queries for data management and data
extraction and provides support for data intake into the
analytic sandbox.
– The data engineer works jointly with the data scientist to
help build data in correct ways for analysis.
• Data Scientist :
– Facilitates with the subject matter expertise for analytical
techniques, data modelling, and applying correct analytical
techniques for a given business issues.
– Ensures overall analytical objectives are met.
– Outline and apply analytical methods and proceed towards
the data available for the concerned project.
Data Analytics Life Cycle: Phases
• Discovery
• Data Preparation
• Model Planning
• Model Building
• Communication Results
• Operationalize
Data Analytic Life Cycle: Discovery
• The data science team learn and investigate
the problem.
• Develop context and understanding.
• Come to know about data sources needed and
available for the project.
• The team formulates initial hypothesis that
can be later tested with data.
Data Analytic Life Cycle: Data Preparation
• Steps to explore, preprocess, and condition data
prior to modeling and analysis.
• It requires the presence of an analytic sandbox,
the team execute, load, and transform, to get
data into the sandbox.
• Data preparation tasks are likely to be performed
multiple times and not in predefined order.
• Several tools commonly used for this phase are –
Hadoop, Alpine Miner, Open Refine, etc.
Data Analytic Life Cycle: Model Planning
• Team explores data to learn about relationships
between variables and subsequently, selects key
variables and the most suitable models.
• In this phase, data science team develop data
sets for training, testing, and production
purposes.
• Team builds and executes models based on the
work done in the model planning phase.
• Several tools commonly used for this phase are –
Matlab, STASTICA.
Data Analytic Life Cycle: Model Building
• Team develops datasets for testing, training,
and production purposes.
• Team also considers whether its existing tools
will suffice for running the models or if they
need more robust environment for executing
models.
• Free or open-source tools – Rand PL/R,
Octave, WEKA.
• Commercial tools – Matlab , STASTICA.
Data Analytic Life Cycle: Communication Results
• After executing model team need to compare
outcomes of modeling to criteria established for
success and failure.
• Team considers how best to articulate findings
and outcomes to various team members and
stakeholders, taking into account warning,
assumptions.
• Team should identify key findings, quantify
business value, and develop narrative to
summarize and convey findings to stakeholders.
Data Analytic Life Cycle: Operationalize
• The team communicates benefits of project more
broadly and sets up pilot project to deploy work
in controlled way before broadening the work to
full enterprise of users.
• This approach enables team to learn about
performance and related constraints of the
model in production environment on small scale
and make adjustments before full deployment.
• The team delivers final reports, briefings, codes.
End of Unit 1

More Related Content

Similar to Data Analytics-Unit 1 , this Is ppt for student help

Methods of data collection
Methods of data collectionMethods of data collection
Methods of data collectionChintan Trivedi
 
Bmgt 311 chapter_5
Bmgt 311 chapter_5Bmgt 311 chapter_5
Bmgt 311 chapter_5Chris Lovett
 
Statistics for business decisions
Statistics for business decisionsStatistics for business decisions
Statistics for business decisionsYeshwanth Gowda
 
Introducition to Data scinece compiled by hu
Introducition to Data scinece compiled by huIntroducition to Data scinece compiled by hu
Introducition to Data scinece compiled by huwekineheshete
 
Introduction to Business and Data Analysis Undergraduate.pdf
Introduction to Business and Data Analysis Undergraduate.pdfIntroduction to Business and Data Analysis Undergraduate.pdf
Introduction to Business and Data Analysis Undergraduate.pdfAbdulrahimShaibuIssa
 
Chapter 2 - Introduction to Data Science.pptx
Chapter 2 - Introduction to Data Science.pptxChapter 2 - Introduction to Data Science.pptx
Chapter 2 - Introduction to Data Science.pptxWollo UNiversity
 
AIS PPt.pptx
AIS PPt.pptxAIS PPt.pptx
AIS PPt.pptxdereje33
 
UNIT 7.1.pptx
UNIT 7.1.pptxUNIT 7.1.pptx
UNIT 7.1.pptxsarasiby
 
Data science.chapter-1,2,3
Data science.chapter-1,2,3Data science.chapter-1,2,3
Data science.chapter-1,2,3varshakumar21
 
Lane-SlidesMania.pptx
Lane-SlidesMania.pptxLane-SlidesMania.pptx
Lane-SlidesMania.pptxAngeCustodio
 
chap1.ppt
chap1.pptchap1.ppt
chap1.pptImXaib
 
Data Collection Methods_Seminar.pptx
Data Collection Methods_Seminar.pptxData Collection Methods_Seminar.pptx
Data Collection Methods_Seminar.pptxShruthiMalipatil1
 
Data Analytics all units
Data Analytics all unitsData Analytics all units
Data Analytics all unitsjayaramb
 

Similar to Data Analytics-Unit 1 , this Is ppt for student help (20)

What is Data?
What is Data?What is Data?
What is Data?
 
Methods of data collection
Methods of data collectionMethods of data collection
Methods of data collection
 
Bmgt 311 chapter_5
Bmgt 311 chapter_5Bmgt 311 chapter_5
Bmgt 311 chapter_5
 
Statistics for business decisions
Statistics for business decisionsStatistics for business decisions
Statistics for business decisions
 
Data Science in Python.pptx
Data Science in Python.pptxData Science in Python.pptx
Data Science in Python.pptx
 
Introducition to Data scinece compiled by hu
Introducition to Data scinece compiled by huIntroducition to Data scinece compiled by hu
Introducition to Data scinece compiled by hu
 
Introduction to Business and Data Analysis Undergraduate.pdf
Introduction to Business and Data Analysis Undergraduate.pdfIntroduction to Business and Data Analysis Undergraduate.pdf
Introduction to Business and Data Analysis Undergraduate.pdf
 
Chapter 2 - Introduction to Data Science.pptx
Chapter 2 - Introduction to Data Science.pptxChapter 2 - Introduction to Data Science.pptx
Chapter 2 - Introduction to Data Science.pptx
 
AIS PPt.pptx
AIS PPt.pptxAIS PPt.pptx
AIS PPt.pptx
 
Ch~2.pdf
Ch~2.pdfCh~2.pdf
Ch~2.pdf
 
UNIT 7.1.pptx
UNIT 7.1.pptxUNIT 7.1.pptx
UNIT 7.1.pptx
 
Ch_2.pdf
Ch_2.pdfCh_2.pdf
Ch_2.pdf
 
Data science.chapter-1,2,3
Data science.chapter-1,2,3Data science.chapter-1,2,3
Data science.chapter-1,2,3
 
Lane-SlidesMania.pptx
Lane-SlidesMania.pptxLane-SlidesMania.pptx
Lane-SlidesMania.pptx
 
chap1.ppt
chap1.pptchap1.ppt
chap1.ppt
 
chap1.ppt
chap1.pptchap1.ppt
chap1.ppt
 
chap1.ppt
chap1.pptchap1.ppt
chap1.ppt
 
Data Collection Methods_Seminar.pptx
Data Collection Methods_Seminar.pptxData Collection Methods_Seminar.pptx
Data Collection Methods_Seminar.pptx
 
WEEK2-S2 (2).pptx
WEEK2-S2 (2).pptxWEEK2-S2 (2).pptx
WEEK2-S2 (2).pptx
 
Data Analytics all units
Data Analytics all unitsData Analytics all units
Data Analytics all units
 

Recently uploaded

Dev Dives: Streamline document processing with UiPath Studio Web
Dev Dives: Streamline document processing with UiPath Studio WebDev Dives: Streamline document processing with UiPath Studio Web
Dev Dives: Streamline document processing with UiPath Studio WebUiPathCommunity
 
Ensuring Technical Readiness For Copilot in Microsoft 365
Ensuring Technical Readiness For Copilot in Microsoft 365Ensuring Technical Readiness For Copilot in Microsoft 365
Ensuring Technical Readiness For Copilot in Microsoft 3652toLead Limited
 
Story boards and shot lists for my a level piece
Story boards and shot lists for my a level pieceStory boards and shot lists for my a level piece
Story boards and shot lists for my a level piececharlottematthew16
 
Understanding the Laravel MVC Architecture
Understanding the Laravel MVC ArchitectureUnderstanding the Laravel MVC Architecture
Understanding the Laravel MVC ArchitecturePixlogix Infotech
 
"LLMs for Python Engineers: Advanced Data Analysis and Semantic Kernel",Oleks...
"LLMs for Python Engineers: Advanced Data Analysis and Semantic Kernel",Oleks..."LLMs for Python Engineers: Advanced Data Analysis and Semantic Kernel",Oleks...
"LLMs for Python Engineers: Advanced Data Analysis and Semantic Kernel",Oleks...Fwdays
 
Nell’iperspazio con Rocket: il Framework Web di Rust!
Nell’iperspazio con Rocket: il Framework Web di Rust!Nell’iperspazio con Rocket: il Framework Web di Rust!
Nell’iperspazio con Rocket: il Framework Web di Rust!Commit University
 
costume and set research powerpoint presentation
costume and set research powerpoint presentationcostume and set research powerpoint presentation
costume and set research powerpoint presentationphoebematthew05
 
SIP trunking in Janus @ Kamailio World 2024
SIP trunking in Janus @ Kamailio World 2024SIP trunking in Janus @ Kamailio World 2024
SIP trunking in Janus @ Kamailio World 2024Lorenzo Miniero
 
Commit 2024 - Secret Management made easy
Commit 2024 - Secret Management made easyCommit 2024 - Secret Management made easy
Commit 2024 - Secret Management made easyAlfredo García Lavilla
 
Pigging Solutions in Pet Food Manufacturing
Pigging Solutions in Pet Food ManufacturingPigging Solutions in Pet Food Manufacturing
Pigging Solutions in Pet Food ManufacturingPigging Solutions
 
New from BookNet Canada for 2024: BNC CataList - Tech Forum 2024
New from BookNet Canada for 2024: BNC CataList - Tech Forum 2024New from BookNet Canada for 2024: BNC CataList - Tech Forum 2024
New from BookNet Canada for 2024: BNC CataList - Tech Forum 2024BookNet Canada
 
My INSURER PTE LTD - Insurtech Innovation Award 2024
My INSURER PTE LTD - Insurtech Innovation Award 2024My INSURER PTE LTD - Insurtech Innovation Award 2024
My INSURER PTE LTD - Insurtech Innovation Award 2024The Digital Insurer
 
DevEX - reference for building teams, processes, and platforms
DevEX - reference for building teams, processes, and platformsDevEX - reference for building teams, processes, and platforms
DevEX - reference for building teams, processes, and platformsSergiu Bodiu
 
SAP Build Work Zone - Overview L2-L3.pptx
SAP Build Work Zone - Overview L2-L3.pptxSAP Build Work Zone - Overview L2-L3.pptx
SAP Build Work Zone - Overview L2-L3.pptxNavinnSomaal
 
APIForce Zurich 5 April Automation LPDG
APIForce Zurich 5 April  Automation LPDGAPIForce Zurich 5 April  Automation LPDG
APIForce Zurich 5 April Automation LPDGMarianaLemus7
 
Transcript: New from BookNet Canada for 2024: BNC CataList - Tech Forum 2024
Transcript: New from BookNet Canada for 2024: BNC CataList - Tech Forum 2024Transcript: New from BookNet Canada for 2024: BNC CataList - Tech Forum 2024
Transcript: New from BookNet Canada for 2024: BNC CataList - Tech Forum 2024BookNet Canada
 
Advanced Test Driven-Development @ php[tek] 2024
Advanced Test Driven-Development @ php[tek] 2024Advanced Test Driven-Development @ php[tek] 2024
Advanced Test Driven-Development @ php[tek] 2024Scott Keck-Warren
 
CloudStudio User manual (basic edition):
CloudStudio User manual (basic edition):CloudStudio User manual (basic edition):
CloudStudio User manual (basic edition):comworks
 
Human Factors of XR: Using Human Factors to Design XR Systems
Human Factors of XR: Using Human Factors to Design XR SystemsHuman Factors of XR: Using Human Factors to Design XR Systems
Human Factors of XR: Using Human Factors to Design XR SystemsMark Billinghurst
 
Connect Wave/ connectwave Pitch Deck Presentation
Connect Wave/ connectwave Pitch Deck PresentationConnect Wave/ connectwave Pitch Deck Presentation
Connect Wave/ connectwave Pitch Deck PresentationSlibray Presentation
 

Recently uploaded (20)

Dev Dives: Streamline document processing with UiPath Studio Web
Dev Dives: Streamline document processing with UiPath Studio WebDev Dives: Streamline document processing with UiPath Studio Web
Dev Dives: Streamline document processing with UiPath Studio Web
 
Ensuring Technical Readiness For Copilot in Microsoft 365
Ensuring Technical Readiness For Copilot in Microsoft 365Ensuring Technical Readiness For Copilot in Microsoft 365
Ensuring Technical Readiness For Copilot in Microsoft 365
 
Story boards and shot lists for my a level piece
Story boards and shot lists for my a level pieceStory boards and shot lists for my a level piece
Story boards and shot lists for my a level piece
 
Understanding the Laravel MVC Architecture
Understanding the Laravel MVC ArchitectureUnderstanding the Laravel MVC Architecture
Understanding the Laravel MVC Architecture
 
"LLMs for Python Engineers: Advanced Data Analysis and Semantic Kernel",Oleks...
"LLMs for Python Engineers: Advanced Data Analysis and Semantic Kernel",Oleks..."LLMs for Python Engineers: Advanced Data Analysis and Semantic Kernel",Oleks...
"LLMs for Python Engineers: Advanced Data Analysis and Semantic Kernel",Oleks...
 
Nell’iperspazio con Rocket: il Framework Web di Rust!
Nell’iperspazio con Rocket: il Framework Web di Rust!Nell’iperspazio con Rocket: il Framework Web di Rust!
Nell’iperspazio con Rocket: il Framework Web di Rust!
 
costume and set research powerpoint presentation
costume and set research powerpoint presentationcostume and set research powerpoint presentation
costume and set research powerpoint presentation
 
SIP trunking in Janus @ Kamailio World 2024
SIP trunking in Janus @ Kamailio World 2024SIP trunking in Janus @ Kamailio World 2024
SIP trunking in Janus @ Kamailio World 2024
 
Commit 2024 - Secret Management made easy
Commit 2024 - Secret Management made easyCommit 2024 - Secret Management made easy
Commit 2024 - Secret Management made easy
 
Pigging Solutions in Pet Food Manufacturing
Pigging Solutions in Pet Food ManufacturingPigging Solutions in Pet Food Manufacturing
Pigging Solutions in Pet Food Manufacturing
 
New from BookNet Canada for 2024: BNC CataList - Tech Forum 2024
New from BookNet Canada for 2024: BNC CataList - Tech Forum 2024New from BookNet Canada for 2024: BNC CataList - Tech Forum 2024
New from BookNet Canada for 2024: BNC CataList - Tech Forum 2024
 
My INSURER PTE LTD - Insurtech Innovation Award 2024
My INSURER PTE LTD - Insurtech Innovation Award 2024My INSURER PTE LTD - Insurtech Innovation Award 2024
My INSURER PTE LTD - Insurtech Innovation Award 2024
 
DevEX - reference for building teams, processes, and platforms
DevEX - reference for building teams, processes, and platformsDevEX - reference for building teams, processes, and platforms
DevEX - reference for building teams, processes, and platforms
 
SAP Build Work Zone - Overview L2-L3.pptx
SAP Build Work Zone - Overview L2-L3.pptxSAP Build Work Zone - Overview L2-L3.pptx
SAP Build Work Zone - Overview L2-L3.pptx
 
APIForce Zurich 5 April Automation LPDG
APIForce Zurich 5 April  Automation LPDGAPIForce Zurich 5 April  Automation LPDG
APIForce Zurich 5 April Automation LPDG
 
Transcript: New from BookNet Canada for 2024: BNC CataList - Tech Forum 2024
Transcript: New from BookNet Canada for 2024: BNC CataList - Tech Forum 2024Transcript: New from BookNet Canada for 2024: BNC CataList - Tech Forum 2024
Transcript: New from BookNet Canada for 2024: BNC CataList - Tech Forum 2024
 
Advanced Test Driven-Development @ php[tek] 2024
Advanced Test Driven-Development @ php[tek] 2024Advanced Test Driven-Development @ php[tek] 2024
Advanced Test Driven-Development @ php[tek] 2024
 
CloudStudio User manual (basic edition):
CloudStudio User manual (basic edition):CloudStudio User manual (basic edition):
CloudStudio User manual (basic edition):
 
Human Factors of XR: Using Human Factors to Design XR Systems
Human Factors of XR: Using Human Factors to Design XR SystemsHuman Factors of XR: Using Human Factors to Design XR Systems
Human Factors of XR: Using Human Factors to Design XR Systems
 
Connect Wave/ connectwave Pitch Deck Presentation
Connect Wave/ connectwave Pitch Deck PresentationConnect Wave/ connectwave Pitch Deck Presentation
Connect Wave/ connectwave Pitch Deck Presentation
 

Data Analytics-Unit 1 , this Is ppt for student help

  • 1. Data Analytics Dr. Vijay Kumar Dwivedi Associate Professor, UCER
  • 2. Data Analytics: Data Sources • Data collection is the process of acquiring, collecting, extracting, and storing the voluminous amount of data which may be in the structured or unstructured form like text, video, audio, XML files, records, or other image files used in later stages of data analysis. • Relational • Multidimensional (OLAP) • Dimensionally modeled relational
  • 3. Data Analytics: Data Sources Contd... • Internal sources – When data is collected from reports and records of the organisation itself, they are known as the internal sources. – For example, a company publishes its annual report’ on profit and loss, total sales, loans, wages, etc. • External sources • When data is collected from sources outside the organisation, they are known as the external sources. • For example, if a tour and travel company obtains information on Karnataka tourism from Karnataka Transport Corporation, it would be known as an external source of data.
  • 4. Data Growth Over the Years(2010-2025)
  • 5. Types of Data • Primary – The data which is Raw, original, and extracted directly from the official sources is known as primary data. – This type of data is collected directly by performing techniques such as questionnaires, interviews, and surveys. – The data collected must be according to the demand and requirements of the target audience on which analysis is performed otherwise it would be a burden in the data processing. • Secondary – Secondary data is the data which has already been collected and reused again for some valid purpose. This type of data is previously recorded from primary data and it has two types of sources named internal source and external source.
  • 7. Types of Data Collection: Primary Data • Interview Method • Survey Method • Observation Method • Experimental Method
  • 8. Primary Data Collection: Interview Method • The data collected during this process is through interviewing the target audience by a person called interviewer and the person who answers the interview is known as the interviewee. • Some basic business or product related questions are asked and noted down in the form of notes, audio, or video and this data is stored for processing. • These can be both structured and unstructured like personal interviews or formal interviews through telephone, face to face, email, etc.
  • 9. Primary Data Collection: Survey Method • The survey method is the process of research where a list of relevant questions are asked and answers are noted down in the form of text, audio, or video. • The survey method can be obtained in both online and offline mode like through website forms and email. • Then that survey answers are stored for analyzing data. • Examples are online surveys or surveys through social media polls.
  • 10. Primary Data Collection: Observation Method • The observation method is a method of data collection in which the researcher keenly observes the behavior and practices of the target audience using some data collecting tool and stores the observed data in the form of text, audio, video, or any raw formats. • In this method, the data is collected directly by posting a few questions on the participants. • For example, observing a group of customers and their behavior towards the products. The data obtained will be sent for processing.
  • 11. Primary Data Collection: Experimental Method • The experimental method is the process of collecting data through performing experiments, research, and investigation. • The most frequently used experiment methods are: – CRD- Completely Randomized Design – RBD- Randomized Block Design – LSD – Latin Square Design – FD- Factorial Design
  • 12. Types of Experimental Methods • CRD- Completely Randomized design – A simple experimental design used in data analytics which is based on randomization and replication. – It is mostly used for comparing the experiments. • RBD- Randomized Block Design – An experimental design in which the experiment is divided into small units called blocks. – Random experiments are performed on each of the blocks and results are drawn using a technique known as analysis of variance (ANOVA). RBD was originated from the agriculture sector.
  • 13. Types of Experimental Methods • LSD – Latin Square Design – An experimental design that is similar to CRD and RBD blocks but contains rows and columns. – It is an arrangement of NxN squares with an equal amount of rows and columns which contain letters that occurs only once in a row. – Hence the differences can be easily found with fewer errors in the experiment. – Sudoku puzzle is an example of a Latin square design. • FD- Factorial design: – An experimental design where each experiment has two factors each with possible values and on performing trail other combinational factors are derived.
  • 14. Secondary Data: Sources • Internal source: – These types of data can easily be found within the organization such as market record, a sales record, transactions, customer data, accounting resources, etc. – The cost and time consumption is less in obtaining internal sources • External source: – The data which can’t be found at internal organizations and can be gained through external third party resources is external source data. – The cost and time consumption is more because this contains a huge amount of data. – Examples of external sources are Government publications, news publications, Registrar General of India, planning commission, international labor bureau, syndicate services, and other non-governmental publications.
  • 15. Secondary Data: Sources Contd... • Other sources: – Sensors data: With the advancement of IoT devices, the sensors of these devices collect data which can be used for sensor data analytics to track the performance and usage of products. – Satellites data: Satellites collect a lot of images and data in terabytes on daily basis through surveillance cameras which can be used to collect useful information. – Web traffic: Due to fast and cheap internet facilities many formats of data which is uploaded by users on different platforms can be predicted and collected with their permission for data analysis. – The search engines also provide their data through keywords and queries searched mostly.
  • 16. Classification of data (structured, semi-structured, unstructured) • Structured Data
  • 17. Classification of data (Structured, Semi- Structured, Unstructured) Contd... • Semi-structured data is information that does not reside in a relational database but that have some organizational properties that make it easier to analyze. • With some process, you can store them in the relation database (it could be very hard for some kind of semi-structured data), but Semi- structured exist to ease space. Example: XML data.
  • 18. Classification of data (Structured, Semi- Structured, Unstructured) Contd... • Unstructured Data
  • 19. Differences between Structured, Semi- structured and Unstructured data
  • 20. Differences between Structured, Semi- structured and Unstructured data Contd...
  • 21. Characterstics of Data • Accuracy and Precision • Legitimacy and Validity • Reliability and Consistency • Timeliness and Relevance • Completeness and Comprehensiveness • Availability and Accessibility • Granularity and Uniqueness
  • 22. Characteristics of Data: Accuracy and Precision • This characteristic refers to the exactness of the data. • It cannot have any erroneous elements and must convey the correct message without being misleading. • This accuracy and precision have a component that relates to its intended use. • Without understanding how the data will be consumed, ensuring accuracy and precision could be off-target or more costly than necessary. • For example, accuracy in healthcare might be more important than in another industry (which is to say, inaccurate data in healthcare could have more serious consequences) and, therefore, justifiably worth higher levels of investment.
  • 23. Characteristics of Data: Legitimacy and Validity • Requirements governing data set the boundaries of this characteristic. • For example, on surveys, items such as gender, ethnicity, and nationality are typically limited to a set of options and open answers are not permitted. • Any answers other than these would not be considered valid or legitimate based on the survey’s requirement. • This is the case for most data and must be carefully considered when determining its quality. • The people in each department in an organization understand what data is valid or not to them, so the requirements must be leveraged when evaluating data quality.
  • 24. Characteristics of Data: Reliability and Consistency • Many systems in today’s environments use and/or collect the same source data. • Regardless of what source collected the data or where it resides, it cannot contradict a value residing in a different source or collected by a different system. • There must be a stable and steady mechanism that collects and stores the data without contradiction or unwarranted variance.
  • 25. Characteristics of Data: Timeliness and Relevance • There must be a valid reason to collect the data to justify the effort required, which also means it has to be collected at the right moment in time. • Data collected too soon or too late could misrepresent a situation and drive inaccurate decisions.
  • 26. Characteristics of Data: Completeness and Comprehensiveness • Incomplete data is as dangerous as inaccurate data. • Gaps in data collection lead to a partial view of the overall picture to be displayed. • Without a complete picture of how operations are running, uninformed actions will occur. • It’s important to understand the complete set of requirements that constitute a comprehensive set of data to determine whether or not the requirements are being fulfilled.
  • 27. Characteristics of Data: Availability and Accessibility • This characteristic can be tricky at times due to legal and regulatory constraints. • Regardless of the challenge, though, individuals need the right level of access to the data in order to perform their jobs. • This presumes that the data exists and is available for access to be granted.
  • 28. Characteristics of Data: Granularity and Uniqueness • The level of detail at which data is collected is important, because confusion and inaccurate decisions can otherwise occur. • Aggregated, summarized and manipulated collections of data could offer a different meaning than the data implied at a lower level. • An appropriate level of granularity must be defined to provide sufficient uniqueness and distinctive properties to become visible. • This is a requirement for operations to function effectively
  • 30. Introduction to Big Data Platform • Big Data is a collection of data that is huge in volume, yet growing exponentially with time. • It is a data with so large size and complexity that none of traditional data management tools can store it or process it efficiently. • Big data is also a data but with huge size.
  • 31. Big Data: Examples • 1.7MB of data is created every second by every person during 2020. • In the last two years alone, the astonishing 90% of the world’s data has been created. • 2.5 quintillion bytes of data are produced by humans every day. • 463 exabytes of data will be generated each day by humans as of 2025 • 95 million photos and videos are shared every day on Instagram. • By the end of 2020, 44 zettabytes will make up the entire digital universe. • Every day, 306.4 billion emails are sent, and 5 million Tweets are made.
  • 32. Big Data: Characteristics • Volume : the size and amounts of big data that companies manage and analyze • Variety : the diversity and range of different data types, including unstructured data, semi-structured data and raw data • Velocity: the speed at which companies receive, store and manage data – e.g., the specific number of social media posts or search queries received within a day, hour or other unit of time • Veracity: the “truth” or accuracy of data and information assets, which often determines executive-level confidence • Value: the value of big data usually comes from insight discovery and pattern recognition that lead to more effective operations, stronger customer relationships and other clear and quantifiable business benefits
  • 33. What Is Data Analytics? • Data analytics is the science of analyzing raw data in order to make conclusions about that information. • Data analytics techniques can reveal trends and metrics that would otherwise be lost in the mass of information • This information can then be used to optimize processes to increase the overall efficiency of a business or system.
  • 34. Data Analytics Process: Steps • To determine the data requirements or how the data is grouped. Data may be separated by age, demographic, income, or gender. Data values may be numerical or be divided by category. • Process of collecting data. This can be done through a variety of sources such as computers, online sources, cameras, environmental sources, or through personnel.
  • 35. Data Analytics Process: Steps Contd... • Data must be organized so it can be analyzed. Organization may take place on a spreadsheet or other form of software that can take statistical data. • Data is then cleaned up before analysis. This means it is scrubbed and checked to ensure there is no duplication or error, and that it is not incomplete. This step helps correct any errors before it goes on to a data analyst to be analyzed.
  • 36. Why Data Analytics Matters? • It helps businesses optimize their performances. • Implementing it into the business model means companies can help reduce costs by identifying more efficient ways of doing business and by storing large amounts of data. • A company can also use data analytics to make better business decisions and help analyze customer trends and satisfaction, which can lead to new—and better—products and services.
  • 39. MASSIVELY PARALLEL PROCESSING SYSTEMS (MPP) • An MPP database spreads data out into independent pieces managed by independent storage and central processing unit (CPU) resources. • Conceptually, it is like having pieces of data loaded onto multiple network connected personal computers around a house. • It removes the constraints of having one central server with only a single set CPU and disk to manage it. • The data in an MPP system gets split across a variety of disks managed by a variety of CPUs spread across a number of servers.
  • 40. MASSIVELY PARALLEL PROCESSING SYSTEMS (MPP) Contd...
  • 41. Cloud Computing • Enterprises incur no infrastructure or capital costs, only operational costs. • Those operational costs will be incurred on a pay - per - use basis with no contractual obligations. • Capacity can be scaled up or down dynamically, and immediately. • This differentiates clouds from traditional hosting service providers where there may have been limits placed on scaling. • The underlying hardware can be anywhere geographically. • The architectural specifics are abstracted from the user. • In addition, the hardware will run in multi - tenancy mode where multiple users from multiple organizations can be accessing the exact same infrastructure simultaneously.
  • 42. Grid Computing • Grid computing also helps organizations balance workloads, prioritize jobs, and offer high availability for analytic processing • A grid configuration can help both cost and performance. • It falls into the classification of “high performance computing. ” • Instead of having a single high - end server (or maybe a few of them), a large number of lower - cost machines are put in place.
  • 43. Grid Computing Contd... • As opposed to having one server managing its CPU and resources across jobs, jobs are parcelled out individually to the different machines to be processed in parallel. • Each machine may only be able to handle a fraction of the work of the original server and can potentially handle only one job at a time. • In aggregate, however, the grid can handle quite a bit. • Grids can therefore be a cost effective mechanism to improve overall throughput and capacity.
  • 44.
  • 45. Map Reduce • MapReduce is a parallel programming framework. • It’ s neither a database nor a direct competitor to databases. • MapReduce is complementary to existing technologies.
  • 48. Best Analytic Processes and Big Data Tools • R-Programming – R is a free open source software programming language and a software environment for statistical computing and graphics. It is used by data miners for developing statistical software and data analysis. It has become a highly popular tool for big data in recent years. • Datawrapper – It is an online data visualization tool for making interactive charts. – It can be embedded into any other website as well. – It is easy to use and produces visually effective charts.
  • 49. Best Analytic Processes and Big Data Tools Contd... • Tableau Public – Another popular big data tool. – It is simple and very intuitive to use. – It communicates the insights of the data through data visualisation. – Through Tableau, an analyst can check a hypothesis and explore the data before starting to work on it extensively.
  • 50. Best Analytic Processes and Big Data Tools Contd... • Content Grabber – A data extraction tool. – It is suitable for people with advanced programming skills. – It is a web crawling software. – Business organizations can use it to extract content and save it in a structured format. – It offers editing and debugging facility among many others for analysis later.
  • 51. Analysis vs Reporting • Analytics” means raw data analysis. • Typical analytics requests usually imply a once-off data investigation., whereas, “Reporting” means data to inform decisions. • Typical reporting requests usually imply repeatable access to the information, which could be monthly, weekly, daily, or even real- time.
  • 52. Steps involved in Analysis& Reporting Analysis Reporting Create Data Hypothesis Understand Business Requirement Gather and Manipulate Data Connect and Gather the Data Present Results to the Business Understand the Data Backgrounds by Different Dimensions Re-iterate Re-work the Data
  • 53. Modern Data Analytics Tools • R Programming • Tableau • Python – An object-oriented scripting language which is easy to read, write, maintain and is a free open source tool. – Supports both functional and structured programming methods. – Easy to learn as it is very similar to JavaScript, Ruby, and PHP. – It has rich set of machine learning libraries viz. Scikitlearn, Theano, Tensorflow and Keras. – Can be assembled on any platform like SQL server, a MongoDB database or JSON. – Can also handle text data very well.
  • 54. Modern Data Analytics Tools Contd... • SAS: – A programming environment and language for data manipulation and a leader in analytics, developed by the SAS Institute in 1966 and further developed in 1980’s and 1990’s. – Easily accessible, manageable and can analyze data from any sources. – Introduced a large set of products in 2011 for customer intelligence and numerous SAS modules for web, social media and marketing analytics that is widely used for profiling customers and prospects. – Can also predict their behaviours, manage, and optimize communications.
  • 55. Modern Data Analytics Tools Contd... • Apache Spark – A fast large-scale data processing engine and executes applications in Hadoop clusters 100 times faster in memory and 10 times faster on disk. – Built on data science and its concept makes data science effortless. – Also popular for data pipelines and machine learning models development. – Also includes a library – MLlib, that provides a progressive set of machine algorithms for repetitive data science techniques like Classification, Regression, Collaborative Filtering, Clustering, etc.
  • 56. Modern Data Analytics Tools Contd... • Excel – A basic, popular and widely used analytical tool almost in all industries – Analyzes the complex task that summarizes the data with a preview of pivot tables that helps in filtering the data as per client requirement. – It has the advance business analytics option which helps in modelling capabilities • RapidMiner: – A powerful integrated data science platform developed by the same company that performs predictive analysis and other advanced analytics like data mining, text analytics, machine learning and visual analytics without any programming. – Can incorporate with any data source types, including Access, Excel, Microsoft SQL, Tera data, Oracle, Sybase, IBM DB2, Ingres, MySQL, IBM SPSS, Dbase etc. – Can generate analytics based on real-life data transformation settings.
  • 57. Application of Data Analytics • Security • Transportation • Risk Detection • Risk Management • Delivery • Fast Internet Allocation • Reasonable Expenditure • Interaction with Customers • Planning of Cities • Health Care
  • 58. Data Analytics Life Cycle: Need • Data analytics is important because it helps businesses optimize their performances. • A company can also use data analytics to make better business decisions and help analyze customer trends and satisfaction, which can lead to new—and better—products and services
  • 59. Key Roles for Successful Project: Business User • The business user is the one who understands the main area of the project and is also basically benefited from the results. • This user gives advice and consult the team working on the project about the value of the results obtained and how the operations on the outputs are done. • The business manager, line manager, or deep subject matter expert in the project mains fulfills this role.
  • 60. Key Roles for Successful Project: Project Sponsor • The Project Sponsor is the one who is responsible to initiate the project. • Project Sponsor provides the actual requirements for the project and presents the basic business issue. • Generally provides the funds and measures the degree of value from the final output of the team working on the project. • Introduces the prime concern and grooms the desired output.
  • 61. Key Roles for Successful Project • Project Manager – Ensures that key milestone and purpose of the project is met on time and of the expected quality. • Business Intelligence Analyst – Provides business domain perfection based on a detailed and deep understanding of the data, key performance indicators (KPIs), key matrix, and business intelligence from a reporting point of view. – Generally creates fascia and reports and knows about the data feeds and sources. • Database Administrator (DBA) : – DBA facilitates and arrange the database environment to support the analytics need of the team working on a project
  • 62. Key Roles for Successful Project • Data Engineer : – Data engineer grasps deep technical skills to assist with tuning SQL queries for data management and data extraction and provides support for data intake into the analytic sandbox. – The data engineer works jointly with the data scientist to help build data in correct ways for analysis. • Data Scientist : – Facilitates with the subject matter expertise for analytical techniques, data modelling, and applying correct analytical techniques for a given business issues. – Ensures overall analytical objectives are met. – Outline and apply analytical methods and proceed towards the data available for the concerned project.
  • 63. Data Analytics Life Cycle: Phases • Discovery • Data Preparation • Model Planning • Model Building • Communication Results • Operationalize
  • 64.
  • 65. Data Analytic Life Cycle: Discovery • The data science team learn and investigate the problem. • Develop context and understanding. • Come to know about data sources needed and available for the project. • The team formulates initial hypothesis that can be later tested with data.
  • 66. Data Analytic Life Cycle: Data Preparation • Steps to explore, preprocess, and condition data prior to modeling and analysis. • It requires the presence of an analytic sandbox, the team execute, load, and transform, to get data into the sandbox. • Data preparation tasks are likely to be performed multiple times and not in predefined order. • Several tools commonly used for this phase are – Hadoop, Alpine Miner, Open Refine, etc.
  • 67. Data Analytic Life Cycle: Model Planning • Team explores data to learn about relationships between variables and subsequently, selects key variables and the most suitable models. • In this phase, data science team develop data sets for training, testing, and production purposes. • Team builds and executes models based on the work done in the model planning phase. • Several tools commonly used for this phase are – Matlab, STASTICA.
  • 68. Data Analytic Life Cycle: Model Building • Team develops datasets for testing, training, and production purposes. • Team also considers whether its existing tools will suffice for running the models or if they need more robust environment for executing models. • Free or open-source tools – Rand PL/R, Octave, WEKA. • Commercial tools – Matlab , STASTICA.
  • 69. Data Analytic Life Cycle: Communication Results • After executing model team need to compare outcomes of modeling to criteria established for success and failure. • Team considers how best to articulate findings and outcomes to various team members and stakeholders, taking into account warning, assumptions. • Team should identify key findings, quantify business value, and develop narrative to summarize and convey findings to stakeholders.
  • 70. Data Analytic Life Cycle: Operationalize • The team communicates benefits of project more broadly and sets up pilot project to deploy work in controlled way before broadening the work to full enterprise of users. • This approach enables team to learn about performance and related constraints of the model in production environment on small scale and make adjustments before full deployment. • The team delivers final reports, briefings, codes.