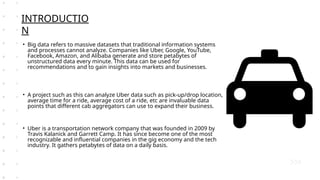
• Big datarefers to massive datasets that traditional information systems
and processes cannot analyze. Companies like Uber, Google, YouTube,
Facebook, Amazon, and Alibaba generate and store petabytes of
unstructured data every minute. This data can be used for
recommendations and to gain insights into markets and businesses.
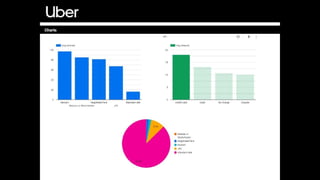
• A project such as this can analyze Uber data such as pick-up/drop location,
average time for a ride, average cost of a ride, etc are invaluable data
points that different cab aggregators can use to expand their business.
• Uber is a transportation network company that was founded in 2009 by
Travis Kalanick and Garrett Camp. It has since become one of the most
recognizable and influential companies in the gig economy and the tech
industry. It gathers petabytes of data on a daily basis.
INTRODUCTIO
N
4.
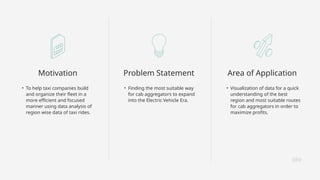
Motivation
• To helptaxi companies build
and organize their fleet in a
more efficient and focused
manner using data analysis of
region wise data of taxi rides.
Problem Statement
• Finding the most suitable way
for cab aggregators to expand
into the Electric Vehicle Era.
Area of Application
• Visualization of data for a quick
understanding of the best
region and most suitable routes
for cab aggregators in order to
maximize profits.
5.
Motivation
• There isgrowing competition
amongst cab aggregators.
• These Companies can use such data
pipelines and dashboards to customize
their business model and maximize
profits.
6.
Problem
Statement
Cab Aggregators aretransitioning from
traditional cars to electric vehicles. There
will be a huge difference on how these
electric cabs will operate when compared
to the older cabs.
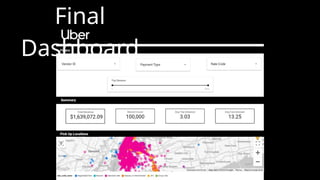
This dashboard will showcase how to
efficiently place the cabs in a region in such
a way that it’s both efficient and profiting.
7.
Area of
Application
• Cabaggregator company can apply the insights and tools developed in this project to
optimize routes, enhance customer experiences, and improve operational efficiency.
• New companies looking to come into this business can also gain insights from this
project.
8.
Literature
Review
Uber is committedto delivering safer and more reliable transportation across our
global markets. To accomplish this, Uber relies heavily on making data-driven
decisions at every level, from forecasting rider demand during high traffic events
to identifying and addressing bottlenecks in our driver-partner sign-up process.
Over time, the need for more insights has resulted in over 100 petabytes of
analytical data that needs to be cleaned, stored, and served with minimum latency
through our Apache Hadoop® based Big Data platform. Since 2014, we have
worked to develop a Big Data solution that ensures data reliability, scalability, and
ease-of-use, and are now focusing on increasing our platform’s speed and
efficiency.
9.
Literature
Review
Using Hadoop, wecan analyze the sentiment analysis of twitter data. hence this
is termed as opinion mining. The general attitude of the people can be analyzed
using twitter data i.e. positive or negative or neutral. The significant analysis of
this twitter data is to classify and categorize based on the polarity of the words.
First the data sets are collected from the twitter using twitter streaming API. This
twitter data will be stored in HDFS in specified format. Again, the data was
transferred to mapper in map reduce programming approach. This twitter data
was processed by using java and distributed processing software framework and
by using map reduce programming model and Apache hive frame work. Finally,
we can represent the analysis of twitter data in the form of positive, negative
and neutral tweets.
10.
Data Set And
InputFormat
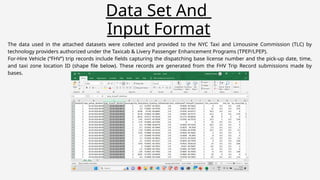
The data used in the attached datasets were collected and provided to the NYC Taxi and Limousine Commission (TLC) by
technology providers authorized under the Taxicab & Livery Passenger Enhancement Programs (TPEP/LPEP).
For-Hire Vehicle (“FHV”) trip records include fields capturing the dispatching base license number and the pick-up date, time,
and taxi zone location ID (shape file below). These records are generated from the FHV Trip Record submissions made by
bases.
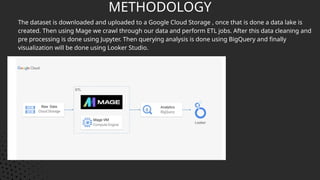
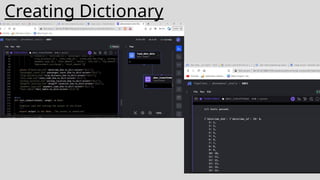
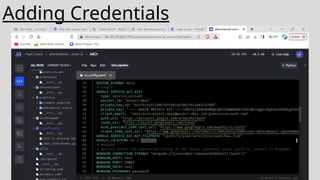
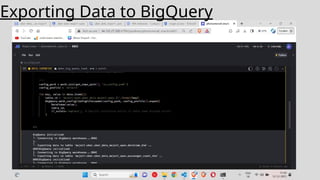
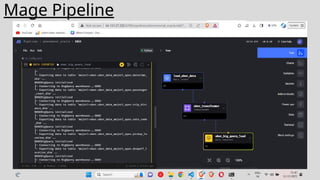
METHODOLOGY
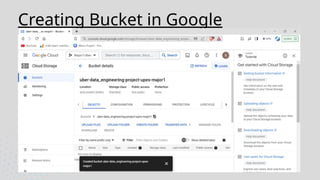
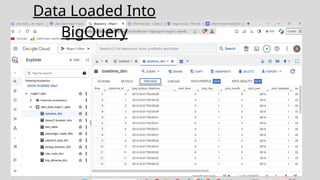
The dataset isdownloaded and uploaded to a Google Cloud Storage , once that is done a data lake is
created. Then using Mage we crawl through our data and perform ETL jobs. After this data cleaning and
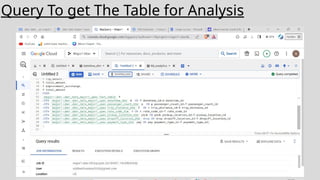
pre processing is done using Jupyter. Then querying analysis is done using BigQuery and finally
visualization will be done using Looker Studio.
14.
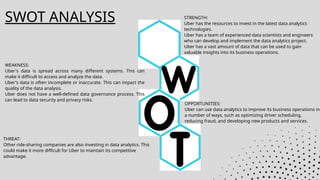
SWOT ANALYSIS STRENGTH:
Uberhas the resources to invest in the latest data analytics
technologies.
Uber has a team of experienced data scientists and engineers
who can develop and implement the data analytics project.
Uber has a vast amount of data that can be used to gain
valuable insights into its business operations.
WEAKNESS:
Uber's data is spread across many different systems. This can
make it difficult to access and analyze the data.
Uber's data is often incomplete or inaccurate. This can impact the
quality of the data analysis.
Uber does not have a well-defined data governance process. This
can lead to data security and privacy risks.
OPPORTUNITIES:
Uber can use data analytics to improve its business operations in
a number of ways, such as optimizing driver scheduling,
reducing fraud, and developing new products and services.
THREAT:
Other ride-sharing companies are also investing in data analytics. This
could make it more difficult for Uber to maintain its competitive
advantage.
Reference
s
• Reza ,R. (2014) Uber’s Big Data Platform: 100+ Petabytes with
Minute Latency. Available at:
https://www.uber.com/en-IN/blog/uber-big-data-platform/
(Accessed: 2023).
• Ajinkya Ingle, Anjali Kante, Shriya Samak, Anita Kumari. 2005.
Sentiment Analysis of Twitter Data Using Big Data Tools.
http://www.pnrsolution.org/. [Online]. May 2016.
http://www.pnrsolution.org/Datacenter/Vol3/Issue6/18.pdf
• H. Li, X. Cheng, and J. Liu, “Understanding video sharing
propagation in social networks: Measurement and analysis,” ACM
Trans. Multimed. Comput. Commun. Appl. TOMM, vol. 10, no. 4, p.
33, 2014
![Reference
s
• Reza , R. (2014) Uber’s Big Data Platform: 100+ Petabytes with
Minute Latency. Available at:
https://www.uber.com/en-IN/blog/uber-big-data-platform/
(Accessed: 2023).
• Ajinkya Ingle, Anjali Kante, Shriya Samak, Anita Kumari. 2005.
Sentiment Analysis of Twitter Data Using Big Data Tools.
http://www.pnrsolution.org/. [Online]. May 2016.
http://www.pnrsolution.org/Datacenter/Vol3/Issue6/18.pdf
• H. Li, X. Cheng, and J. Liu, “Understanding video sharing
propagation in social networks: Measurement and analysis,” ACM
Trans. Multimed. Comput. Commun. Appl. TOMM, vol. 10, no. 4, p.
33, 2014](https://image.slidesharecdn.com/majorproject-250623092013-d8077b26/85/Data-Analytics-Uber-using-google-cloud-and-dashboard-25-320.jpg)


![Uber Trips Analysis PPT[1] - Read-Only.pptx](https://cdn.slidesharecdn.com/ss_thumbnails/ubertripsanalysisppt1-read-only-241101032808-6dc735b5-thumbnail.jpg?width=640&height=640&fit=bounds)


![[Taipei.py] improving user experience with text mining and deep learning in Uber](https://cdn.slidesharecdn.com/ss_thumbnails/taipei-181228045546-thumbnail.jpg?width=640&height=640&fit=bounds)


![[Strata NYC 2019] Turning big data into knowledge: Managing metadata and data...](https://cdn.slidesharecdn.com/ss_thumbnails/dkpstratanyc2019presentation-191004091826-thumbnail.jpg?width=640&height=640&fit=bounds)


![[IJCT-V3I2P32] Authors: Amarbir Singh, Palwinder Singh](https://cdn.slidesharecdn.com/ss_thumbnails/ijct-v3i2p32-160609071950-thumbnail.jpg?width=640&height=640&fit=bounds)


