More Related Content
More from joseleorcasita (20)
Daily livestock report oct 4 2012
- 1. Vol. 10, No. 192 October 4, 2012
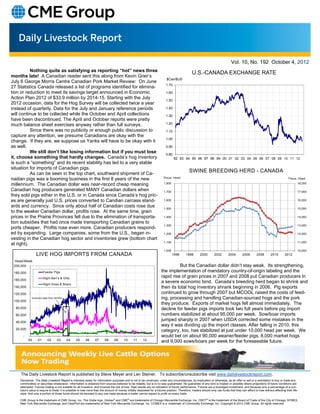
Nothing quite as satisfying as reporting “hot” news three U.S.-CANADA EXCHANGE RATE
months late! A Canadian reader sent this along from Kevin Grier’s
$Can/$US
July 6 George Morris Centre Canadian Pork Market Review: On June
1.70
27 Statistics Canada released a list of programs identified for elimina-
tion or reduction to meet its savings target announced in Economic 1.60
Action Plan 2012 of $33.9 million by 2014-15. Starting with the July
1.50
2012 occasion, data for the Hog Survey will be collected twice a year
instead of quarterly. Data for the July and January reference periods 1.40
will continue to be collected while the October and April collections 1.30
have been discontinued. The April and October reports were pretty
much balance sheet exercises anyway rather than full surveys. 1.20
Since there was no publicity or enough public discussion to 1.10
capture any attention, we presume Canadians are okay with the
1.00
change. If they are, we suppose us Yanks will have to be okay with it
as well. 0.90
We still don’t like losing information but if you must lose 0.80
it, choose something that hardly changes. Canada’s hog inventory 92 93 94 95 96 97 98 99 00 01 02 03 04 05 06 07 08 09 10 11 12
is such a “something” and its recent stability has led to a very stable
situation for imports of Canadian pigs.
As can be seen in the top chart, southward shipment of Ca-
SWINE BREEDING HERD - CANADA
Thous. Head
nadian pigs was a booming business in the first 8 years of the new Thous. Head
millennium. The Canadian dollar was near-record cheap meaning 1,800 18,000
Canadian hog producers generated MANY Canadian dollars when 1,700 17,000
they sold pigs either in the U.S. or in Canada since Canada’s hog pric-
es are generally just U.S. prices converted to Candian carcass stand- 1,600 16,000
ards and currency. Since only about half of Canadian costs rose due 1,500 15,000
to the weaker Canadian dollar, profits rose. At the same time, grain
prices in the Prairie Provinces fell due to the elimination of transporta- 1,400 14,000
tion subsidies that had once made transporting Canadian grains to
1,300 13,000
ports cheaper. Profits rose even more. Canadian producers respond-
ed by expanding. Large companies, some from the U.S., began in- 1,200 12,000
vesting in the Canadian hog sector and inventories grew (bottom chart
1,100 11,000
at right).
1,000 10,000
LIVE HOG IMPORTS FROM CANADA 1996 1998 2000 2002 2004 2006 2008 2010 2012
Head/Week
200,000 But the Canadian dollar didn’t stay weak. Its strengthening,
180,000 Feeder Pigs the implementation of mandatory country-of-origin labeling and the
Slght Barr's & Gilts rapid rise of grain prices in 2007 and 2008 put Canadian producers in
160,000
Slght Sows & Boars
a severe economic bind. Canada’s breeding herd began to shrink and
140,000 then its total hog inventory shrank beginning in 2006. Pig exports
120,000 continued to grow through 2007 but MCOOL raised the costs of feed-
Incorrect data from APHIS ing, processing and handling Canadian-sourced hogs and the pork
100,000
they produce. Exports of market hogs fell almost immediately. The
80,000 decline for feeder pigs imports took two full years before pig import
60,000 numbers stabilized at about 95,000 per week. Sow/boar imports
40,000
jumped sharply in 2007 when USDA corrected some mistakes in the
way it was dividing up the import classes. After falling in 2010, this
20,000
category, too, has stabilized at just under 10,000 head per week. We
- would bet on about 90,000 weaner/feeder pigs, 8,000 market hogs
00 01 02 03 04 05 06 07 08 09 10 11 12 and 9,000 sows/boars per week for the foreseeable future.
The Daily Livestock Report is published by Steve Meyer and Len Steiner. To subscribe/unsubscribe visit www.dailylivestockreport.com.
Disclaimer: The Daily Livestock Report is intended solely for information purposes and is not to be construed, under any circumstances, by implication or otherwise, as an offer to sell or a solicitation to buy or trade any
commodities or securities whatsoever. Information is obtained from sources believed to be reliable, but is in no way guaranteed. No guarantee of any kind is implied or possible where projections of future conditions are
attempted. Futures trading is not suitable for all investors, and involves the risk of loss. Past results are no indication of future performance. Futures are a leveraged investment, and because only a percentage of a con-
tract’s value is require to trade, it is possible to lose more than the amount of money initially deposited for a futures position. Therefore, traders should only use funds that they can afford to lose without affecting their life-
style. And only a portion of those funds should be devoted to any one trade because a trader cannot expect to profit on every trade.
CME Group is the trademark of CME Group, Inc. The Globe logo, Globex® and CME® are trademarks of Chicago Mercantile Exchange, Inc. CBOT® is the trademark of the Board of Trade of the City of Chicago. NYMEX,
New York Mercantile Exchange, and ClearPort are trademarks of New York Mercantile Exchange. Inc. COMEX is a trademark of Commodity Exchange, Inc. Copyright © 2012 CME Group. All rights reserved.