2. Page 2
Sponsored by
Vol. 11, No. 24 / February 4, 2013
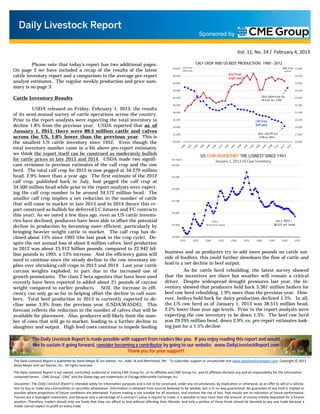
JANUARY 1st U. S. CATTLE INVENTORY
% Ch. vs. Pre-Report
INVENTORY (000 OMITTED) 2000 2001 2002 2003 2004 2005 2006 2007 2008 2009 2010 2011 2012 2013 2012 Est.
ALL CATTLE AND CALVES 98,199 97,298 96,723 96,100 94,403 95,018 96,342 96,573 96,035 94,521 93,881 92,682 90,769 89,300 -1.6% -1.8%
COW AND HEIFERS THAT HAVE CALVED 42,758 42,570 42,240 42,125 41,519 41,678 41,806 41,789 41,692 41,045 40,456 39,999 39,387 38,515 -2.2% -1.3%
BEEF COWS 33,575 33,398 33,134 32,983 32,531 32,674 32,703 32,644 32,435 31,712 31,371 30,850 30,158 29,295 -2.9% -1.5%
DAIRY COWS 9,183 9,172 9,106 9,142 8,988 9,004 9,104 9,145 9,257 9,333 9,086 9,150 9,230 9,220 -0.1% -0.7%
HEIFERS 500LBS. AND OVER 19,650 19,776 19,683 19,629 19,282 19,445 19,950 20,074 19,855 19,576 19,746 19,576 19,338 19,129 -1.1% -2.0%
BEEF COW REPLACEMENT 5,503 5,588 5,571 5,624 5,508 5,638 5,864 5,835 5,647 5,531 5,451 5,139 5,262 5,361 1.9% -0.4%
DAIRY COW REPALCEMENT 4,000 4,057 4,055 4,114 4,018 4,117 4,298 4,325 4,415 4,410 4,526 4,568 4,622 4,551 -1.5% -0.8%
OTHER HEIFERS 10,147 10,131 10,057 9,891 9,756 9,690 9,788 9,914 9,793 9,635 9,769 9,869 9,454 9,218 -2.5% -3.5%
STEERS 500 LBS. AND OVER 16,682 16,461 16,804 16,554 16,201 16,466 16,988 17,185 17,163 16,769 16,510 16,397 15,833 15,813 -0.1% -2.2%
BULLS 500 LBS. AND OVER 2,293 2,274 2,244 2,248 2,201 2,214 2,258 2,214 2,207 2,184 2,190 2,155 2,096 2,056 -1.9% -2.7%
HFRS, STRS AND BULLS UNDER 500 LBS. 16,816 16,216 15,753 15,545 15,200 15,215 15,339 15,311 15,118 14,948 14,979 14,555 14,115 13,787 -2.3% -2.5%
ANNUAL CALF CROP ** 38,631 38,300 38,224 37,593 37,260 37,106 37,016 36,759 36,153 35,939 35,685 35,313 34,279 -2.9% -2.1%
The Daily Livestock Report is made possible with support from readers like you. If you enjoy reading this report and would like to
sustain it going forward, consider becoming a contributor by going to our website: www.DailyLivestockReport.com
Thank you for your support!
3. Page 3
Sponsored by
Vol. 11, No. 24 / February 4, 2013
PRODUCTION & PRICE SUMMARY Week Ending 2/2/2013
Current Y/Y %
Item Units Week Last Week Pct. Change Last Year Pct. Change YTD Change
2-Feb-13 26-Jan-13 4-Feb-12
Total Red Meat & Poultry mil lbs., cwe 1,727 1,705 1.26% 1,682 2.68% 7,488 -0.5%
FI Slaughter Thou. Head 621 625 -0.64% 591 5.07% 2,919 -3.3%
C FI Cow Slaughter ** Thou. Head 135 141 -4.24% 133 1.26% 378 -4.9%
A Avg. Live Weight Lbs. 1333 1333 0.00% 1312 1.60% 1,332 2.1%
T Avg. Dressed Weight Lbs. 800 802 -0.25% 789 1.39% 800 2.1%
T Beef Production Million Lbs. 495.5 500.1 -0.92% 465.1 6.54% 2,295 -2.7%
L Live Fed Steer Price $ per cwt 124.96 122.60 1.92% 123.35 1.31%
E Dressed Fed Steer Price $ per cwt 197.63 198.03 -0.20% 198.01 -0.19%
OKC Feeder Steer, 600-700 $ per cwt 157.29 153.87 2.22% 163.10 -3.56%
& Choice Beef Cutout $ per cwt 185.83 188.95 -1.65% 183.34 1.36%
Hide/Offal $ per cwt, live wt 13.70 13.59 0.81% 12.49 9.69%
B Rib, Choice $ per cwt 270.19 273.17 -1.09% 252.32 7.08%
E Round, Choice $ per cwt 162.53 167.13 -2.75% 166.64 -2.47%
E Chuck, Choice $ per cwt 160.56 163.49 -1.79% 157.16 2.16%
F Trimmings, 50% $ per cwt 66.69 66.08 0.92% 98.83 -32.52%
Trimmings, 90% $ per cwt 212.02 211.74 0.13% 206.30 2.77%
FI Slaughter Thou. Head 2,176 2,153 1.07% 2,131 2.11% 10,415 -3.4%
FI Sow Slaughter ** Thou. Head 59.7 56.4 5.82% 57.5 3.90% 163 -3.6%
H Avg. Dressed Weight Lbs. 208.0 208.0 0.00% 208.0 0.00% 208 -0.4%
O Pork Production Million Lbs. 452.2 446.7 1.23% 443.3 2.01% 2,163 -3.8%
G Iowa-S. Minn. Direct Wtd. Avg. 86.49 86.51 -0.02% 87.09 -0.69%
S Natl. Base Carcass Price Wtd. Avg. 85.58 85.07 0.60% 85.14 0.52%
Natl. Net Carcass Price Wtd. Avg. 88.15 87.58 0.65% 87.70 0.51%
Pork Cutout 200 Lbs. 85.90 84.94 1.13% 84.88 1.20%
Hams $ per cwt 69.22 67.48 2.58% 65.37 5.89%
Loins $ per cwt 89.08 88.04 1.18% 93.18 -4.40%
Bellies $ per cwt 145.38 140.01 3.84% 121.90 19.26%
72CL Pork Trim $ per cwt 68.00 64.02 6.22% 68.67 -0.98%
C Young Chicken Slaughter * Million Head 149.8 151.1 -0.87% 152.2 -1.61% 590 0.3%
H Avg. Weight (Live) Lbs. 5.88 5.68 3.52% 5.84 0.68% 5.79 2.0%
I Chicken Production (RTC) Million Lbs. 669.3 652.2 2.62% 666.8 0.38% 2,617 4.4%
C Eggs Set Million 197.8 196.2 0.83% 193.9 2.01% 787 1.7%
K Chicks Placed Million Head 163.7 162.1 1.00% 160.7 1.87% 653 1.1%
E 12-City Broiler Price Composite 99.43 98.08 1.38% 82.9 19.94%
N Georgia Dock Broiler Price 2.5-3 Lbs. 99.81 99.46 0.35% 89.9 11.02%
Northeast Breast, B/S $/cwt 137.13 137.27 -0.10% 127.04 7.94%
Northeast Legs $/cwt 66.54 66.98 -0.66% 72.07 -7.67%
T Young Turkey Slaughter * Million Head 4.404 4.198 4.91% 4.208 4.66% 16.312 0.7%
U Avg. Live Weight Lbs. 31.13 31.58 -1.42% 31.61 -1.52% 31.81 6.3%
R Turkey Production (RTC) Million Lbs. 109.6 106.0 3.40% 106.4 3.08% 413 0.2%
K Eastern Region Hen Price 8-16 Lbs. 98.00 95.50 2.62% 95.92 2.17%
G Corn, Omaha $ per Bushel 7.67 7.46 2.82% 6.49 18.18%
R DDGs, Minnesota $ per Ton 256.00 252.50 1.39% 183.00 39.89%
A Wheat, Kansas City $ per Bushel 8.00 7.92 1.01% 6.93 15.44%
I Soybeans, S. Iowa $ per Bushel 15.01 14.70 2.11% 12.22 22.83%
N Soybn Meal, 48% Decatur $ per Ton 443.90 431.70 2.83% 322.90 37.47%
* Chicken & turkey slaughter & production are 1 week earlier than the date at the top of this sheet.
** Cow and sow slaughter reflect levels from two weeks ago due to reporting lag.
The Daily Livestock Report is made possible with support from readers like you. If you enjoy reading this report and would like to
sustain it going forward, consider becoming a contributor by going to our website: www.DailyLivestockReport.com
Thank you for your support!