This document describes the characterization and density functional theory (DFT) calculations of a Fe, Cu dual-metal single atom catalyst on carbon black for oxygen reduction reaction. Transmission electron microscopy, X-ray diffraction, X-ray photoelectron spectroscopy and other techniques were used to characterize the catalyst's structure and composition. DFT calculations were performed to simulate the oxygen reduction reaction mechanism on the catalyst surface and calculate adsorption energies of reaction intermediates. The catalyst showed high activity and selectivity for oxygen reduction, outperforming monometallic analogues due to synergistic effects between isolated Fe and Cu sites.


![catalyst ink was prepared by mixing 4 mg catalyst powder, 480 µL isopropanol, 500 µL
deionized water and 20 µL nafion solution (5 wt.% in water and 1-propanol, Alfa)
together, and ultrasonicated for 1 h forming a homogeneous solution. For FeCu-SAC,
Fe-SAC and Cu-SAC, 10 µL ink was dropped on polished glassy carbon electrode and
the catalyst loading was 0.8 mg cm-2
. For commercial Pt/C, 5 µL ink was dropped on
polished glassy carbon electrode and the Pt loading was 0.08 mg cm-2
.
Before tests, the electrolyte was first saturated by purging with O2 or N2 at least 30 min,
and the gas flow was maintained throughout the test. For rotating disk electrode (RDE)
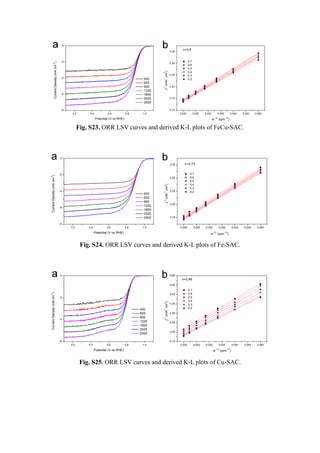
tests, the linear sweep voltammetry (LSV) curves were measured at a scan rate of 10
mV s-1
in O2 and N2 saturated electrolyte. The final oxygen reduction current was
obtained from the difference between LSV curves measured in O2 and N2 saturated
electrolyte. Rotating ring-disk electrode (RRDE) tests were applied to measure the
electron transfer number (n) and hydroperoxide yield (H2O2%) using the following
equations:
n=
4×ID
ID+
IR
N
H2O2%=
200×IR
IR+N×ID
Where ID was the Faradaic current at disk, IR was the Faradaic current at Pt ring, and N
was the H2O2 collect efficiency at the ring (37 %).
DFT calculations: First-principles calculations were performed based on the density
functional theory (DFT)[1]
as implemented in the Vienna Ab-initio Simulation Package
(VASP) by adopting the generalized gradient approximation (GGA) with the Perdew-
Burke-Ernzerhof (PBE) exchange-correlation functional.[2,3]
To simulate the ORR](https://image.slidesharecdn.com/d2ta09922e1-231115061749-392466d3/85/d2ta09922e1-pdf-3-320.jpg)
![multi-step process on the pristine Pt/C and Fe/Cu doped nitrogenated graphene (C-
FeN4/C-CuN4), the atomic structures of 2 × 2 Pt (111) slab and 2 × 2 × 1 nitrogenated
graphene anchoring with Fe/Cu or dual FeCu metal dopants were constructed, as shown
in Fig. S27. The whole ORR process was divided into five elementary steps:
1) O2 + * → O2*
2) O2* + H2O + e-
→ OOH* + OH-
3) OOH* + e-
→ O* + OH-
4) O* + H2O + e-
→ OH* + OH-
5) OH* + e-
→ OH-
+ *
Where * indicates adsorption sites. Different intermediate adsorption configurations of
*O, *OH, and *OOH on the Pt and Fe/Cu doped C-N4 surfaces were enumerated and
the most equilibrium sites were calculated. The vacuum slabs were set more than 15 Å
to avoid the periodic boundary interactions.[4]
Especially for the Pt (111) slab, the
bottom two layers were constrained to represent the bulk property of Pt substrate.[5]
To
consider the van der Waals interaction for the intermediates adsorption/desorption,
DFT-D3 method by Grimme et al.[6]
was considered in the DFT calculations. The plane
wave energy cut-off was set to 520 eV and a 3 × 3 × 1 Monkhorst-Pack k-point mesh
was sampled. All structures were fully optimized until the final energy and residual
force convergence reached 10-5
eV and 0.02 eV Å-1
, respectively. The adsorption energy
of intermediates on the catalyst surface was calculated as,
ΔG = Gad+substrate − Gsubstrate − Gad, (1)
where the Gad+substrate, Gsubstrate, and Gad represent the Gibbs free energies of catalyst](https://image.slidesharecdn.com/d2ta09922e1-231115061749-392466d3/85/d2ta09922e1-pdf-4-320.jpg)
![surface with/without intermediates adsorption and studied intermediates, respectively.
In particular, during the Gibbs free energy calculation, the zero-point energy and
entropy change with the consideration of temperature effect were considered, which is
defined as
G = E + Ezpe – TΔS, (2)
in which Ezpe and TΔS represent the zero-point energy and vibrational entropy part of
the adsorptive intermediates. All energy corrections were obtained using the open-
source VASPKIT package.[7]](https://image.slidesharecdn.com/d2ta09922e1-231115061749-392466d3/85/d2ta09922e1-pdf-5-320.jpg)


![Table S1. Fitting results for FeCu-SAC.
Sample Path N R (Å) σ2
(Å) ΔE0 (eV) R factor
Fe foil[a] Fe-Fe 8 2.46 0.00468 5.833
0.0065
Fe-Fe 6 2.85 0.00527 5.728
Cu foil[b]
Cu-Cu 12 2.54 0.00861 4.562 0.0017
FeCu-
SAC[c]
Fe-N 3.8 2.01 0.00574 5.59 0.011
Cu-N 4.06 1.99 0.00572 1.272 0.022
[a]: k range: 3-10.0 (Å-1
); R range: 1-3 Å; S0 = 0.687 [b]: k range: 2.7-13.6 (Å-1
); R
range: 1.15-3 Å; S0 = 0.837; S0 = 0.837 [c]: k range: 2.59-8.18 (Å-1
); R range: 1.15-
3.58 Å for Fe-N path. k range: 2.3-9.0 (Å-1
); R range: 0.8-3.0 Å for Cu-N path.
Table S2. The contents of different N type in FeCu-SAC, Fe-SAC and Cu-SAC.
sample
N
content %
Pyridinic N
percentage %
Pyrrolic N
percentage %
Graphitic N
percentage %
Oxidized N
percentage %
FeCu-
SAC
2.66 43.86 19.57 19.67 16.91
Fe-SAC 1.97 44.06 15.30 17.62 23.01
Cu-
SAC
2.23 40.90 23.98 14.70 20.41](https://image.slidesharecdn.com/d2ta09922e1-231115061749-392466d3/85/d2ta09922e1-pdf-26-320.jpg)
![Table S3. Comparison of dual metal single atom catalysts for ORR in alkaline
condition.
Name
Half-wave
potential
(V)
Kinetic
current
density
Tafel slope
(mV dec-1
)
Ref.
FeCu-SAC 0.926
16.33 mA
cm-2
at 0.9 V
53.6
This
work
FeCu-DA/NC 0.860
1.87 mA cm-2
at 0.85 V
57 [8]
Cu-Fe-N-C 0.864 / 100.1 [9]
Cu@Fe-N-C 0.892 / 78 [10]
FeCu-NC 0.882
14.78 mA
cm-2
at 0.85
V
74 [11]
NCAG/Fe-Cu 0.940
25.5 mA cm-2
at 0.85 V
55 [12]
Fe1Co3-NC-1100 0.877 / 69.06 [13]
CoFe-NC-900 0.940 / 68 [14]
Co2/Fe-N@CHC 0.915
9.44 mA cm-2
at 0.90 V
62 [15]
f-FeCoNC900 0.890 / / [16]
CoFe-N-C 0.897 / / [17]
Ni-N4/GHSs/Fe-N4 0.830 / 55 [18]
FeNi SAs/NC 0.840 / 54.68 [19]
Fe/Mn-Nx-C 0.880
13.58 mA
cm-2
at 0.85
V
/ [20]
FeMn-DSAC 0.922
27.0 mA cm-2
at 0.90 V
33 [21]
Fe1Se1-NC 0.880 / / [22]
Fe-N4/Pt-N4@NC 0.930
27.2 mA cm-2
at 0.85 V
78 [23]
COF@MOF800-Fe 0.890 / 80 [24]
Cu/Zn-NC 0.830 / 54.8 [25]](https://image.slidesharecdn.com/d2ta09922e1-231115061749-392466d3/85/d2ta09922e1-pdf-27-320.jpg)
![References
[1] Kresse, G. Furthmuller, J. Phys. Rev. B Condens. Matter., 1996, 54, 11169-11186
[2] Hammer, B., Hansen, L. B.Norskov, J. K., Phys. Rev. B, 1999, 59, 7413-7421
[3] Ernzerhof, M. Scuseria, G. E., J. Chem. Phys., 1999, 110, 5029-5036
[4] Huang, H., Wu, H.-H., Chi, C., Huang, B.Zhang, T.-Y., J. Mater. Chem. A, 2019, 7,
8897-8904
[5] Li, J., Huang, H., Cao, X., Wu, H.-H., Pan, K., Zhang, Q., Wu, N.Liu, X., Chem.
Eng. J., 2021, 416, 127677
[6] Grimme, S., Antony, J., Ehrlich, S.Krieg, H., J. Chem. Phys., 2010, 132, 154104
[7] Wang, V., Xu, N., Liu, J.-C., Tang, G.Geng, W.-T., Computer Phys. Commun., 2021,
108033
[8] Du, C., Gao, Y., Chen, H., Li, P., Zhu, S., Wang, J., He, Q.Chen, W., J. Mater. Chem.
A, 2020, 8, 16994-17001
[9] Li, J., Chen, J., Wan, H., Xiao, J., Tang, Y., Liu, M.Wang, H., Appl. Catal., B, 2019,
242, 209-217
[10] Wang, Z., Jin, H., Meng, T., Liao, K., Meng, W., Yang, J., He, D., Xiong, Y.Mu, S.,
Adv. Funct. Mater., 2018, 28, 1802596
[11] Xiao, Z., Sun, P., Qiao, Z., Qiao, K., Xu, H., Wang, S.Cao, D., Chem. Eng. J., 2022,
446, 137112
[12] He, T., Chen, Y., Liu, Q., Lu, B., Song, X., Liu, H., Liu, M., Liu, Y. N., Zhang, Y.,
Ouyang, X.Chen, S., Angew. Chem., Int. Ed., 2022, 61, e202201007
[13] He, Y. T., Yang, X. X., Li, Y. S., Liu, L. T., Guo, S. W., Shu, C. Y., Liu, F., Liu, Y.
N., Tan, Q.Wu, G., ACS Catal., 2022, 12, 1216-1227
[14] Wang, K., Liu, J. P., Tang, Z. H., Li, L. G., Wang, Z., Zubair, M., Ciucci, F.,
Thomsen, L., Wright, J.Bedford, N. M., J. Mater. Chem. A, 2021, 9, 13044-
13055
[15] Wang, Z., Jin, X., Zhu, C., Liu, Y., Tan, H., Ku, R., Zhang, Y., Zhou, L., Liu, Z.,
Hwang, S. J.Fan, H. J., Adv. Mater., 2021, 33, e2104718
[16] Zhang, G. X., Jia, Y., Zhang, C., Xiong, X. Y., Sun, K., Chen, R. D., Chen, W. X.,
Kuang, Y., Zheng, L. R., Tang, H. L., Liu, W., Liu, J. F., Sun, X. M., Lin, W.](https://image.slidesharecdn.com/d2ta09922e1-231115061749-392466d3/85/d2ta09922e1-pdf-28-320.jpg)
![F.Dai, H. J., Energy Environ. Sci., 2019, 12, 1317-1325
[17] Zhou, X. Y., Gao, J. J., Hu, Y. X., Jin, Z. Y., Hu, K. L., Reddy, K. M., Yuan, Q. H.,
Lin, X.Qiu, H. J., Nano Lett., 2022, 22, 3392-3399
[18] Chen, J., Li, H., Fan, C., Meng, Q., Tang, Y., Qiu, X., Fu, G.Ma, T., Adv. Mater.,
2020, 32, e2003134
[19] Yu, D. S., Ma, Y. C., Hu, F., Lin, C. C., Li, L. L., Chen, H. Y., Han, X. P.Peng, S.
J., Adv. Energy Mater., 2021, 11, 2101242
[20] Chen, Z., Liao, X. B., Sun, C. L., Zhao, K. N., Ye, D. X., Li, J. T., Wu, G., Fang,
J. H., Zhao, H. B.Zhang, J. J., Appl. Catal., B, 2021, 288, 120021
[21] Cui, T., Wang, Y. P., Ye, T., Wu, J., Chen, Z., Li, J., Lei, Y., Wang, D.Li, Y., Angew.
Chem., Int. Ed., 2022, e202115219
[22] Chen, Z., Su, X., Ding, J., Yang, N., Zuo, W., He, Q., Wei, Z., Zhang, Q., Huang,
J.Zhai, Y., Appl. Catal., B, 2022, 308, 121206
[23] Han, A., Wang, X. J., Tang, K., Zhang, Z. D., Ye, C. L., Kong, K. J., Hu, H. B.,
Zheng, L. R., Jiang, P., Zhao, C. X., Zhang, Q., Wang, D. S.Li, Y. D., Angew.
Chem., Int. Ed., 2021, 60, 19262-19271
[24] Miao, Q., Yang, S., Xu, Q., Liu, M., Wu, P., Liu, G., Yu, C., Jiang, Z., Sun, Y.Zeng,
G., Small Struct., 2022, 3, 2100225
[25] Tong, M., Sun, F., Xie, Y., Wang, Y., Yang, Y., Tian, C., Wang, L.Fu, H., Angew.
Chem., Int. Ed., 2021, 60, 14005-14012](https://image.slidesharecdn.com/d2ta09922e1-231115061749-392466d3/85/d2ta09922e1-pdf-29-320.jpg)


