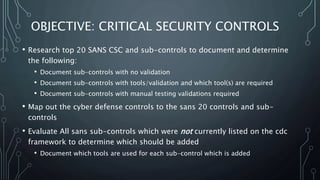
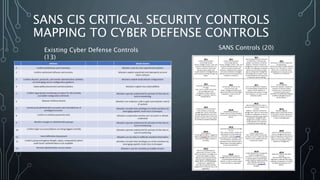
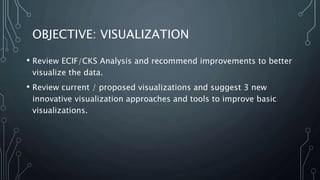
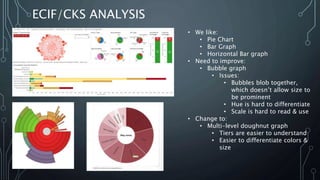
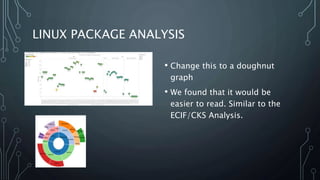
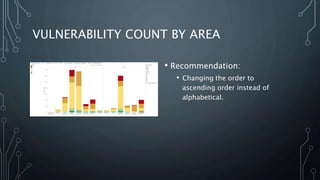
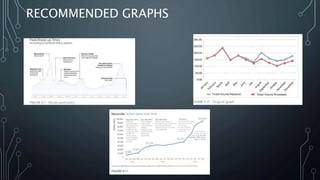
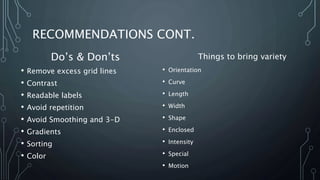
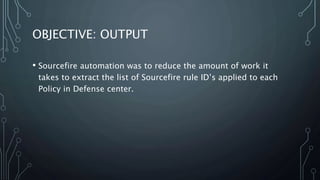
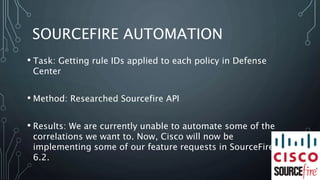
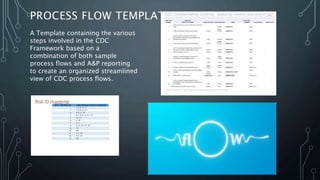
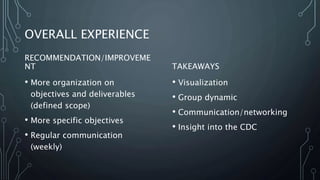
CYBER DEFENSE FRAMEWORK
BROOKE MILLER
BRIAN CEDILLO
CRISTAL HERMOSILLO
ELIJAH MILTON
FRANK PAGALOS
DANIEL LOZEN-KOWALSKI
OBJECTIVE: CRITICAL SECURITY CONTROLS
• Research top 20 SANS CSC and sub-controls to document and determine
the following:
• Document sub-controls with no validation
• Document sub-controls with tools/validation and which tool(s) are required
• Document sub-controls with manual testing validations required
• Map out the cyber defense controls to the sans 20 controls and sub-
controls
• Evaluate All sans sub-controls which were not currently listed on the cdc
framework to determine which should be added
• Document which tools are used for each sub-control which is added
SANS CIS CRITICAL SECURITY CONTROLS
MAPPING TO CYBER DEFENSE CONTROLS
Existing Cyber Defense Controls
(13)
SANS Controls (20)
SANS CIS CRITICAL SECURITY CONTROLS
MAPPING TO CYBER DEFENSE CONTROLS
OBJECTIVE: VISUALIZATION
• Review ECIF/CKS Analysis and recommend improvements to better
visualize the data.
• Review current / proposed visualizations and suggest 3 new
innovative visualization approaches and tools to improve basic
visualizations.
• We like:
• Pie Chart
• Bar Graph
• Horizontal Bar graph
• Need to improve:
• Bubble graph
• Issues:
• Bubbles blob together,
which doesn’t allow size to
be prominent
• Hue is hard to differentiate
• Scale is hard to read & use
• Change to:
• Multi-level doughnut graph
• Tiers are easier to understand
• Easier to differentiate colors &
size
ECIF/CKS ANALYSIS
LINUX PACKAGE ANALYSIS
• Change this to a doughnut
graph
• We found that it would be
easier to read. Similar to the
ECIF/CKS Analysis.
VULNERABILITY COUNT BY AREA
• Recommendation:
• Changing the order to
ascending order instead of
alphabetical.
RECOMMENDED GRAPHS
RECOMMENDATIONS CONT.
Do’s & Don’ts
• Remove excess grid lines
• Contrast
• Readable labels
• Avoid repetition
• Avoid Smoothing and 3-D
• Gradients
• Sorting
• Color
Things to bring variety
• Orientation
• Curve
• Length
• Width
• Shape
• Enclosed
• Intensity
• Special
• Motion
OBJECTIVE: OUTPUT
• Sourcefire automation was to reduce the amount of work it
takes to extract the list of Sourcefire rule ID’s applied to each
Policy in Defense center.
SOURCEFIRE AUTOMATION
• Task: Getting rule IDs applied to each policy in Defense
Center
• Method: Researched Sourcefire API
• Results: We are currently unable to automate some of the
correlations we want to. Now, Cisco will now be
implementing some of our feature requests in SourceFire
6.2.
OBJECTIVE: OUTPUT CONT.
• Create a template for a final report of Cyber Defense
Framework (results of the deliverables…graphs, pics, etc.),
mimic A&P reports, export Tableau visualizations into template
PROCESS FLOW TEMPLATE
A Template containing the various
steps involved in the CDC
Framework based on a
combination of both sample
process flows and A&P reporting
to create an organized streamlined
view of CDC process flows.
15
OVERALL EXPERIENCE
RECOMMENDATION/IMPROVEME
NT
• More organization on
objectives and deliverables
(defined scope)
• More specific objectives
• Regular communication
(weekly)
TAKEAWAYS
• Visualization
• Group dynamic
• Communication/networking
• Insight into the CDC
THANK YOU

Cyber_Defense_Presentation

  • 1.
    CYBER DEFENSE FRAMEWORK BROOKEMILLER BRIAN CEDILLO CRISTAL HERMOSILLO ELIJAH MILTON FRANK PAGALOS DANIEL LOZEN-KOWALSKI
  • 2.
    OBJECTIVE: CRITICAL SECURITYCONTROLS • Research top 20 SANS CSC and sub-controls to document and determine the following: • Document sub-controls with no validation • Document sub-controls with tools/validation and which tool(s) are required • Document sub-controls with manual testing validations required • Map out the cyber defense controls to the sans 20 controls and sub- controls • Evaluate All sans sub-controls which were not currently listed on the cdc framework to determine which should be added • Document which tools are used for each sub-control which is added
  • 3.
    SANS CIS CRITICALSECURITY CONTROLS MAPPING TO CYBER DEFENSE CONTROLS Existing Cyber Defense Controls (13) SANS Controls (20)
  • 4.
    SANS CIS CRITICALSECURITY CONTROLS MAPPING TO CYBER DEFENSE CONTROLS
  • 5.
    OBJECTIVE: VISUALIZATION • ReviewECIF/CKS Analysis and recommend improvements to better visualize the data. • Review current / proposed visualizations and suggest 3 new innovative visualization approaches and tools to improve basic visualizations.
  • 6.
    • We like: •Pie Chart • Bar Graph • Horizontal Bar graph • Need to improve: • Bubble graph • Issues: • Bubbles blob together, which doesn’t allow size to be prominent • Hue is hard to differentiate • Scale is hard to read & use • Change to: • Multi-level doughnut graph • Tiers are easier to understand • Easier to differentiate colors & size ECIF/CKS ANALYSIS
  • 7.
    LINUX PACKAGE ANALYSIS •Change this to a doughnut graph • We found that it would be easier to read. Similar to the ECIF/CKS Analysis.
  • 8.
    VULNERABILITY COUNT BYAREA • Recommendation: • Changing the order to ascending order instead of alphabetical.
  • 10.
  • 11.
    RECOMMENDATIONS CONT. Do’s &Don’ts • Remove excess grid lines • Contrast • Readable labels • Avoid repetition • Avoid Smoothing and 3-D • Gradients • Sorting • Color Things to bring variety • Orientation • Curve • Length • Width • Shape • Enclosed • Intensity • Special • Motion
  • 12.
    OBJECTIVE: OUTPUT • Sourcefireautomation was to reduce the amount of work it takes to extract the list of Sourcefire rule ID’s applied to each Policy in Defense center.
  • 13.
    SOURCEFIRE AUTOMATION • Task:Getting rule IDs applied to each policy in Defense Center • Method: Researched Sourcefire API • Results: We are currently unable to automate some of the correlations we want to. Now, Cisco will now be implementing some of our feature requests in SourceFire 6.2.
  • 14.
    OBJECTIVE: OUTPUT CONT. •Create a template for a final report of Cyber Defense Framework (results of the deliverables…graphs, pics, etc.), mimic A&P reports, export Tableau visualizations into template
  • 15.
    PROCESS FLOW TEMPLATE ATemplate containing the various steps involved in the CDC Framework based on a combination of both sample process flows and A&P reporting to create an organized streamlined view of CDC process flows. 15
  • 16.
    OVERALL EXPERIENCE RECOMMENDATION/IMPROVEME NT • Moreorganization on objectives and deliverables (defined scope) • More specific objectives • Regular communication (weekly) TAKEAWAYS • Visualization • Group dynamic • Communication/networking • Insight into the CDC
  • 17.

Editor's Notes

  • #7 Easier to differentiate colors, size and importance (tiers closer to middle can may be more important than those farther out.)
  • #12 Hue ( no extreme colors) Page 109 from Data Fluency shows a great diverging gradient
  • #18 Eli-