This document is CVS Caremark Corporation's annual report filed with the SEC for the fiscal year ended December 29, 2007. It provides an overview of CVS Caremark following its merger with Caremark Rx, Inc. in March 2007. CVS Caremark operates in two business segments: Retail Pharmacy and Pharmacy Services. The Retail Pharmacy segment includes CVS/pharmacy retail stores, MinuteClinic health clinics, and online retail. The Pharmacy Services segment provides pharmacy benefit management services and mail order pharmacy services. In fiscal year 2007, CVS Caremark filled over 1 billion prescriptions and derived 95% of its pharmacy revenues from managed care and other third party plans.
![UNITED STATES
SECURITIES AND EXCHANGE COMMISSION
Washington, D.C. 20549
FORM 10-K
⌧ Annual Report Pursuant to Section 13 or 15(d) of the Securities Exchange Act of 1934
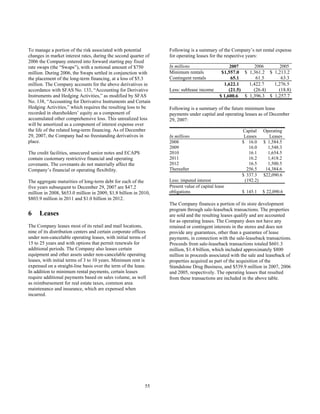
For the fiscal year ended December 29, 2007
OR
Transition Report Pursuant to Section 13 or 15(d) of the Securities Exchange Act of 1934
For the transition period from to
Commission file number 001-01011
CVS CAREMARK CORPORATION
(Exact name of Registrant as specified in its charter)
Delaware 050494040
(State or other jurisdiction of
incorporation or organization)
(I.R.S. Employer Identification No.)
One CVS Drive
Woonsocket, Rhode Island
(Address of principal executive offices)
02895
(Zip Code)
(401) 765-1500
(Registrant’s telephone number, including area code)
Securities registered pursuant to Section 12(b) of the Exchange Act:
Common Stock, par value $0.01 per share
Title of each class
New York Stock Exchange
Name of each exchange on which registered
Securities registered pursuant to Section 12(g) of the Exchange Act: None
Indicate by check mark if the registrant is a well-known seasoned issuer, as defined in Rule 405 of the Securities Act.
Yes[X] No[ ]
Indicate by check mark if the registrant is not required to file reports pursuant to Section 13 or Section 15(d) of the Act.
Yes[ ] No[X]
Indicate by check mark whether the registrant (1) has filed all reports required to be filed by Section 13 or 15(d) of the
Securities Exchange Act of 1934 during the preceding 12 months (or for such shorter period that the registrant was
required to file such reports) and (2) has been subject to such filing requirements for the past 90 days. Yes[X] No[ ]
Indicate by check mark if disclosure of delinquent filers pursuant to Item 405 of Regulation S-K is not contained herein,
and will not be contained, to the best of registrant’s knowledge, in definitive proxy or information statements
incorporated by reference in Part III of this Form 10-K or any amendment to this Form 10-K. [X]
Indicate by check mark whether the registrant is a large accelerated filer, an accelerated filer, or a non-accelerated filer,
or a smaller reporting company. See definition of “large accelerated filer,” “accelerated filer” and “smaller reporting
company” in Rule 12b-2 of the Exchange Act.
Large accelerated filer [X] Accelerated filer [ ]
Non-accelerated filer [ ] (Do not check if a smaller reporting company Smaller reporting company [ ]
Indicate by check mark whether the registrant is a shell company (as defined in Rule 12b-2 of the Act). Yes[ ] No [X]](https://image.slidesharecdn.com/1016205/85/CVS-Caremark-2007-Form-10-K-1-320.jpg)


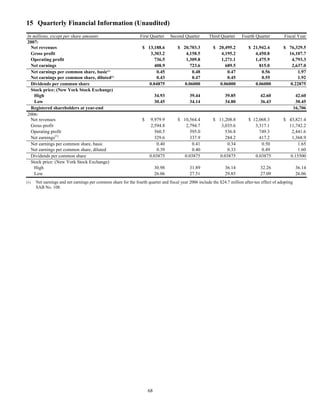
![36
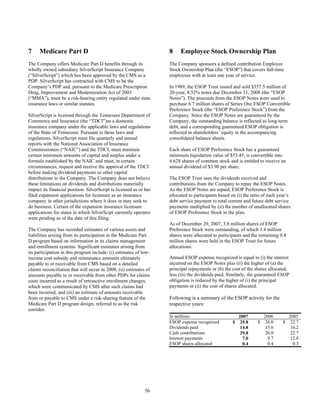
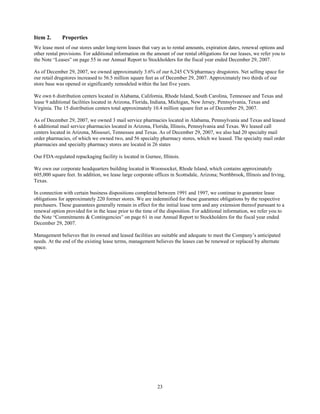
PART IV
Item 15. Exhibits, Financial Statement Schedules
A. Documents filed as part of this report:
1. Financial Statements:
The following financial statements are incorporated by reference from pages 18 through 68 and pages 70 through 71
of our Annual Report to Stockholders for the fiscal year ended December 29, 2007, as provided in Item 8 hereof:
Consolidated Statements of Operations for the fiscal years ended December 29, 2007,
December 30, 2006 and December 31, 2005..................................................................................................39
Consolidated Balance Sheets as of December 29, 2007 and December 30, 2006..................................................40
Consolidated Statements of Cash Flows for the fiscal years ended December 29, 2007,
December 30, 2006 and December 31, 2005..................................................................................................41
Consolidated Statements of Shareholders’ Equity for the fiscal years ended December 29, 2007,
December 30, 2006 and December 31, 2005.......................................................................................... 42 - 43
Notes to Consolidated Financial Statements..................................................................................................44 – 68
Report of Independent Registered Public Accounting Firm .......................................................................... 70 - 71
2. Financial Statement Schedules
The following financial statement schedule is filed on page 44 of this report: Schedule II — Valuation and
Qualifying Accounts. All other financial statement schedules are omitted because they are not applicable or the
information is included in the financial statements or related notes.
B. Exhibits
Exhibits marked with an asterisk (*) are hereby incorporated by reference to exhibits or appendices previously filed by
the Registrant as indicated in brackets following the description of the exhibit.
Exhibit Description
1.1* Underwriting Agreement dated August 10, 2006 among the Registrant and Lehman Brothers Inc.,
Banc of America Securities LLC, BNY Capital Markets, Inc. and Wachovia Capital Markets,
LLC, as representatives of the Underwriters [incorporated by reference to Exhibit 1.1 to the
Registrant’s Current Report on Form 8-K dated August 10, 2006 (Commission File No. 001-
01011)].
1.2* Underwriting Agreement dated May 22, 2007 among the Registrant and Lehman Brothers Inc.,
Morgan Stanley & Co. Incorporated, Banc of America Securities LLC, BNY Capital Markets,
Inc. and Wachovia Capital Markets, LLC, as representatives of the Underwriters [incorporated by
reference to Exhibit 1.1 to the Registrant’s Current Report on Form 8-K dated May 22, 2007
(Commission File No. 001-01011)].
1.3* Underwriting Agreement dated May 22, 2007 among the Registrant and Lehman Brothers Inc.,
Morgan Stanley & Co. Incorporated, Banc of America Securities LLC, BNY Capital Markets,
Inc. and Wachovia Capital Markets, LLC, as representatives of the Underwriters [incorporated by
reference to Exhibit 1.2 to the Registrant’s Current Report on Form 8-K dated May 22, 2007
(Commission File No. 001-01011)].
2.1*
2.2*
2.3*
Agreement and Plan of Merger dated as of November 1, 2006 among, the Registrant, Caremark
Rx. Inc. and Twain MergerSub Corp. [incorporated by reference to Exhibit 2.1 to the Registrant’s
Registration Statement No. 333-139470 on Form S-4 filed December 19, 2006].
Amendment No. 1 dated as of January 16, 2007 to the Agreement and Plan of Merger dated as of
November 1, 2006 among the Registrant, Caremark Rx, Inc. and Twain Merger Sub Corp.
[incorporated by reference to Exhibit 2.2 to the Registrant’s Registration Statement No. 333-
139470 on Form S-4/A filed January 16, 2007].
Waiver Agreement dated as of January 16, 2007 between the Registrant and Caremark Rx, Inc.
with respect to the Agreement and Plan Merger dates as of November 1, 2006 by and between
Registrant and Caremark Rx, Inc [incorporated by reference to Exhibit 2.3 to the Registrant’s](https://image.slidesharecdn.com/1016205/85/CVS-Caremark-2007-Form-10-K-37-320.jpg)
![37
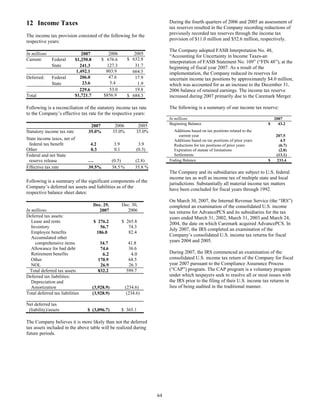
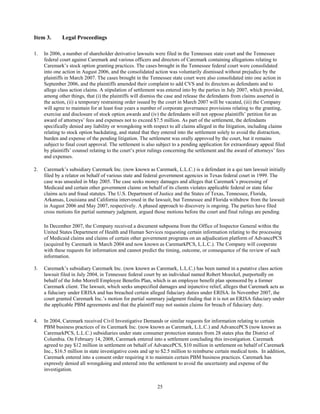
Exhibit Description
Registration Statement No. 333-139470 on Form S-4/A filed January 16, 2007].
2.4* Amendment to Waiver Agreement, dated as of February 13, 2007, between Registrant and
Caremark Rx, Inc. [incorporated by reference to Exhibit 99.2 to the Registrant’s Current Report
on Form 8-K dated February 12, 2007 (Commission File No. 001-01011)].
3.1* Amended and Restated Certificate of Incorporation of the Registrant [incorporated by reference
to Exhibit 3.1 of CVS Corporation’s Annual Report on Form 10-K for the fiscal year ended
December 31, 1996 (Commission File No. 001-01011)].
3.1A* Certificate of Amendment to the Amended and Restated Certificate of Incorporation, effective
May 13, 1998 [incorporated by reference to Exhibit 4.1A to Registrant’s Registration Statement
No. 333-52055 on Form S-3/A dated May 18, 1998].
3.1B* Certificate of Amendment to the Amended and Restated Certificate of Incorporation
[incorporated by reference to Exhibit 3.1 to Registrant’s Current Report on Form 8-K dated
March 22, 2007 (Commission File No. 001-01011)].
3.1C* Certificate of Merger dated May 9, 2007 [incorporated by reference to Exhibit 3.1C to
Registrant’s Quarterly Report on Form 10-Q dated November 1, 2007 (Commission File No. 001-
01011)].
3.2* By-laws of the Registrant, as amended and restated [incorporated by reference to Exhibit 3.2 to
the Registrant’s Current Report on Form 8-K dated February 5, 2008 (Commission File No. 001-
01011)].
4 Pursuant to Regulation S-K, Item 601(b)(4)(iii)(A), no instrument which defines the rights of
holders of long-term debt of the Registrant and its subsidiaries is filed with this report. The
Registrant hereby agrees to furnish a copy of any such instrument to the Securities and Exchange
Commission upon request.
4.1* Specimen common stock certificate [incorporated by reference to Exhibit 4.1 to the Registration
Statement of the Registrant on Form 8-B dated November 4, 1996 (Commission File No. 001-
01011)].
4.2* Senior Indenture dated August 15, 2006 between the Registrant, as issuer, and The Bank of New
York Trust Company, N.A., as trustee, including form of debt security [incorporated by reference
to Exhibit 4.1 to the Registrant’s Current Report on Form 8-K dated August 10, 2006
(Commission File No. 001-01011)].
4.3* Specimen First Supplemental Indenture between Registrant and The Bank of New York Trust
Company, N. A., a national banking association [incorporated by reference to Exhibit 4.1 to the
Registrant’s Current Report on Form 8-K dated May 22, 2007 (Commission File No. 001-
01011)].
4.4* Specimen ECAPSSM
[incorporated by reference to Exhibit 4.2 to the Registrant’s Current Report
on Form 8-K dated May 22, 2007 (Commission File No. 001-01011)].
10.1* Stock Purchase Agreement dated as of October 14, 1995 between The TJX Companies, Inc. and
Melville Corporation, as amended November 17, 1995 [incorporated by reference to Exhibits 2.1
and 2.2 to Melville’s Current Report on Form 8-K dated December 4, 1995 (Commission File No.
001-01011)].
10.2* Stock Purchase Agreement dated as of March 25, 1996 between Melville Corporation and
Consolidated Stores Corporation, as amended May 3, 1996 [incorporated by reference to Exhibits
2.1 and 2.2 to Melville’s Current Report on Form 8-K dated May 5, 1996 (Commission File No.
001-01011)].
10.3* Distribution Agreement dated as of September 24, 1996 among Melville Corporation, Footstar,
Inc. and Footstar Center, Inc. [incorporated by reference to Exhibit 99.1 to Melville’s Current
Report on Form 8-K dated October 28, 1996 (Commission File No. 001-01011)].
10.4* Tax Disaffiliation Agreement dated as of September 24, 1996 among Melville Corporation,
Footstar, Inc. and certain subsidiaries named therein [incorporated by reference to Exhibit 99.2 to
Melville’s Current Report on Form 8-K dated October 28, 1996 (Commission File No. 001-
01011)].](https://image.slidesharecdn.com/1016205/85/CVS-Caremark-2007-Form-10-K-38-320.jpg)
![38
10.5* Stockholder Agreement dated as of December 2, 1996 between the Registrant, Nashua Hollis
CVS, Inc. and Linens ‘n Things, Inc. [incorporated by reference to Exhibit 10(i)(6) to the
Registrant’s Annual Report on Form 10-K for the fiscal year ended December 31, 1997
(Commission File No. 001-01011)].
10.6* Tax Disaffiliation Agreement dated as of December 2, 1996 between the Registrant and Linens ‘n
Things, Inc. and certain of their respective affiliates [incorporated by reference to Exhibit 10(i)(7)
to the Registrant’s Annual Report on Form 10-K for the fiscal year ended December 31, 1997
(Commission File No. 001-01011)].
10.7* Note Purchase Agreement dated June 7, 1989 by and among Melville Corporation and
Subsidiaries Employee Stock Ownership Plan, as Issuer, Melville Corporation, as Guarantor, and
the Purchasers listed therein [incorporated by reference to Exhibit 10(i)(9) to the Registrant’s
Annual Report on Form 10-K for the fiscal year ended December 31, 1997 (Commission File No.
001-01011)].
10.8* Supplemental Retirement Plan for Select Senior Management of Melville Corporation I as
amended through July 1995 [incorporated by reference to Exhibit 10(iii)(A)(vii) to Melville’s
Annual Report on Form 10-K for the fiscal year ended December 31, 1995 (Commission File No.
001-01011)].
10.9* Supplemental Retirement Plan for Select Senior Management of Melville Corporation II as
amended through July 1995 [incorporated by reference to Exhibit 10(iii)(A)(viii) to Melville’s
Annual Report on Form 10-K for the fiscal year ended December 31, 1995 (Commission File No.
001-01011)].
10.10 Caremark Rx Inc. Supplemental Executive Retirement Plan.
10.11 Caremark Rx Inc. Special Retirement Plan.
10.12* Income Continuation Policy for Select Senior Executives of Melville Corporation as amended
through May 12, 1988 [incorporated by reference to Exhibit 10 (viii) to Melville’s Annual Report
on Form 10-K for the fiscal year ended December 31, 1994 (Commission File No. 001-01011)].
10.13* CVS Corporation 1996 Directors Stock Plan, as amended and restated November 5, 2002
[incorporated by reference to Exhibit 10.18 to the Registrant’s Annual Report on Form 10-K for
the fiscal year ended December 28, 2002 (Commission File No. 001-01011)].
10.14* Form of Employment Agreements between the Registrant and the Registrant’s executive officers
[incorporated by reference to the Registrant’s Annual Report on Form 10-K/A for the fiscal year
ended December 31, 1996 (Commission File No. 001-01011)].
10.15* Deferred Stock Compensation Plan [incorporated by reference to Exhibit 10(iii)(A)(xi) to the
Registrant’s Annual Report on Form 10-K for the fiscal year ended December 31, 1997
(Commission File No. 001-01011)].
10.16* 1997 Incentive Compensation Plan as amended [incorporated by reference to Exhibit 99.1 of the
Registrant’s Registration Statement No. 333-141481 on Form S-8 filed March 22, 2007].
10.17* 2007 Incentive Plan [incorporated by reference to Exhibit E of the Registrant’s Definitive Proxy
Statement filed April 4, 2007 (Commission File No. 001-01011)].
10.18* Caremark Rx, Inc. 2004 Incentive Stock Plan [incorporated by reference to Exhibit 99.2 of the
Registrant’s Registration Statement No. 333-141481 on Form S-8 filed March 22, 2007].
10.19 Caremark Rx Inc. Deferred Compensation Plan, effective April 1, 2005.
10.20* Deferred Compensation Plan [incorporated by reference to Exhibit 10.1 to the Registrant’s
Quarterly Report on Form 10-Q for the quarter ended June 27, 1998 (Commission File No. 001-
01011)].
10.21* Partnership Equity Program [incorporated by reference to Exhibit 10.2 to the Registrant’s
Quarterly Report on Form 10-Q for the quarter ended June 27, 1998 (Commission File No. 001-
01011)].](https://image.slidesharecdn.com/1016205/85/CVS-Caremark-2007-Form-10-K-39-320.jpg)
![39
10.22* Form of Collateral Assignment and Executive Life Insurance Agreement between Registrant and
the Registrant’s executive officers [incorporated by reference to Exhibit 10.11(xv) to the
Registrant’s Annual Report on Form 10-K for the fiscal year ended December 31, 1998
(Commission File No. 001-01011)].
10.23* Description of the Long-Term Performance Share Plan [incorporated by reference to Exhibit
10.27 to the Registrant’s Annual Report on Form 10-K for the fiscal year ended January 1, 2000
(Commission File No. 001-01011)].
10.24* 1999 Employee Stock Purchase Plan [incorporated by reference to Exhibit 99.A of the
Registrant’s Definitive Proxy Statement filed March 4, 1999 (Commission File No. 001-01011)].
10.25* 2007 Employee Stock Purchase Plan [incorporated by reference to Exhibit D of the Registrant’s
Definitive Proxy Statement filed April 4, 2007 (Commission File No. 001-01011)].
10.26* Description of the Executive Retention Program [incorporated by reference to Exhibit 10.1 to the
Registrant’s Quarterly Report on Form 10-Q for the quarterly period ended July 1, 2000
(Commission File No. 001-01011)].
10.27* Five-year Credit Agreement dated as of June 11, 2004 by and among the Registrant, the lenders
party thereto, Bank of America, N.A., Credit Suisse First Boston and Wachovia Securities, Inc.,
as Co-Syndication Agents, ABN Amro Bank N.V. as Documentation Agent, and The Bank of
New York, as Administrative Agent [incorporated by reference to Exhibit 10.3 to the Registrant’s
Current Report on Form 8-K dated July 31, 2004 (Commission File No. 001-01011)].
10.28* Form of Non-Qualified Stock Option Agreements between the Registrant and the selected
employees of the Registrant [incorporated by reference to Exhibit 99.1 to the Registrant’s Current
Report on Form 8-K dated January 5, 2005 (Commission File No. 001-01011)].
10.29* Form of Restricted Stock Unit Agreement between the Registrant and the selected employees of
the Registrant [incorporated by reference to Exhibit 99.2 to the Registrant’s Current Report on
Form 8-K dated January 5, 2005 (Commission File No. 001-01011)].
10.30* Form of Replacement Restricted Stock Unit Agreement between the Registrant and the selected
employees of the Registrant [incorporated by reference to Exhibit 99.3 to the Registrant’s Current
Report on Form 8-K dated January 5, 2005 (Commission File No. 001-01011)].
10.31* Five Year Credit Agreement dated as of June 3, 2005 by and among the Registrant, the lenders
party hereto, Bank of America, N.A., Credit Suisse First Boston, Wachovia Securities, Inc., and
National Association as Co-Syndication Agents, Suntrust Bank as Documentation Agent, and The
Bank of New York, as Administrative Agent [incorporated by reference to Exhibit 10.1 to the
Registrant’s Quarterly Report on Form 10-Q for the quarterly period ended July 2, 2005
(Commission File No. 001-01011)].
10.32* Employment Agreement dated as of December 4, 1996 between the Registrant and the
Registrant’s President and Chief Executive Officer [incorporated by reference to Exhibit 10.1 to
the Registrant’s Quarterly Report on Form 10-Q for the quarterly period ended October 1, 2005
(Commission File No. 001-01011)].
10.33* Retention Agreement dated as of August 5, 2005 between the Registrant and the Registrant’s
President and Chief Executive Officer [incorporated by reference to Exhibit 10.2 to the
Registrant’s Quarterly Report on Form 10-Q for the quarterly period ended October 1, 2005
(Commission File No. 001-01011)].
10.34* Form of Restricted Stock Unit Agreement between the Registrant and the Registrant’s President
and Chief Executive Officer [incorporated by reference to Exhibit 10.3 to the Registrant’s
Quarterly Report on Form 10-Q for the quarterly period ended October 1, 2005 (Commission File
No. 001-01011)].
10.35* Amendment dated as of June 2, 2006 to the Asset Purchase Agreement dated as of January 22,
2006 among CVS, CVS Pharmacy, Albertson’s, SUPERVALU, INC., New Aloha Corporation,
and the Sellers listed on Annex A thereto [incorporated by reference to Exhibit 10.2 to the
Registrant’s Current Report on Form 8-K dated June 2, 2006 (Commission File No. 001-01011)].
10.36* 364-day Credit Agreement dated as of May 12, 2006 by and among the Registrant, the lenders](https://image.slidesharecdn.com/1016205/85/CVS-Caremark-2007-Form-10-K-40-320.jpg)
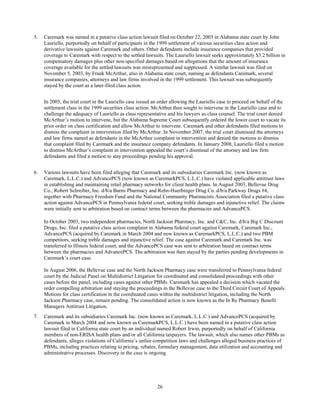
![40
party thereto, Bank of America, N.A. and Wachovia Bank, National Association, as Co-
Syndication Agents, and The Bank of New York, as Administrative Agent [incorporated by
reference to Exhibit 10.3 to the Registrant’s Current Report on Form 8-K dated June 2, 2006
(Commission File No. 001-01011)].
10.37* Five Year Credit Agreement dated as of May 12, 2006 by and among the Registrant, the lenders
party thereto, Bank of America, N.A., Lehman Brothers Inc. and Wachovia Bank, National
Association, as Co-Syndication Agents, Keybank National Association, as Documentation Agent,
and The Bank of New York, as Administrative Agent [incorporated by reference to Exhibit 10.4
to the Registrant’s Current Report on Form 8-K dated June 2, 2006 (Commission File No. 001-
01011)].
10.38* Bridge Credit Agreement dated as of May 24, 2006 by and among the Registrant, the lenders
party thereto and Lehman Commercial Paper Inc., as Administrative Agent [incorporated by
reference to Exhibit 10.5 to the Registrant’s Current Report on Form 8-K dated June 2, 2006
(Commission File No. 001-01011)].
10.39* Employment Agreement dated as of September 1, 1999 between the Registrant and the
Registrant’s Executive Vice President, Chief Financial Officer and Chief Accounting Officer
[incorporated by reference to Exhibit 10.1 to the Registrant’s Current Report on Form 8-K dated
December 21, 2006 (Commission File No. 001-01011)].
10.40* Amendment dated as of December 19, 2006 to the Employment Agreement dated as of
September 1, 1999 between the Registrant and the Registrant’s Executive Vice President, Chief
Financial Officer and Chief Accounting Officer [incorporated by reference to Exhibit 10.1 to the
Registrant’s Current Report on Form 8-K dated December 21, 2006 (Commission File No. 001-
01011)].
10.41* Employment Agreement dated as of December 20, 2001 between Registrant and the Registrant’s
Executive Vice President and President of CVS Health Services [incorporated by reference to
Exhibit 10.39 to the Registrant’s Annual Report on Form 10-K for the fiscal year ended
December 30, 2006 (Commission File No. 001-01011)].
10.42* Amendment dated as of December 20, 2006 to the Employment Agreement dated as of December
20, 2001 between the Registrant and the Registrant’s Executive Vice President and President of
Health Services [incorporated by reference to Exhibit 10.40 to the Registrant’s Annual Report on
Form 10-K for the fiscal year ended December 30, 2006 (Commission File No. 001-01011)].
10.43* Employment Agreement dated as of December 4, 1996 between the Registrant and the
Registrant’s Executive Vice President and President of CVS/pharmacy – Retail [incorporated by
reference to Exhibit 10.41 to the Registrant’s Annual Report on Form 10-K for the fiscal year
ended December 30, 2006 (Commission File No. 001-01011)].
10.44* Amendment dated as of December 20, 2006 to the Employment Agreement dated as of December
4, 1996 between the Registrant and the Registrant’s Executive Vice President and President of
CVS/pharmacy – Retail [incorporated by reference to Exhibit 10.42 to the Registrant’s Annual
Report on Form 10-K for the fiscal year ended December 30, 2006 (Commission File No. 001-
01011)].
10.45* Amendment dated as of December 19, 2006 to the Employment Agreement dated as of December
4, 1998 between the Registrant and the Registrant’s President and Chief Executive Officer
[incorporated by reference to Exhibit 10.43 to the Registrant’s Annual Report on Form 10-K for
the fiscal year ended December 30, 2006 (Commission File No. 001-01011)].](https://image.slidesharecdn.com/1016205/85/CVS-Caremark-2007-Form-10-K-41-320.jpg)
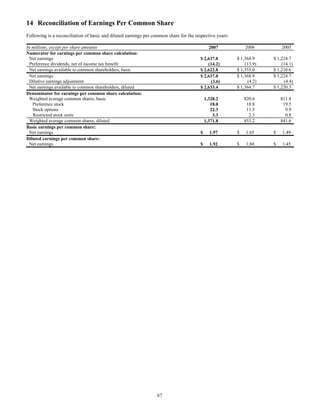
![41
10.46* Employment Agreement dated as of October 10, 1997 between the Registrant and the
Registrant’s Executive Vice President – Strategy and Chief Legal Officer [incorporated by
reference to Exhibit 10.44 to the Registrant’s Annual Report on Form 10-K for the fiscal year
ended December 30, 2006 (Commission File No. 001-01011)].
10.47* Amendment dated as of December 20, 2006 to the Employment Agreement dated as of October
10, 1997 between the Registrant and the Registrant’s Executive Vice President – Strategy and
Chief Legal Officer [incorporated by reference to Exhibit 10.45 to the Registrant’s Annual Report
on Form 10-K for the fiscal year ended December 30, 2006 (Commission File No. 001-01011)]
10.48* Five Year Credit Agreement dated as of March 12, 2007 by and among the Registrant, the lenders
party thereto, Lehman Commercial Paper Inc., and Wachovia Bank, National Association, as Co-
Syndication Agents, Morgan Stanley Senior Funding, Inc., as Documentation Agent, and The
Bank of New York, as Administrative Agent [incorporated by reference to Exhibit 10.1 to the
Registrant’s Current Report on Form 8-K dated March 22, 2007 (Commission File No. 001-
01011)].
10.49* 364 Day Credit Agreement, dated as of March 12, 2007 by and among the Registrant, the lenders
party thereto, Lehman Commercial Paper Inc., and Wachovia Bank, National Association, as Co-
Syndication Agents and The Bank of New York, as Administrative Agent [incorporated by
reference to Exhibit 10.2 to the Registrant’s Current Report on Form 8-K dated March 22, 2007
(Commission File No. 001-01011)].
10.50* Bridge Credit Agreement dated as of March 12, 2007 by and among the Registrant, the lenders
party thereto, Lehman Commercial Paper Inc., as Administration Agent, Morgan Stanley Senior
Funding, Inc., as Syndication Agent, The Bank of New York, Bank of America, N.A. and
Wachovia Bank, National Association, as Co-Documentation Agents [incorporated by reference
to Exhibit 10.3 to the Registrant’s Current Report on Form 8-K dated March 22, 2007
(Commission File No. 001-01011)].
10.51* Global Amendment dated as of March 15, 2007, to i) Five Year Credit Agreement dated as of
June 11, 2004, (ii) Five Year Credit Agreement dated as of June 2, 2005, (iii) five Year Credit
Agreement dated as of May 12, 2006, (iv) Five Year Credit Agreement, dated as of march 12,
2007, and (v) 364 Day Credit Agreement, dated as of March 12, 2007 [incorporated by reference
to Exhibit 10.4 to the Registrant’s Current Report on Form 8-K dated March 22, 2007
(Commission File No. 001-01011)].
10.52* Confirmation between Registrant and Lehman Brothers OTC Derivatives Inc. dated May 13,
2007 [incorporated by reference to Exhibit 10.1 to the Registrant’s Current Report on Form 8-K
dated May 13, 2007 (Commission File No. 001-01011)].
10.53* Confirmation between Registrant and Lehman Brothers OTC Derivatives Inc. dated November 6,
2007 [incorporated by reference to Exhibit 10.1 to the Registrant’s Current Report on Form 8-K
dated November 7, 2007 (Commission File No. 001-01011)].
13 Portions of the 2007 Annual Report to Stockholders of CVS Caremark Corporation, which are
specifically designated in this Form 10-K as being incorporated by reference.
21 Subsidiaries of the Registrant.
23.1 Consent of Ernst & Young LLP.
23.2 Consent of KPMG LLP.
31.1 Certification by the Chief Executive Officer pursuant to Section 302 of the Sarbanes-Oxley Act
of 2002.
31.2 Certification by the Chief Financial Officer pursuant to Section 302 of the Sarbanes-Oxley Act of
2002.
32.1 Certification by the Chief Executive Officer pursuant to Section 906 of the Sarbanes-Oxley Act
of 2002.
32.2 Certification by the Chief Financial Officer pursuant to Section 906 of the Sarbanes-Oxley Act of
2002.](https://image.slidesharecdn.com/1016205/85/CVS-Caremark-2007-Form-10-K-42-320.jpg)