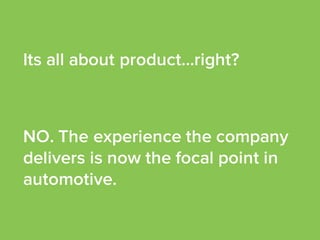
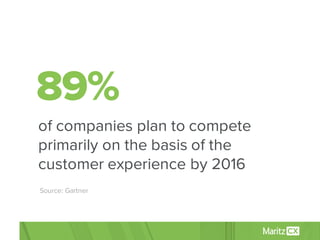
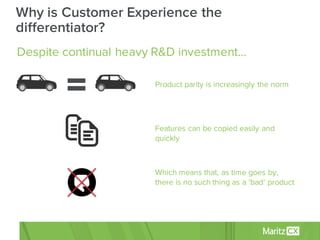
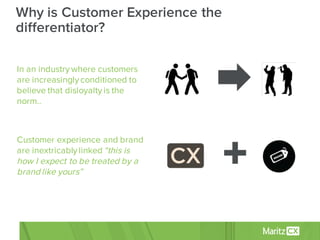
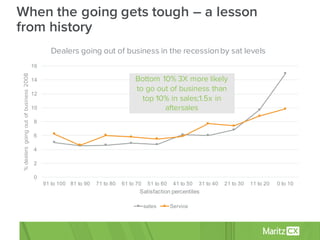
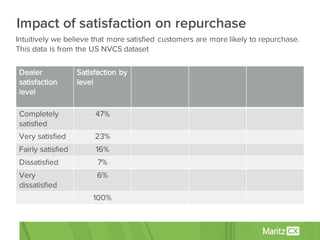
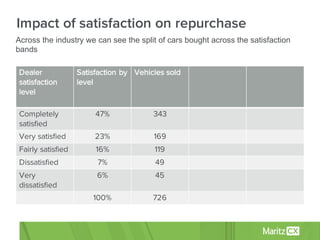
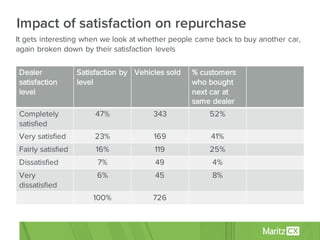
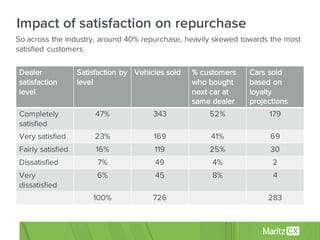
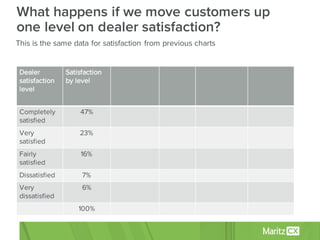
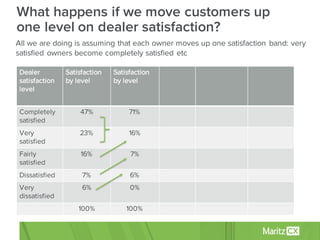
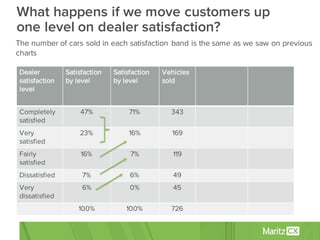
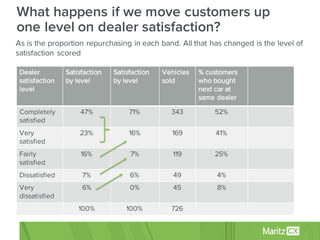
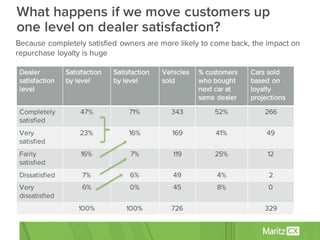
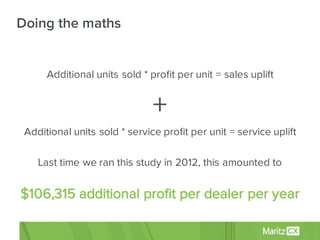
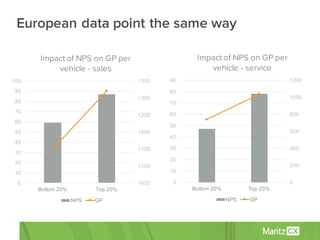
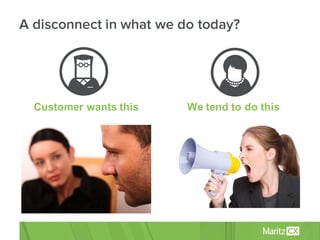
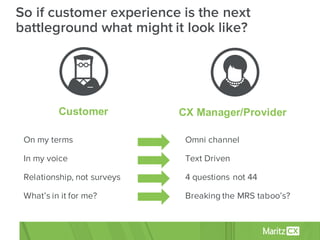
Customer Experience:
The Next Frontier
Its all about product…right?
NO. The experience the company
delivers is now the focal point in
automotive.
89%
of companies plan to compete
primarily on the basis of the
customer experience by 2016
Source: Gartner
Despite continual heavy R&D investment…
Product parity is increasingly the norm
Features can be copied easily and
quickly
Which means that, as time goes by,
there is no such thing as a ‘bad’ product
Why is Customer Experience the
differentiator?
In an industry where customers
are increasingly conditioned to
believe that disloyalty is the
norm..
Customer experience and brand
are inextricably linked “this is
how I expect to be treated by a
brand like yours”
Why is Customer Experience the
differentiator?
Great customer
experience… does it really
make a difference?
When the going gets tough – a lesson
from history
0
2
4
6
8
10
12
14
16
91  to  100 81  to  90 71  to  80 61  to  70 51  to  60 41  to  50 31  to  40 21  to  30 11  to  20 0  to  10
%dealersgoingoutofbusiness2008
Satisfaction  percentiles
Dealers going out of business in the recessionby sat levels
sales Service
Bottom 10% 3X more likely
to go out of business than
top 10% in sales;1.5x in
aftersales
Impact of satisfaction on repurchase
Intuitively we believe that more satisfied customers are more likely to repurchase.
This data is from the US NVCS dataset
Dealer
satisfaction
level
Satisfaction by
level
Completely
satisfied
47%
Very satisfied 23%
Fairly satisfied 16%
Dissatisfied 7%
Very
dissatisfied
6%
100%
Dealer
satisfaction
level
Satisfaction by
level
Vehicles sold
Completely
satisfied
47% 343
Very satisfied 23% 169
Fairly satisfied 16% 119
Dissatisfied 7% 49
Very
dissatisfied
6% 45
100% 726
Impact of satisfaction on repurchase
Across  the  industry  we  can  see  the  split  of  cars  bought  across  the  satisfaction  
bands
Dealer
satisfaction
level
Satisfaction by
level
Vehicles sold % customers
who bought
next car at
same dealer
Completely
satisfied
47% 343 52%
Very satisfied 23% 169 41%
Fairly satisfied 16% 119 25%
Dissatisfied 7% 49 4%
Very
dissatisfied
6% 45 8%
100% 726
Impact of satisfaction on repurchase
It gets interesting when we look at whether people came back to buy another car,
again broken down by their satisfaction levels
Dealer
satisfaction
level
Satisfaction by
level
Vehicles sold % customers
who bought
next car at
same dealer
Cars sold
based on
loyalty
projections
Completely
satisfied
47% 343 52% 179
Very satisfied 23% 169 41% 69
Fairly satisfied 16% 119 25% 30
Dissatisfied 7% 49 4% 2
Very
dissatisfied
6% 45 8% 4
100% 726 283
Impact of satisfaction on repurchase
So across the industry, around 40% repurchase, heavily skewed towards the most
satisfied customers
What happens if we move customers up
one level on dealer satisfaction?
This is the same data for satisfaction from previous charts
Dealer
satisfaction
level
Satisfaction
by level
Completely
satisfied
47%
Very
satisfied
23%
Fairly
satisfied
16%
Dissatisfied 7%
Very
dissatisfied
6%
100%
What happens if we move customers up
one level on dealer satisfaction?
All we are doing is assuming that each owner moves up one satisfaction band: very
satisfied owners become completely satisfied etc
Dealer
satisfaction
level
Satisfaction
by level
Satisfaction
by level
Completely
satisfied
47% 71%
Very
satisfied
23% 16%
Fairly
satisfied
16% 7%
Dissatisfied 7% 6%
Very
dissatisfied
6% 0%
100% 100%
What happens if we move customers up
one level on dealer satisfaction?
The number of cars sold in each satisfaction band is the same as we saw on previous
charts
Dealer
satisfaction
level
Satisfaction
by level
Satisfaction
by level
Vehicles
sold
Completely
satisfied
47% 71% 343
Very
satisfied
23% 16% 169
Fairly
satisfied
16% 7% 119
Dissatisfied 7% 6% 49
Very
dissatisfied
6% 0% 45
100% 100% 726
What happens if we move customers up
one level on dealer satisfaction?
As is the proportion repurchasing in each band. All that has changed is the level of
satisfaction scored
Dealer
satisfaction
level
Satisfaction
by level
Satisfaction
by level
Vehicles
sold
% customers
who bought
next car at
same dealer
Completely
satisfied
47% 71% 343 52%
Very
satisfied
23% 16% 169 41%
Fairly
satisfied
16% 7% 119 25%
Dissatisfied 7% 6% 49 4%
Very
dissatisfied
6% 0% 45 8%
100% 100% 726
What happens if we move customers up
one level on dealer satisfaction?
Dealer
satisfaction
level
Satisfaction
by level
Satisfaction
by level
Vehicles
sold
% customers
who bought
next car at
same dealer
Cars sold
based on
loyalty
projections
Completely
satisfied
47% 71% 343 52% 266
Very
satisfied
23% 16% 169 41% 49
Fairly
satisfied
16% 7% 119 25% 12
Dissatisfied 7% 6% 49 4% 2
Very
dissatisfied
6% 0% 45 8% 0
100% 100% 726 329
Because completely satisfied owners are more likely to come back, the impact on
repurchase loyalty is huge
Additional units sold * profit per unit = sales uplift
+
Additional units sold * service profit per unit = service uplift
Last time we ran this study in 2012, this amounted to
$106,315 additional profit per dealer per year
Doing the maths
1050
1100
1150
1200
1250
1300
1350
0
10
20
30
40
50
60
70
80
90
100
Bottom  20% Top  20%
Impact of NPS on GP per
vehicle - sales
NPS GP
European data point the same way
0
200
400
600
800
1000
1200
0
10
20
30
40
50
60
70
80
90
Bottom  20% Top  20%
Impact of NPS on GP per
vehicle - service
NPS GP
What does the
future look like?
A disconnect in what we do today?
Customer  wants  this We  tend  to  do  this
So if customer experience is the next
battleground what might it look like?
Customer CX  Manager/Provider
On my terms
In my voice
Relationship, not surveys
What’s in it for me?
Omni channel
Text Driven
4 questions not 44
Breaking the MRS taboo’s?
• Of course CATI, SMS, mobile, tablet, PC, even postal
• Outbound and inbound
• Social media integrated
But also…
• Location triggered interaction when leaving the
dealership?
• Using the in car technology and your intimate knowledge
of the customer
Omni channel
• Driving characteristics
• Where driven
• How driven
• Regular routes taken
• Used at weekends?
• Used for vacations?
• etc
The opportunities for Big Data and individualised customer
engagement are enormous
As OEMs you have (the potential) to know
Real-­time  customer  engagement
Opportunity to use in car technology
• Increasingly it is all about
MY story
• Text analyticsis already
becoming a key driver for
understanding both survey
and social data
• Machine coding accuracy
now approaching human
coding
Text driven
4 questions
not 44
4 questions not 44
Make  the  survey  shorter!
• Don’t ask things you (should) already know
• Don’t ask about your internal processes – use
mystery shopping or internal audits for that
• Don’t try to cover everything in one go
• Do ask relationship questions – emotions are at
least 3x better determinant of loyalty
• Do put open questions front and centre
4 questions not 44
Nearly 80% of Customers Will Provide Personal Information
to a “Trusted Brand”
Many of us will trade…
Source:  SDL  Data  and  Privacy  Study  2014
What if this is what the customer wants?
Customers want a relationship with the brand. We should not go dark but provide
engagement throughout the ownership lifecycle – sharing and receiving data
• A non-research purpose is when data is collected for reasons other
than to enhance understanding in a robust way
• Generally non-research exercises have one or more of the following
characteristics:
– If the data is collected on an identifiable basis, direct action will, or may,
be taken.
– The exercise promotes the aims or ideals of a client or organisation
– The exercise promotes the products or services of a client or
organisation.
• Source: MRS Regulations for Using Research Techniques for Non-
Research Purposes, 2010
The MRS guidelines actively disallow this
type of customer engagement
• A 2-way relationship with the Brand where research, CRM and
“something for something” brings them a genuinely enhanced
experience?
• Where we operate with ethics and governance in place, but without
the firm delineation of research and “other”
What if that is exactly what
customers want?
In Summary
• CX is the next frontier.
• CX does drive business outcomes including loyalty.
• The world of customer feedback and expectations has
changed more in the last 3 years than previous 30.
• The changing consumer wants something that
traditional CX research potentially stands in the way of.
• Perhaps its time to rethink and reinvent how we as an
industry engage with this changing customer world?
Loyalty and CX are changing
Thank  You!
For more interesting ideas about
CX, please visit, CX Café.
cxcafe.maritzcx.com

Customer Experience is the Next Frontier

  • 1.
  • 2.
    Its all aboutproduct…right? NO. The experience the company delivers is now the focal point in automotive.
  • 3.
    89% of companies planto compete primarily on the basis of the customer experience by 2016 Source: Gartner
  • 4.
    Despite continual heavyR&D investment… Product parity is increasingly the norm Features can be copied easily and quickly Which means that, as time goes by, there is no such thing as a ‘bad’ product Why is Customer Experience the differentiator?
  • 5.
    In an industrywhere customers are increasingly conditioned to believe that disloyalty is the norm.. Customer experience and brand are inextricably linked “this is how I expect to be treated by a brand like yours” Why is Customer Experience the differentiator?
  • 6.
    Great customer experience… doesit really make a difference?
  • 7.
    When the goinggets tough – a lesson from history 0 2 4 6 8 10 12 14 16 91  to  100 81  to  90 71  to  80 61  to  70 51  to  60 41  to  50 31  to  40 21  to  30 11  to  20 0  to  10 %dealersgoingoutofbusiness2008 Satisfaction  percentiles Dealers going out of business in the recessionby sat levels sales Service Bottom 10% 3X more likely to go out of business than top 10% in sales;1.5x in aftersales
  • 8.
    Impact of satisfactionon repurchase Intuitively we believe that more satisfied customers are more likely to repurchase. This data is from the US NVCS dataset Dealer satisfaction level Satisfaction by level Completely satisfied 47% Very satisfied 23% Fairly satisfied 16% Dissatisfied 7% Very dissatisfied 6% 100%
  • 9.
    Dealer satisfaction level Satisfaction by level Vehicles sold Completely satisfied 47%343 Very satisfied 23% 169 Fairly satisfied 16% 119 Dissatisfied 7% 49 Very dissatisfied 6% 45 100% 726 Impact of satisfaction on repurchase Across  the  industry  we  can  see  the  split  of  cars  bought  across  the  satisfaction   bands
  • 10.
    Dealer satisfaction level Satisfaction by level Vehicles sold% customers who bought next car at same dealer Completely satisfied 47% 343 52% Very satisfied 23% 169 41% Fairly satisfied 16% 119 25% Dissatisfied 7% 49 4% Very dissatisfied 6% 45 8% 100% 726 Impact of satisfaction on repurchase It gets interesting when we look at whether people came back to buy another car, again broken down by their satisfaction levels
  • 11.
    Dealer satisfaction level Satisfaction by level Vehicles sold% customers who bought next car at same dealer Cars sold based on loyalty projections Completely satisfied 47% 343 52% 179 Very satisfied 23% 169 41% 69 Fairly satisfied 16% 119 25% 30 Dissatisfied 7% 49 4% 2 Very dissatisfied 6% 45 8% 4 100% 726 283 Impact of satisfaction on repurchase So across the industry, around 40% repurchase, heavily skewed towards the most satisfied customers
  • 12.
    What happens ifwe move customers up one level on dealer satisfaction? This is the same data for satisfaction from previous charts Dealer satisfaction level Satisfaction by level Completely satisfied 47% Very satisfied 23% Fairly satisfied 16% Dissatisfied 7% Very dissatisfied 6% 100%
  • 13.
    What happens ifwe move customers up one level on dealer satisfaction? All we are doing is assuming that each owner moves up one satisfaction band: very satisfied owners become completely satisfied etc Dealer satisfaction level Satisfaction by level Satisfaction by level Completely satisfied 47% 71% Very satisfied 23% 16% Fairly satisfied 16% 7% Dissatisfied 7% 6% Very dissatisfied 6% 0% 100% 100%
  • 14.
    What happens ifwe move customers up one level on dealer satisfaction? The number of cars sold in each satisfaction band is the same as we saw on previous charts Dealer satisfaction level Satisfaction by level Satisfaction by level Vehicles sold Completely satisfied 47% 71% 343 Very satisfied 23% 16% 169 Fairly satisfied 16% 7% 119 Dissatisfied 7% 6% 49 Very dissatisfied 6% 0% 45 100% 100% 726
  • 15.
    What happens ifwe move customers up one level on dealer satisfaction? As is the proportion repurchasing in each band. All that has changed is the level of satisfaction scored Dealer satisfaction level Satisfaction by level Satisfaction by level Vehicles sold % customers who bought next car at same dealer Completely satisfied 47% 71% 343 52% Very satisfied 23% 16% 169 41% Fairly satisfied 16% 7% 119 25% Dissatisfied 7% 6% 49 4% Very dissatisfied 6% 0% 45 8% 100% 100% 726
  • 16.
    What happens ifwe move customers up one level on dealer satisfaction? Dealer satisfaction level Satisfaction by level Satisfaction by level Vehicles sold % customers who bought next car at same dealer Cars sold based on loyalty projections Completely satisfied 47% 71% 343 52% 266 Very satisfied 23% 16% 169 41% 49 Fairly satisfied 16% 7% 119 25% 12 Dissatisfied 7% 6% 49 4% 2 Very dissatisfied 6% 0% 45 8% 0 100% 100% 726 329 Because completely satisfied owners are more likely to come back, the impact on repurchase loyalty is huge
  • 17.
    Additional units sold* profit per unit = sales uplift + Additional units sold * service profit per unit = service uplift Last time we ran this study in 2012, this amounted to $106,315 additional profit per dealer per year Doing the maths
  • 18.
    1050 1100 1150 1200 1250 1300 1350 0 10 20 30 40 50 60 70 80 90 100 Bottom  20% Top 20% Impact of NPS on GP per vehicle - sales NPS GP European data point the same way 0 200 400 600 800 1000 1200 0 10 20 30 40 50 60 70 80 90 Bottom  20% Top  20% Impact of NPS on GP per vehicle - service NPS GP
  • 19.
  • 20.
    A disconnect inwhat we do today? Customer  wants  this We  tend  to  do  this
  • 21.
    So if customerexperience is the next battleground what might it look like? Customer CX  Manager/Provider On my terms In my voice Relationship, not surveys What’s in it for me? Omni channel Text Driven 4 questions not 44 Breaking the MRS taboo’s?
  • 22.
    • Of courseCATI, SMS, mobile, tablet, PC, even postal • Outbound and inbound • Social media integrated But also… • Location triggered interaction when leaving the dealership? • Using the in car technology and your intimate knowledge of the customer Omni channel
  • 23.
    • Driving characteristics •Where driven • How driven • Regular routes taken • Used at weekends? • Used for vacations? • etc The opportunities for Big Data and individualised customer engagement are enormous As OEMs you have (the potential) to know
  • 24.
  • 25.
    • Increasingly itis all about MY story • Text analyticsis already becoming a key driver for understanding both survey and social data • Machine coding accuracy now approaching human coding Text driven
  • 26.
  • 27.
    4 questions not44 Make  the  survey  shorter!
  • 28.
    • Don’t askthings you (should) already know • Don’t ask about your internal processes – use mystery shopping or internal audits for that • Don’t try to cover everything in one go • Do ask relationship questions – emotions are at least 3x better determinant of loyalty • Do put open questions front and centre 4 questions not 44
  • 29.
    Nearly 80% ofCustomers Will Provide Personal Information to a “Trusted Brand” Many of us will trade… Source:  SDL  Data  and  Privacy  Study  2014
  • 30.
    What if thisis what the customer wants? Customers want a relationship with the brand. We should not go dark but provide engagement throughout the ownership lifecycle – sharing and receiving data
  • 31.
    • A non-researchpurpose is when data is collected for reasons other than to enhance understanding in a robust way • Generally non-research exercises have one or more of the following characteristics: – If the data is collected on an identifiable basis, direct action will, or may, be taken. – The exercise promotes the aims or ideals of a client or organisation – The exercise promotes the products or services of a client or organisation. • Source: MRS Regulations for Using Research Techniques for Non- Research Purposes, 2010 The MRS guidelines actively disallow this type of customer engagement
  • 32.
    • A 2-wayrelationship with the Brand where research, CRM and “something for something” brings them a genuinely enhanced experience? • Where we operate with ethics and governance in place, but without the firm delineation of research and “other” What if that is exactly what customers want?
  • 33.
  • 34.
    • CX isthe next frontier. • CX does drive business outcomes including loyalty. • The world of customer feedback and expectations has changed more in the last 3 years than previous 30. • The changing consumer wants something that traditional CX research potentially stands in the way of. • Perhaps its time to rethink and reinvent how we as an industry engage with this changing customer world? Loyalty and CX are changing
  • 35.
    Thank  You! For moreinteresting ideas about CX, please visit, CX Café. cxcafe.maritzcx.com