Recommended

Recommended
More Related Content
What's hot
What's hot (17)
Similar to curepsp poster
Similar to curepsp poster (20)
curepsp poster
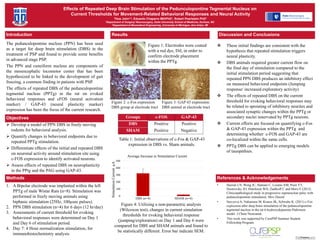
- 1. Effects of Repeated Deep Brain Stimulation of the Pedunculopontine Tegmental Nucleus on Current Thresholds for Movement-Related Behavioral Responses and Neural Activity Titus John1,2, Eduardo Chaparro MD/PhD1, Robert Pearlstein PhD1 1Department of Surgery/ Neurosurgery, Duke University School of Medicine, Durham, NC 2Department of Biomedical Engineering, University of Michigan, Ann Arbor, MI Introduction The pedunculopontine nucleus (PPN) has been used as a target for deep brain stimulation (DBS) in the treatment of PSP and found to provide some benefits in advanced stage PSP. The PPN and cuneiform nucleus are components of the mesencephalic locomotor center that has been hypothesized to be linked to the development of gait freezing, a common finding in patients with PSP. The effects of repeated DBS of the pedunculopontine tegmental nucleus (PPTg) in the rat on evoked behavioral responses and cFOS (neural activation marker) / GAP-43 (neural plasticity marker) expression has been the focus of the current research. Objectives Develop a model of PPN DBS in freely moving rodents for behavioral analysis. Quantify changes in behavioral endpoints due to repeated PPTg stimulation. Differentiate effects of the initial and repeated DBS on neuronal activity around stimulation site using c-FOS expression to identify activated neurons. Assess effects of repeated DBS on neuroplasticity in the PPtg and the PAG using GAP-43. Methods 1. A Bipolar electrode was implanted within the left PPTg of male Wistar Rats (n=8). Stimulation was performed in freely moving animals using biphasic stimulation (25Hz, 100µsec pulses). 2. PPN DBS stimulation (n=4) for 6 days (12 hr/day) 3. Assessments of current threshold for evoking behavioral responses were determined on Day 1 and Day 6 of stimulation period. 4. Day 7: 4 Hour normalization stimulation, for immunohistochemistry analysis • Hazrati LN, Wong JC, Hamani C, Lozano AM, Poon YY, Dostrovsky JO, Hutchison WD, Zadikoff C and Moro E (2012) Clinicopathological study in progressive supranuclear palsy with pedunculopontine stimulation. Mov Disord. • Saryyeva A, Nakamura M, Krauss JK, Schwabe K. (2011) c-Fos expression after deep brain stimulation of the pedunculopontine tegmental nucleus in the rat 6-hydroxydopamine Parkinson model. J Chem Neuroanat. • This work was supported by CurePSP Summer Student Fellowship Program. Discussion and Conclusions These initial findings are consistent with the hypothesis that repeated stimulation triggers neural plasticity. DBS animals required greater current flow on the final day of stimulation compared to the initial stimulation period suggesting that repeated PPN DBS produces an inhibitory effect on measured behavioral endpoints (Jumping response/ increased exploratory activity) The effects of repeated DBS on the current threshold for evoking behavioral responses may be related to sprouting of inhibitory neurites and associated synaptic changes within the PPTg or secondary nuclei innervated by PPTg neurons. Current efforts are focused on quantifying c-Fos & GAP-43 expression within the PPTg and determining whether c-FOS and GAP-43 are co-localized within the same cells. PPTg DBS can be applied to emerging models of tauopathies. References & Acknowledgements Figure 4: Utilizing a non-parametric analysis (Wilcoxon test), changes in current simulation thresholds for evoking behavioral response (jumping/exploration) on Day 1 and Day 6 were compared for DBS and SHAM animals and found to be statistically different. Error bar indicate SEM. Figure 2: c-Fos expression DBS group at electrode tract Figure 3: GAP 43 expression DBS animal at electrode tract Results Figure 1: Electrodes were coated with a red dye, DiI, in order to confirm electrode placement within the PPTg. Groups c-FOS GAP-43 DBS Positive Positive SHAM Positive Negative Table 1: Initial observations of c-Fos & GAP-43 expression in DBS vs. Sham animals. 0 100 200 300 400 500 StimulationCurrentµA DBS (n=4) SHAM (n=4) Average Increase in Stimulation Current