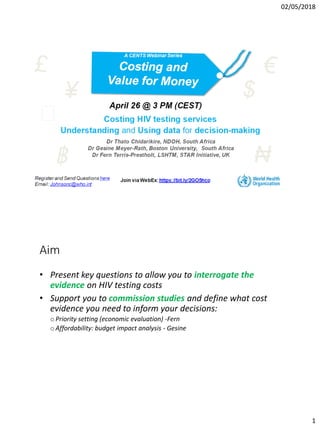
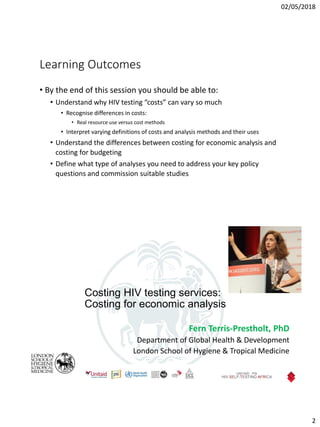
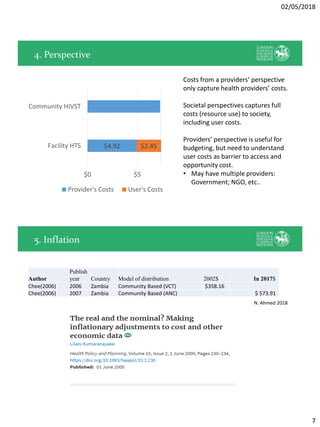
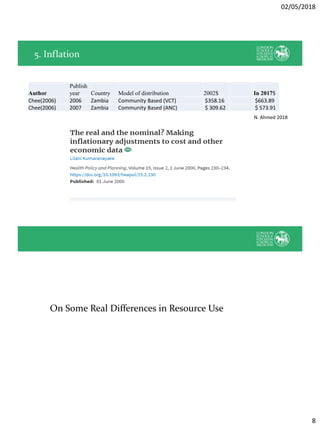
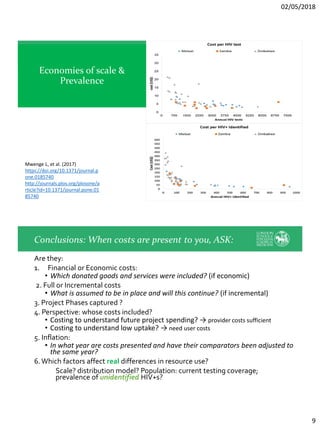
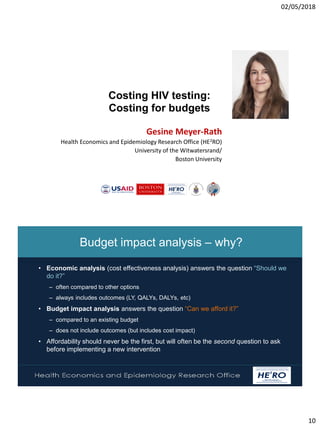
This document discusses costing methods for HIV testing services. It aims to present key questions to interrogate cost evidence and support commissioning cost studies. The learning outcomes are to understand why HIV testing costs vary, recognize different cost definitions and analysis methods, and define what type of analyses are needed to address policy questions. It discusses financial vs. economic costs, full vs. incremental costs, project phases, perspectives, and inflation. Real differences in resource use can be due to scale, distribution model, population characteristics, and prevalence. The appropriate costing method depends on the question being asked - economic evaluation focuses on should we do it? while budget impact analysis addresses can we afford it?
![02/05/2018
12
Health Economics and Epidemiology Research Office
Wits Health Consortium
University of the Witwatersrand
HE RO
2
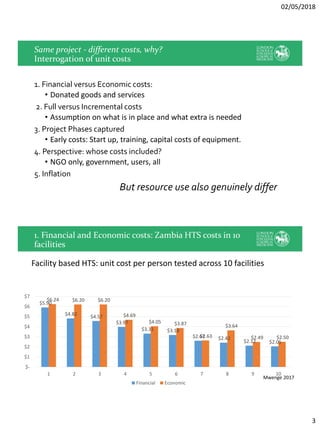
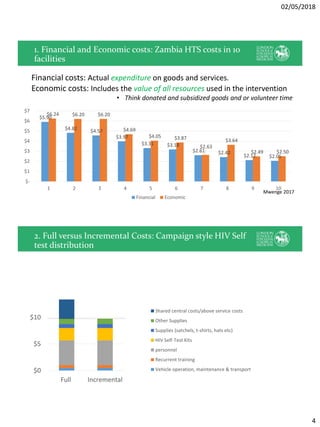
Example: Costing for economic evaluation
Total cost[2016 US$] Cost per test distributed [2016 US$]
Start-up costs
Training 8,349 $0.06
Sensitisation 64,586 $0.47
Start-up other 107,283 $0.78
Capital costs
Building & storage 12,662 $0.09
Equipment 16,660 $0.12
Vehicles and bicycles 3,095 $0.02
Total costs (capital and start-up) 212,635 $1.54
Recurrent costs
Personnel 217,519 $1.58
HIV self-test kits 347,038 $2.40
Supplies 33,685 $0.24
Vehicles 98,826 $0.72
Buildings 1,795 $0.01
Recurrent training 13,135 $0.10
Other recurrent 95,730 $0.69
Total costs (recurrent) 807,729 $5.74
Total HIVST costs 1,020,364 $7.28
Health Economics and Epidemiology Research Office
Wits Health Consortium
University of the Witwatersrand
HE RO
2
Assuming
• same target population
and coverage as in original
cost analysis
• Budget holder (government)
does not pay for test kits
• Initial training is repeated
every three years
• Other capital costs have a
useful life of 5 years
(beyond budget cycle)
Annual cost 2019/20 2020/21 2021/22 2022/23
Start-up costs
Training 10,019 30,057 - - 30,057
Sensitisation 77,504 232,511 - - -
Start-up other 128,739 386,218 - - -
Capital costs
Building & storage 15,194 75,970 - - -
Equipment 19,992 99,960 - - -
Vehicles and bicycles 3,714 18,568 - - -
Total capital/ start-up costs 255,162 843,286 - - 30,057
Recurrent costs
Personnel 261,023 261,023 261,023 261,023 261,023
HIV self-test kits 416,445 - - - -
Supplies 40,423 40,423 40,423 40,423 40,423
Vehicles 118,591 118,591 118,591 118,591 118,591
Buildings 2,155 2,155 2,155 2,155 2,155
Recurrent training 15,762 15,762 15,762 15,762 15,762
Other recurrent 114,876 114,876 114,876 114,876 114,876
Total costs (recurrent) 969,275 969,275 969,275 969,275 969,275
Total HIVST costs 1,224,437 1,812,560 969,275 969,275 999,332
Example: Costing for budget impact analysis](https://image.slidesharecdn.com/2018april26whocostwebinar-finalwreadinglist-180502140944/85/Costing-HIV-testing-services-understanding-and-using-data-for-decision-making-12-320.jpg)