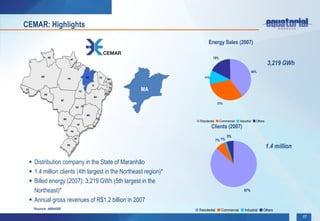
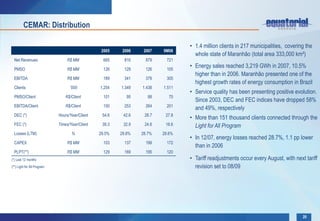
Institutional
         Presentation


October, 2008

                        1
Agenda


 ►Company Profile

 ►Financial Performance


 ►Portfolio Overview

 ►Value Creation


                          2
Agenda


 ►Company Profile

 ►Financial Performance


 ►Portfolio Overview

 ►Value Creation


                          3
Equatorial Overview
                                                                                                                                  RR         AP


                                                                                                                             AM                            MA         CE
      Holding company with investments in the energy sector, focused on distribution and generation
                                                                                                                                            PA
                                                                                                                                                               PI
                                                                                                                                                                            RN
                                                                                                                                                                             PB
                                                                                                                                                                             PE
                                                                                                                       AC
                                                                                                                                                      TO                    AL
                                                                                                                               RO                                          SE

     Differentiated experience in operating and financial restructuring of companies in the Brazilian energy sector                   MT
                                                                                                                                                                 BA

                                                                                                                                                  GO DF


     Controlled by PCP Fund, investment vehicle owned by former partners of Banco Pactual (sold in 2006 to UBS)                        MS
                                                                                                                                                           MG
                                                                                                                                                                     ES
                                                                                                                                                  SP            RJ

      Current investments:
                                                                                                                                             PR
                                                                                                                                                SC
                                                                                                                                            RS


                                                               Geranorte

• Distribution company in the State of             • Company responsible for implementing                 • Holding company with investments in
  Maranhão                                           and operating the Tocantinópolis and                   distribution, generation and trading.
                                                     Nova Olinda thermoelectric plants in the               Located in the State of Rio de Janeiro
• 2nd largest distribution company in the
                                                     State of Maranhão
  Northeast of Brazil, in terms of                                                                        • 3rd largest distribution company of Brazil in
  concession area*                                 • Fuel: high-viscosity heavy oil.                        terms of billed energy*

• 4th largest distribution company in the          • Joint installed capacity of 331 MW                   • 4th largest customer base in Brazil*
  Northeast of Brazil, in terms of billed
                                                   • 240 MW of energy sold at the A-3 auction             • 852 MW of installed capacity
  energy*
                                                     in 2007.
                                                                                                          • Annual gross revenues of R$8.1 billion in
• Annual gross revenues of R$1.2 billion in
                                                   • Start-up scheduled for January 2010                    2007
  2007
                                                   *Source: ABRADEE


                                                                                                                                                                     4
Equatorial’s History


                     PCP Fund acquires a
                                                        Control concentrated in              Equatorial migrates to
                      controlling stake of
                                                              PCP Fund                        the “Novo Mercado”
                          Equatorial


      May 2004           Mar. 2006      Apr. 2006         Dec. 2007        Feb. 2008           Apr. 2008        Oct. 2008


                                                                       Incorporation of a                  Acquisition of 25% of
    CEMAR’s acquistion               Equatorial’s IPO                 controlling stake of                      Geranorte
                                                                             Light


                                                                                                                                   5
Ownership Structure


                          PCP Latin America
                              Power S.A.       •    Total no. of shares:   105,638,030
                                               •    Share price*:          R$ 11,50
                                               •    Free float:            44.4% / R$540 MM
                                     55.5%
                                               •    ADTV90:                R$2,8 MM
                          Equatorial Energia
                                                                           * On 09/30/2008


               25.0%
           RME
    Rio Minas e Energia
       Participações SA
               52.1%                65.1%                 25.0%


      Light S.A.               CEMAR               Geranorte                New Projects


                                                                                              6
Corporate Strategy


                              Increased returns through outstanding financial and
   CEMAR and Light             operating performance


    Consolidation of          Acquistion of full or shared control
distributors in Brazil and
                              Added value through financial and operational restructuring, synergy
      Latin America
                               gains and loss reduction


  Geranorte and other         Brazil’s investment needs in generation over the next few years will create
    investments in             growth opportunities for Equatorial.
      generation
                              Geranorte thermal plants present an above average rate of return

                                                                                                       7
Management

Management is composed by professionals with substantial experience in the financial, operational and regulatory areas


  Firmino Sampaio       • CEO of Eletrobrás (1996-2001), CEO and CFO of COELBA (1984-1996)

Chairman of the Board   • Member of the boards of directors of Furnas, Itaipu Binacional, CHESF, Eletrosul, Gerasul, CEMIG, ENERSUL, CEMAT and Light
     of Directors       • Degree in Economics from the Federal University of Bahia and postgraduate degree in Industrial Planning from SUDENE/IPEA/FGV


                        • CEO of Equatorial since March, 2007. CEO and CFO of CEMAR (2004-2006)
    Carlos Piani        • Worked for 6 years at Banco Pactual in the Principal Investments and Corporate Finance divisions
        CEO             • Degree in Computer Science from PUC-RJ and in Business Administration from IBMEC. CFA chartered by CFA Institute in 2003. Concluded the Owner and
                          President Management Program of Harvard Business School in 2008


                        • CFO and IRO of Equatorial since 2008. IRO of CEMAR since 2008.
  Eduardo Haiama
                        • Between 2004 and 2008, Mr. Haiama worked at Banco UBS Pactual on the equities’ research team as senior analyst of the utilities segment.
     CFO & IRO
                        • Received a degree in electric engineering at USP – University of São Paulo (Escola Politécnica) and postgraduated at a MBA Course at Duke University.


                        • Regulatory Affairs Officer of Equatorial since April 2008 and of CEMAR since August 2006
     Tinn Amado         • Consulting partner of Amado Consultoria, providing advisory services in economic regulation
  Regulatory Affairs    • Worked at ANEEL for 3 years as an analyst for the Distribution Service Regulation Department
       Officer          • Degree in Electrical Engineering from the Federal University of Itajubá (UNIFEI) and a Master’s degree in Regulation and Protection of Fair Trading from Brasília
                          University (UnB)


                                                                                                                                                                                   8
PCP Fund


                     History

•   In 2001, Banco Pactual created a Principal
    Investment Unit to manage the partnership’s                                   PCP Fund
    excess capital and diversify its investments
                                                         Long Term           Hedge Funds Brazil
•   In 2006, with the sale of Banco Pactual to UBS,                                                  Fund of Funds (G7)
                                                        Investments               and EM
    part of the proceeds from the sale was reinvested
    in the Principal Investment Unit, which was                                        • Fundamental and long-only
    renamed UBS Pactual Alternative Investments                   Public Equities
                                                                                       strategy

                                                                                       • Acquisition of control or shared
•   Today, UBS Pactual Alternative Investments                                         control of private and public
                                                                      Private Equity
    manages the capital of Pactual’s former                                            companies (Ex: Iven, Light,
    partners through a major fund of funds entitled                                    Equatorial)
    PCP, formerly named Pactual Capital Partners
                                                                       Real Estate     • Investments through PCP’s
                                                                                       associated company PDG Realty
•   PCP has over US$3 billion under management
    with investments in fund of funds, hedge funds,
    public equities, private equity and real estate

                                                                                                                      9
Agenda


 ►Company Profile

 ►Financial Performance


 ►Portfolio Overview

 ►Value Creation


                          10
Financial Performance

                    Since CEMAR’s acquisition, Equatorial has been presenting an excellent
                                           financial performance


                     Net Operating Revenues                                 EBITDA and Margin EBITDA
                           R$ million                                         R$ million / % of NOR


                             CAGR = 21%                                             CAGR = 42%


                                                                                                          43%
                                                                                                 42%
                                                 879
                                          810
                                                                                                           379
                            629                                               30%                  341
             526
423                                                       22%
                                                                    16%         189

                                                          93         85


2003         2004           2005          2006   2007    2003       2004        2005               2006   2007


                                                                                                            11
Financial Performance
           Sustained positive results allowed Equatorial to pay out R$401 million in
                                           dividends


                Net Income                                        Declared Dividends
                R$ million                                            R$ million


                      229
                                                                                          165
                                                                                                 151

                                            154
          123                    125
                                                                             85


                                                     2003       2004        2005          2006   2007
2003     2004        2005       2006        2007

(57)                                                               Total = R$401million

                                                                                                   12
Financial Performance
          Improved operating performance and financial restructuring led to a
                           significant reduction in leverage


                                   Consolidated Net Debt and Net
                                           Debt/EBITDA
                                           R$ million / Times


              627


               6.7

                             339
                                                 305
                             4.0                                          225
                                                  1.6
                                                                   105    0.6
                                                                   0.3

              2003           2004                2005              2006   2007


                                                                                 13
Financial Performance
            Light’s incorporation in the 1Q08 substantially increased Equatorial’s operating result…

                                              Quarterly EBITDA and EBITDA Margin
                                                 R$ million/% of Net Revenues
250
                                                                                   48%
                                                                                                45%      45%
                      Growth
                   (3Q08/3Q07)                                                                                                                 208
                     = 100%                   42%          39%           44%
200                                                                                                              43%
                                                                                         39%                                          173
                                                                                                                             165
                                                                  36%
                                        28%                                                                                                  36%
150                                                                                                                    29%
                                                                                                                                    32%
                          24%
                                                                         109
                                    24%                                                                  104       104
                                                                                98                93
100 18%
                    20%                                                                  77
                                                    68     67     65
                                         47
    50                           36
                   31     34
            24


-
            3Q04


                   4Q04


                          1Q05


                                 2Q05


                                         3Q05


                                                    4Q05


                                                           1Q06


                                                                  2Q06


                                                                         3Q06


                                                                                4Q06


                                                                                         1Q07


                                                                                                  2Q07


                                                                                                          3Q07


                                                                                                                   4Q07


                                                                                                                             1Q08


                                                                                                                                      2Q08


                                                                                                                                               3Q08
                                                                                                                                                      14
Financial Performance
                                              …without affecting financial leverage

                                                      Consolidated Net Debt and Net Debt /
                                                                    EBITDA
900
                                                                       R$ million / Times
       3,9                                                                                                                     806
800                    4,0
                                       2,4                                                                                           749
                                                      1,5                                   0,6                         0,6       1,1
               3,3             3,0                                       0,3                              0,7
700                                           1,6
                                                               0,7                0,3              0,5           0,9      1,3
                                                                                                                        582
600

500

400    382             373 385 360
               339                                     332
                                              305
300                                                                                                242 244 225
                                                               180                          176
200
                                                                          105 105
100

-
        3Q04

                4Q04

                        1Q05

                                2Q05

                                       3Q05

                                               4Q05

                                                        1Q06

                                                                2Q06

                                                                          3Q06

                                                                                    4Q06

                                                                                            1Q07

                                                                                                   2Q07

                                                                                                          3Q07

                                                                                                                 4Q07

                                                                                                                        1Q08

                                                                                                                               2Q08

                                                                                                                                      3Q08
                                                                                                                                             15
Agenda


 ►Company Profile

 ►Financial Performance


 ►Portfolio Overview

 ►Value Creation


                          16
CEMAR: Highlights

                                                                                            Energy Sales (2007)

                RR
                                   AP
                                                                                                18%
                                                                                                                                            3,219 GWh
                                                                                                                                 40%
         AM                                       MA             CE                      11%
                              PA                                       RN
                                                                           PB
                                                       PI
AC
                                             TO
                                                                            PE
                                                                           AL    MA
           RO                                                         SE
                                                        BA
                        MT
                                                                                                     31%
                                        GO DF


                                                  MG
                         MS                                 ES
                                                                                      Residential     Commercial    Industrial     Others
                                         SP            RJ
                                                                                               Clients (2007)
                                   PR

                                                                                                            5%
                                                                                                    7% 1%
                                        SC

                              RS
                                                                                                                                            1.4 million

  Distribution company in the State of Maranhão
  1.4 million clients (4th largest in the Northeast region)*
  Billed energy (2007): 3,219 GWh (5th largest in the
   Northeast)*                                                                                                         87%

  Annual gross revenues of R$1.2 billion in 2007
     *Source: ABRADEE                                                                 Residential      Commercial       Industrial      Others
                                                                                                                                                          17
CEMAR: History


                               CEMAR under PPL Global’s                 CEMAR under control of
                                       control                               Equatorial


              1958-                 Aug.2000-        Aug.2002-May        May 2004-
            Jun. 2000               Aug.2002             2004             Present


                 State owned                     ANEEL’s intervention


                                                                                                 18
CEMAR: Ownership Structure


          Eletrobrás         Equatorial Energia
          Eletrobrás         Equatorial Energia   Others


               33.6%                 65.1%           1.2%


                                  CEMAR


                                                            19
CEMAR: Distribution

                                                                                 • 1.4 million clients in 217 municipalities, covering the
                                                  2005    2006    2007   9M08
                                                                                   whole state of Maranhão (total area 333,000 km²)
  Net Revenues                    R$ MM            665     810     879     721

  PMSO                            R$ MM            126     129     126     105
                                                                                 • Energy sales reached 3,219 GWh in 2007, 10.5%
                                                                                   higher than in 2006. Maranhão presented one of the
  EBITDA                          R$ MM            189     341     379     305
                                                                                   highest growth rates of energy consumption in Brazil
  Clients                          '000          1.254   1.349   1.438   1.511
                                                                                 • Service quality has been presenting positive evolution.
  PMSO/Client                    R$/Client         101      95      88      70
                                                                                   Since 2003, DEC and FEC indices have dropped 58%
  EBITDA/Client                  R$/Client         150     253     264     201
                                                                                   and 49%, respectively
  DEC (*)                    Hours/Year/Client    54.6    42.6    28.7    27.8
                                                                                 • More than 151 thousand clients connected through the
  FEC (*)                    Times/Year/Client    39.3    32.9    24.6    18.6     Light for All Program
  Losses (LTM)                      %            29.5%   29.8%   28.7%   28.6%
                                                                                 • In 12/07, energy losses reached 28.7%, 1.1 pp lower
  CAPEX                           R$ MM            103     137     199     172
                                                                                   than in 2006
  PLPT(**)                        R$ MM            129     169     195     120
(*) Last 12 months                                                               • Tariff readjustments occur every August, with next tariff
(**) Light for All Program                                                         revision set to 08/09


                                                                                                                                     20
Light S.A.: Highlights
                                                                                  Energy Sales (2007)
                                                                                         7,5%
               RR
                             AP
                                                                               11,0%                                            18,307 GWh
          AM                                    MA         CE
                                                                                                                     40,1%
                            PA                                   RN
                                                                   PB
                                                     PI
                                                                   PE
AC
                                           TO                     AL
            RO                                                  SE
                                                      BA
                      MT

                                      GO DF
                                                                                 31,4%

                                                MG
                       MS                                 ES

                                       SP            RJ

                                 PR                                        Residential   Commercial    Industrial      Others
                                      SC                                     EBITDA by Segment (2007)
                            RS                                                                  0,3%
                                                                                    15,2%


                                                                                                                                R$1.1 billion
    Holding company with distribution, generation and trading interests
    3rd largest distributor in Brazil in terms of energy sales*
    4th largest customer base in Brazil*
    Generation plants with 852 MW of installed capacity
    Gross revenues of more than R$8 billion in 2007                                                         84,5%


      *Source: ABRADEE and Light
                                                                                 Distribution   Generation     Trading
                                                                                                                                        21
Light S.A.: History


                              Acquisition by                            Eletropaulo’s                      Acquisiton by EDF
                               Eletrobrás                                                                                                               RME acquires
                                                                         acquistion
                                                                                                                                                       control of Light


        1905                  1979              May 1996             Apr. 1998           Oct.2001             Jan.2002            Jul.2005            Aug. 2006


                                                                                                                               Light joined
    Creation of Light, a                 Light’s Privatization                     Split of EDF-AES                           Bovespa’s Novo
     private Company
                                                                                                                                 Mercado

•       After a negative result in its 2003 tariff revision process and poor management, Light became insolvent and was forced to renegotiate its debt with creditors

•       In March, 2006, a consortium (RME) formed by PCP, Cemig, AG Concessões and Luce Fund won a competitive bidding process for the acquisition of a
        controlling stake at Light

•       The consortium acquired 79.4% of Light’s total and voting capital for US$320 milllion

•       After fulfilling a series of prerequisites, including the approval of regulatory authorities in Brazil and France, the consortium effectively took over the
        company in August, 2006

                                                                                                                                                                      22
Light S.A.: Ownership Structure


           CEMIG                  AGC                                     LUCE
     Companhia Energètica   Andrade Gutierrez
                                                                       LUCE do Brasil                               EQTL
                                                                    Fundo de Investimento                       Equatorial Energia
         de Minas Gerais         Concessões
                                                                      em Participações
                  25.0%                25.0%                                    25.0%                                     25.0%


                                                     RME
                                                Rio Minas Energia
                                                Participações S.A
                                                                                            Free Float: 47,8%
                                                         52.2%                   33.7%
                                                                                             BNDESPAR
                                                LIGHT S.A.
                                                   (Holding)

                                                                                 14.1%
                                                                                                MARKET


        Light S.E.S.A        Light Energia                          Light EscoLtda                                Lightger
           (Distribution)       (Generation)                              (Trading)                              (New Projects)


                                                                                                                                     23
Light S.A.: Distribution

                                           2005     2006     2007   9M08     • 3.9 million clients in 31 municipalities in Rio de Janeiro,
                                                                               covering 25% of the state, which represents a 10,970 km² area
Net Revenues              R$ MM          4.875    4.743    4.755     3.579
                                                                             • Energy sales reached 18,307 GWh, accounting for
                                                                               approximately 72% of all electricity consumed in the State in
PMSO                      R$ MM           511      533      567       413      2007

EBITDA                    R$ MM           751      599      938       748
                                                                             • Service quality among the highest in Brazil. In the 1H08, the
                                                                               FEC (LTM) index reached 7.8x and the DEC (LTM) index
Clients                    '000          3.732    3.802    3.881     3.741     11.4 h
                                                                             • Collection rate improved significantly after the change in
PMSO/Client              R$/Client        137      140      146       110      control, increasing from 93% in 2006 to 99.4% in 2007
                                                                             • Energy losses, which totaled 20.4% in 2Q08, represent a
EBITDA/Client            R$/Client        201      158      242       199      challenge in the concession area

DEC (*)              Hours/Year/Client     8.8      8.0      9.1      11.5   • The last tariff revision, held in november 2008, Light’s tariff
                                                                               increased by 1.96%
FEC (*)              Times/Year/Client     7.7      6.3      6.3       7.1


Losses                      %            18.7%    19.8%    20.6%    20.4%


CAPEX                     R$ MM           277      322      330       405

(*) Last 12 months

                                                                                                                                                 24
Light S.A.: Generation
                                  2005   2006   2007   9M08   • Light owns and operates 5 hydro power plants
Net Revenues           R$ MM       20    249    271     197     and two water pumping stations
PMSO                   R$ MM        3     55     60      93

EBITDA                 R$ MM       14    147    169     153   • The 5 plants are located in three generation
Assured Capacity        MW        537    537    537     537     regions: Santa Branca, Lajes and Ilha dos
                                                                Pombos
EBITDA/Assured Cap.   R$'000/MW    26    274    314     284


                                                              • Total installed capacity of 852 MW, for assured
                                                                energy of 537 MW

                                                              • Light Generation has average contract selling
                                                                price of R$60/MWh, with the bulk of contracts
                                                                expiring in 2012 and 2013

                                                              • 3 new hydro power plants currently being
                                                                developed: SHP Paracambi (25 MW of
                                                                installed capacity) and SHP Lajes (17 MW) in
                                                                the Lajes complex and HPP Itaocara on the
                                                                Paraíba do Sul River (195 MW)


                                                                                                          25
Light S.A.: Trading


• Through its subsidiary Light Esco, Light acts as a
  trader and broker for free clients

                                                                                      2005   2006   2007   9M08
• In its trading activities, Light has 30 clients with total
  energy sales of 90 GWh in 2007                               Net Revenues   R$ MM      -      4     31        24
                                                               PMSO           R$ MM      -      2      9        22

• Clients include Unilever and InBev                           EBITDA         R$ MM      -      2      4         2


• As a broker, Light has 10 clients, including TV Globo
  and Gerdau Steel and traded 1,200 GWh in 2007


                                                                                                           26
Geranorte: Ownership Structure


                                                                                     Fundo de
                                    GNP*                   Equatorial Energia    Investimento em
                                                                                Participações Brasil


                                        50.0%                      25.0%                  25.0%


                                                               Geranorte


*GNP is composed by Servtech (50%) and Grupo Ligna (50%)


                                                                                                       27
Geranorte: Highlights

   • Two thermoelectric power plants fueled by high-viscosity heavy oil

   • Location: Miranda do Norte, Maranhão.

   • Joint installed capacity of 331 MW

   • 240 MW of energy sold at the A-3 auction in 2007

   • Total fixed annual revenue (for both plants) of R$ 136.2 million, during 15 years

   • Start-up scheduled for January of 2010

   • Total CAPEX: Between R$500 million and R$ 550 million

   • Equatorial’s share of CAPEX (25%): R$125 million. Equity = approximately R$45 million


                                                                                             28
Agenda


 ►Company Profile

 ►Financial Performance


 ►Portfolio Overview

 ►Value Creation


                          29
Strengths


                                    Financial strength and solid
      Growth prospects and              management team with
      consolidation opportunities        turnaround experience


     Result-oriented management                    High level of
     model                               Corporate Governance


                                                                   30
Contacts


                            Carlos Piani
                               CEO

                          Eduardo Haiama
                           CFO and IRO

                         Thomas Newlands
                            IR Analyst

                     Phone 1: 55 21 3206-6635
                     Phone 2: 55 21 3206-6607

                E-mail: ir@equatorialenergia.com.br

           Website: http://www.equatorialenergia.com.br/ir


                                                             31
Disclaimer


► This presentation may contain forward-looking statements, which are subject to risks and uncertainties, as they
  were based on the expectations of Company’s management and on available information. These prospects include
  statements concerning the Company’s current intensions or expectations for our clients.

► Forward-looking statements refer to future events which may or may not occur. Our future financial situation,
  operating results, market share and competitive positioning may differ substantially from those expressed or
  suggested by said forward-looking statements. Many factors and values that can establish these results are
  outside Company’s control or expectation. The reader/investor is prevented not to completely rely on the
  information above.

► The words “believe", “can", “predict", “estimate", “continue", “anticipate", “intend", “forecast" and similar words, are
  intended to identify affirmations. Such estimates refer only to the date in which they were expressed, therefore
  Company has no obligation to update said statements.

► This presentation does not consist of offering, invitation or request of subscription offer or purchase of any
  marketable securities. And, this statement or any other information herein, does not consist of a contract base or
  commitment of any kind.


                                                                                                                        32

Corporate presentation

  • 1.
    Institutional Presentation October, 2008 1
  • 2.
    Agenda ►Company Profile ►Financial Performance ►Portfolio Overview ►Value Creation 2
  • 3.
    Agenda ►Company Profile ►Financial Performance ►Portfolio Overview ►Value Creation 3
  • 4.
    Equatorial Overview RR AP AM MA CE Holding company with investments in the energy sector, focused on distribution and generation PA  PI RN PB PE AC TO AL RO SE  Differentiated experience in operating and financial restructuring of companies in the Brazilian energy sector MT BA GO DF  Controlled by PCP Fund, investment vehicle owned by former partners of Banco Pactual (sold in 2006 to UBS) MS MG ES SP RJ Current investments: PR  SC RS Geranorte • Distribution company in the State of • Company responsible for implementing • Holding company with investments in Maranhão and operating the Tocantinópolis and distribution, generation and trading. Nova Olinda thermoelectric plants in the Located in the State of Rio de Janeiro • 2nd largest distribution company in the State of Maranhão Northeast of Brazil, in terms of • 3rd largest distribution company of Brazil in concession area* • Fuel: high-viscosity heavy oil. terms of billed energy* • 4th largest distribution company in the • Joint installed capacity of 331 MW • 4th largest customer base in Brazil* Northeast of Brazil, in terms of billed • 240 MW of energy sold at the A-3 auction • 852 MW of installed capacity energy* in 2007. • Annual gross revenues of R$8.1 billion in • Annual gross revenues of R$1.2 billion in • Start-up scheduled for January 2010 2007 2007 *Source: ABRADEE 4
  • 5.
    Equatorial’s History PCP Fund acquires a Control concentrated in Equatorial migrates to controlling stake of PCP Fund the “Novo Mercado” Equatorial May 2004 Mar. 2006 Apr. 2006 Dec. 2007 Feb. 2008 Apr. 2008 Oct. 2008 Incorporation of a Acquisition of 25% of CEMAR’s acquistion Equatorial’s IPO controlling stake of Geranorte Light 5
  • 6.
    Ownership Structure PCP Latin America Power S.A. • Total no. of shares: 105,638,030 • Share price*: R$ 11,50 • Free float: 44.4% / R$540 MM 55.5% • ADTV90: R$2,8 MM Equatorial Energia * On 09/30/2008 25.0% RME Rio Minas e Energia Participações SA 52.1% 65.1% 25.0% Light S.A. CEMAR Geranorte New Projects 6
  • 7.
    Corporate Strategy  Increased returns through outstanding financial and CEMAR and Light operating performance Consolidation of  Acquistion of full or shared control distributors in Brazil and  Added value through financial and operational restructuring, synergy Latin America gains and loss reduction Geranorte and other  Brazil’s investment needs in generation over the next few years will create investments in growth opportunities for Equatorial. generation  Geranorte thermal plants present an above average rate of return 7
  • 8.
    Management Management is composedby professionals with substantial experience in the financial, operational and regulatory areas Firmino Sampaio • CEO of Eletrobrás (1996-2001), CEO and CFO of COELBA (1984-1996) Chairman of the Board • Member of the boards of directors of Furnas, Itaipu Binacional, CHESF, Eletrosul, Gerasul, CEMIG, ENERSUL, CEMAT and Light of Directors • Degree in Economics from the Federal University of Bahia and postgraduate degree in Industrial Planning from SUDENE/IPEA/FGV • CEO of Equatorial since March, 2007. CEO and CFO of CEMAR (2004-2006) Carlos Piani • Worked for 6 years at Banco Pactual in the Principal Investments and Corporate Finance divisions CEO • Degree in Computer Science from PUC-RJ and in Business Administration from IBMEC. CFA chartered by CFA Institute in 2003. Concluded the Owner and President Management Program of Harvard Business School in 2008 • CFO and IRO of Equatorial since 2008. IRO of CEMAR since 2008. Eduardo Haiama • Between 2004 and 2008, Mr. Haiama worked at Banco UBS Pactual on the equities’ research team as senior analyst of the utilities segment. CFO & IRO • Received a degree in electric engineering at USP – University of São Paulo (Escola Politécnica) and postgraduated at a MBA Course at Duke University. • Regulatory Affairs Officer of Equatorial since April 2008 and of CEMAR since August 2006 Tinn Amado • Consulting partner of Amado Consultoria, providing advisory services in economic regulation Regulatory Affairs • Worked at ANEEL for 3 years as an analyst for the Distribution Service Regulation Department Officer • Degree in Electrical Engineering from the Federal University of Itajubá (UNIFEI) and a Master’s degree in Regulation and Protection of Fair Trading from Brasília University (UnB) 8
  • 9.
    PCP Fund History • In 2001, Banco Pactual created a Principal Investment Unit to manage the partnership’s PCP Fund excess capital and diversify its investments Long Term Hedge Funds Brazil • In 2006, with the sale of Banco Pactual to UBS, Fund of Funds (G7) Investments and EM part of the proceeds from the sale was reinvested in the Principal Investment Unit, which was • Fundamental and long-only renamed UBS Pactual Alternative Investments Public Equities strategy • Acquisition of control or shared • Today, UBS Pactual Alternative Investments control of private and public Private Equity manages the capital of Pactual’s former companies (Ex: Iven, Light, partners through a major fund of funds entitled Equatorial) PCP, formerly named Pactual Capital Partners Real Estate • Investments through PCP’s associated company PDG Realty • PCP has over US$3 billion under management with investments in fund of funds, hedge funds, public equities, private equity and real estate 9
  • 10.
    Agenda ►Company Profile ►Financial Performance ►Portfolio Overview ►Value Creation 10
  • 11.
    Financial Performance Since CEMAR’s acquisition, Equatorial has been presenting an excellent financial performance Net Operating Revenues EBITDA and Margin EBITDA R$ million R$ million / % of NOR CAGR = 21% CAGR = 42% 43% 42% 879 810 379 629 30% 341 526 423 22% 16% 189 93 85 2003 2004 2005 2006 2007 2003 2004 2005 2006 2007 11
  • 12.
    Financial Performance Sustained positive results allowed Equatorial to pay out R$401 million in dividends Net Income Declared Dividends R$ million R$ million 229 165 151 154 123 125 85 2003 2004 2005 2006 2007 2003 2004 2005 2006 2007 (57) Total = R$401million 12
  • 13.
    Financial Performance Improved operating performance and financial restructuring led to a significant reduction in leverage Consolidated Net Debt and Net Debt/EBITDA R$ million / Times 627 6.7 339 305 4.0 225 1.6 105 0.6 0.3 2003 2004 2005 2006 2007 13
  • 14.
    Financial Performance Light’s incorporation in the 1Q08 substantially increased Equatorial’s operating result… Quarterly EBITDA and EBITDA Margin R$ million/% of Net Revenues 250 48% 45% 45% Growth (3Q08/3Q07) 208 = 100% 42% 39% 44% 200 43% 39% 173 165 36% 28% 36% 150 29% 32% 24% 109 24% 104 104 98 93 100 18% 20% 77 68 67 65 47 50 36 31 34 24 - 3Q04 4Q04 1Q05 2Q05 3Q05 4Q05 1Q06 2Q06 3Q06 4Q06 1Q07 2Q07 3Q07 4Q07 1Q08 2Q08 3Q08 14
  • 15.
    Financial Performance …without affecting financial leverage Consolidated Net Debt and Net Debt / EBITDA 900 R$ million / Times 3,9 806 800 4,0 2,4 749 1,5 0,6 0,6 1,1 3,3 3,0 0,3 0,7 700 1,6 0,7 0,3 0,5 0,9 1,3 582 600 500 400 382 373 385 360 339 332 305 300 242 244 225 180 176 200 105 105 100 - 3Q04 4Q04 1Q05 2Q05 3Q05 4Q05 1Q06 2Q06 3Q06 4Q06 1Q07 2Q07 3Q07 4Q07 1Q08 2Q08 3Q08 15
  • 16.
    Agenda ►Company Profile ►Financial Performance ►Portfolio Overview ►Value Creation 16
  • 17.
    CEMAR: Highlights Energy Sales (2007) RR AP 18% 3,219 GWh 40% AM MA CE 11% PA RN PB PI AC TO PE AL MA RO SE BA MT 31% GO DF MG MS ES Residential Commercial Industrial Others SP RJ Clients (2007) PR 5% 7% 1% SC RS 1.4 million  Distribution company in the State of Maranhão  1.4 million clients (4th largest in the Northeast region)*  Billed energy (2007): 3,219 GWh (5th largest in the Northeast)* 87%  Annual gross revenues of R$1.2 billion in 2007 *Source: ABRADEE Residential Commercial Industrial Others 17
  • 18.
    CEMAR: History CEMAR under PPL Global’s CEMAR under control of control Equatorial 1958- Aug.2000- Aug.2002-May May 2004- Jun. 2000 Aug.2002 2004 Present State owned ANEEL’s intervention 18
  • 19.
    CEMAR: Ownership Structure Eletrobrás Equatorial Energia Eletrobrás Equatorial Energia Others 33.6% 65.1% 1.2% CEMAR 19
  • 20.
    CEMAR: Distribution • 1.4 million clients in 217 municipalities, covering the 2005 2006 2007 9M08 whole state of Maranhão (total area 333,000 km²) Net Revenues R$ MM 665 810 879 721 PMSO R$ MM 126 129 126 105 • Energy sales reached 3,219 GWh in 2007, 10.5% higher than in 2006. Maranhão presented one of the EBITDA R$ MM 189 341 379 305 highest growth rates of energy consumption in Brazil Clients '000 1.254 1.349 1.438 1.511 • Service quality has been presenting positive evolution. PMSO/Client R$/Client 101 95 88 70 Since 2003, DEC and FEC indices have dropped 58% EBITDA/Client R$/Client 150 253 264 201 and 49%, respectively DEC (*) Hours/Year/Client 54.6 42.6 28.7 27.8 • More than 151 thousand clients connected through the FEC (*) Times/Year/Client 39.3 32.9 24.6 18.6 Light for All Program Losses (LTM) % 29.5% 29.8% 28.7% 28.6% • In 12/07, energy losses reached 28.7%, 1.1 pp lower CAPEX R$ MM 103 137 199 172 than in 2006 PLPT(**) R$ MM 129 169 195 120 (*) Last 12 months • Tariff readjustments occur every August, with next tariff (**) Light for All Program revision set to 08/09 20
  • 21.
    Light S.A.: Highlights Energy Sales (2007) 7,5% RR AP 11,0% 18,307 GWh AM MA CE 40,1% PA RN PB PI PE AC TO AL RO SE BA MT GO DF 31,4% MG MS ES SP RJ PR Residential Commercial Industrial Others SC EBITDA by Segment (2007) RS 0,3% 15,2% R$1.1 billion  Holding company with distribution, generation and trading interests  3rd largest distributor in Brazil in terms of energy sales*  4th largest customer base in Brazil*  Generation plants with 852 MW of installed capacity  Gross revenues of more than R$8 billion in 2007 84,5% *Source: ABRADEE and Light Distribution Generation Trading 21
  • 22.
    Light S.A.: History Acquisition by Eletropaulo’s Acquisiton by EDF Eletrobrás RME acquires acquistion control of Light 1905 1979 May 1996 Apr. 1998 Oct.2001 Jan.2002 Jul.2005 Aug. 2006 Light joined Creation of Light, a Light’s Privatization Split of EDF-AES Bovespa’s Novo private Company Mercado • After a negative result in its 2003 tariff revision process and poor management, Light became insolvent and was forced to renegotiate its debt with creditors • In March, 2006, a consortium (RME) formed by PCP, Cemig, AG Concessões and Luce Fund won a competitive bidding process for the acquisition of a controlling stake at Light • The consortium acquired 79.4% of Light’s total and voting capital for US$320 milllion • After fulfilling a series of prerequisites, including the approval of regulatory authorities in Brazil and France, the consortium effectively took over the company in August, 2006 22
  • 23.
    Light S.A.: OwnershipStructure CEMIG AGC LUCE Companhia Energètica Andrade Gutierrez LUCE do Brasil EQTL Fundo de Investimento Equatorial Energia de Minas Gerais Concessões em Participações 25.0% 25.0% 25.0% 25.0% RME Rio Minas Energia Participações S.A Free Float: 47,8% 52.2% 33.7% BNDESPAR LIGHT S.A. (Holding) 14.1% MARKET Light S.E.S.A Light Energia Light EscoLtda Lightger (Distribution) (Generation) (Trading) (New Projects) 23
  • 24.
    Light S.A.: Distribution 2005 2006 2007 9M08 • 3.9 million clients in 31 municipalities in Rio de Janeiro, covering 25% of the state, which represents a 10,970 km² area Net Revenues R$ MM 4.875 4.743 4.755 3.579 • Energy sales reached 18,307 GWh, accounting for approximately 72% of all electricity consumed in the State in PMSO R$ MM 511 533 567 413 2007 EBITDA R$ MM 751 599 938 748 • Service quality among the highest in Brazil. In the 1H08, the FEC (LTM) index reached 7.8x and the DEC (LTM) index Clients '000 3.732 3.802 3.881 3.741 11.4 h • Collection rate improved significantly after the change in PMSO/Client R$/Client 137 140 146 110 control, increasing from 93% in 2006 to 99.4% in 2007 • Energy losses, which totaled 20.4% in 2Q08, represent a EBITDA/Client R$/Client 201 158 242 199 challenge in the concession area DEC (*) Hours/Year/Client 8.8 8.0 9.1 11.5 • The last tariff revision, held in november 2008, Light’s tariff increased by 1.96% FEC (*) Times/Year/Client 7.7 6.3 6.3 7.1 Losses % 18.7% 19.8% 20.6% 20.4% CAPEX R$ MM 277 322 330 405 (*) Last 12 months 24
  • 25.
    Light S.A.: Generation 2005 2006 2007 9M08 • Light owns and operates 5 hydro power plants Net Revenues R$ MM 20 249 271 197 and two water pumping stations PMSO R$ MM 3 55 60 93 EBITDA R$ MM 14 147 169 153 • The 5 plants are located in three generation Assured Capacity MW 537 537 537 537 regions: Santa Branca, Lajes and Ilha dos Pombos EBITDA/Assured Cap. R$'000/MW 26 274 314 284 • Total installed capacity of 852 MW, for assured energy of 537 MW • Light Generation has average contract selling price of R$60/MWh, with the bulk of contracts expiring in 2012 and 2013 • 3 new hydro power plants currently being developed: SHP Paracambi (25 MW of installed capacity) and SHP Lajes (17 MW) in the Lajes complex and HPP Itaocara on the Paraíba do Sul River (195 MW) 25
  • 26.
    Light S.A.: Trading •Through its subsidiary Light Esco, Light acts as a trader and broker for free clients 2005 2006 2007 9M08 • In its trading activities, Light has 30 clients with total energy sales of 90 GWh in 2007 Net Revenues R$ MM - 4 31 24 PMSO R$ MM - 2 9 22 • Clients include Unilever and InBev EBITDA R$ MM - 2 4 2 • As a broker, Light has 10 clients, including TV Globo and Gerdau Steel and traded 1,200 GWh in 2007 26
  • 27.
    Geranorte: Ownership Structure Fundo de GNP* Equatorial Energia Investimento em Participações Brasil 50.0% 25.0% 25.0% Geranorte *GNP is composed by Servtech (50%) and Grupo Ligna (50%) 27
  • 28.
    Geranorte: Highlights • Two thermoelectric power plants fueled by high-viscosity heavy oil • Location: Miranda do Norte, Maranhão. • Joint installed capacity of 331 MW • 240 MW of energy sold at the A-3 auction in 2007 • Total fixed annual revenue (for both plants) of R$ 136.2 million, during 15 years • Start-up scheduled for January of 2010 • Total CAPEX: Between R$500 million and R$ 550 million • Equatorial’s share of CAPEX (25%): R$125 million. Equity = approximately R$45 million 28
  • 29.
    Agenda ►Company Profile ►Financial Performance ►Portfolio Overview ►Value Creation 29
  • 30.
    Strengths Financial strength and solid Growth prospects and management team with consolidation opportunities turnaround experience Result-oriented management High level of model Corporate Governance 30
  • 31.
    Contacts Carlos Piani CEO Eduardo Haiama CFO and IRO Thomas Newlands IR Analyst Phone 1: 55 21 3206-6635 Phone 2: 55 21 3206-6607 E-mail: ir@equatorialenergia.com.br Website: http://www.equatorialenergia.com.br/ir 31
  • 32.
    Disclaimer ► This presentationmay contain forward-looking statements, which are subject to risks and uncertainties, as they were based on the expectations of Company’s management and on available information. These prospects include statements concerning the Company’s current intensions or expectations for our clients. ► Forward-looking statements refer to future events which may or may not occur. Our future financial situation, operating results, market share and competitive positioning may differ substantially from those expressed or suggested by said forward-looking statements. Many factors and values that can establish these results are outside Company’s control or expectation. The reader/investor is prevented not to completely rely on the information above. ► The words “believe", “can", “predict", “estimate", “continue", “anticipate", “intend", “forecast" and similar words, are intended to identify affirmations. Such estimates refer only to the date in which they were expressed, therefore Company has no obligation to update said statements. ► This presentation does not consist of offering, invitation or request of subscription offer or purchase of any marketable securities. And, this statement or any other information herein, does not consist of a contract base or commitment of any kind. 32